New Orleans One Year After Katrina: Obtaining a Representative Sample and Conducting a House-to-House Survey
|
|
|
- Thomasine Heath
- 5 years ago
- Views:
Transcription
1 New Orleans One Year After Katrina: Obtaining a Representative Sample and Conducting a House-to-House Survey Mollyann Brodie, PhD Vice President, Public Opinion & Media Research, Kaiser Family Foundation DC-AAPOR Seminar: Surveying Under Adverse Conditions October 9, 2007
2 Giving Voice to the People of New Orleans Sept. 2005: Survey of evacuees in the Houston shelters June 2006: National survey of Americans attitudes toward the recovery effort Sept. Nov. 2006: Face-to-face survey of New Orleans area residents

3 Lake Pontchartrain Jefferson Parish Orleans Parish St. Bernard Parish Jefferson Parish Plaquemines Parish


4 ONE YEAR LATER
5 Challenges we faced Objective: To obtain a representative sample of people currently residing in New Orleans, and be able to talk specifically about key neighborhoods to assist in rebuilding planning efforts Barriers: Lack of any reliable demographic information about who was actually living where Conventional wisdom about influx of Latinos post-katrina Temporary housing situations (FEMA trailer parks, tent cities, hotels, etc.) Lack of money Lack of trained interviewers in the New Orleans area Needed neighborhood-level population estimates in order to properly draw and weight the sample
6 What we knew at the time Rapidly changing population as people returned to the area Few existing estimates of who was there post-katrina Post office Delivery Sequence File (DSF) was not updated before we went in the field, so we used pre- Katrina DSF combined with estimates of housing destruction by neighborhood to determine how many segments to select in each neighborhood
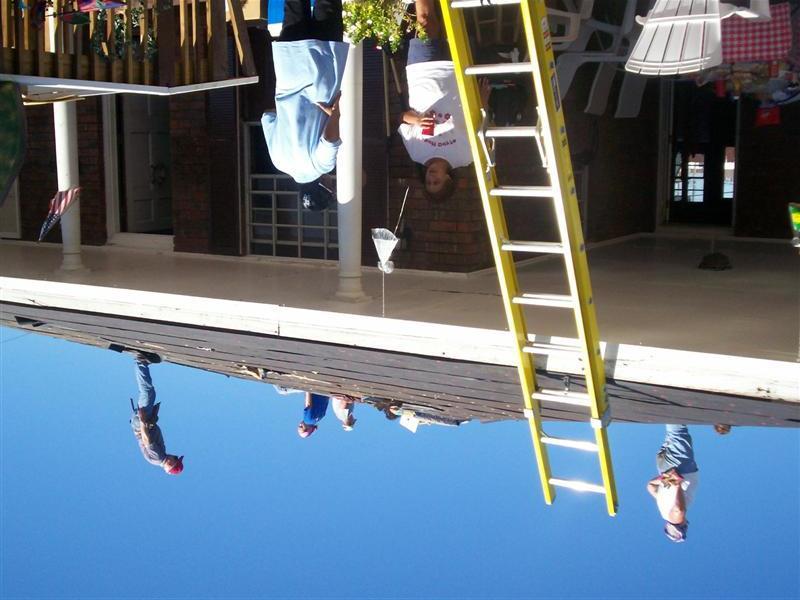
7 Methodology Four Parish Area: Orleans, Jefferson, Plaquemines, St. Bernard Face-to-face interviews with 1,504 randomly selected adults Stratified area probability sample: 456 randomly selected Census-defined areas Visited and documented condition of 17,000 housing locations within those areas Random selection of households and individuals, resulting in 1,504 interviews Oversample in Orleans Parish; results weighted so that total reflects expected population in each parish and neighborhood Interviews in English and Spanish Interviewing Sept. 12 thru Nov. 13, 2006 Margin of sampling error +/-4 overall, +/-5 for results based on Orleans or Jefferson Parishes

8
9 Pre-Katrina DSF Addresses Street Address City State ZIP Code ZIP+4 Current DSF TH ST NEW ORLEANS LA TH ST NEW ORLEANS LA TH ST NEW ORLEANS LA TH ST NEW ORLEANS LA TH ST NEW ORLEANS LA /2 18TH ST NEW ORLEANS LA TH ST NEW ORLEANS LA TH ST NEW ORLEANS LA TH ST NEW ORLEANS LA TH ST NEW ORLEANS LA TH ST NEW ORLEANS LA X TH ST NEW ORLEANS LA /2 18TH ST NEW ORLEANS LA TH ST NEW ORLEANS LA TH ST NEW ORLEANS LA TH ST NEW ORLEANS LA TH ST NEW ORLEANS LA TH ST NEW ORLEANS LA TH ST NEW ORLEANS LA TH ST NEW ORLEANS LA TH ST NEW ORLEANS LA TH ST NEW ORLEANS LA TH ST NEW ORLEANS LA TH ST NEW ORLEANS LA TH ST NEW ORLEANS LA TH ST NEW ORLEANS LA TH ST NEW ORLEANS LA TH ST NEW ORLEANS LA TH ST NEW ORLEANS LA TH ST NEW ORLEANS LA TH ST NEW ORLEANS LA TH ST NEW ORLEANS LA TH ST NEW ORLEANS LA TH ST NEW ORLEANS LA TH ST NEW ORLEANS LA TH ST NEW ORLEANS LA FLEUR DE LIS DR NEW ORLEANS LA PONTCHARTRAIN BLVD NEW ORLEANS LA PONTCHARTRAIN BLVD NEW ORLEANS LA PONTCHARTRAIN BLVD NEW ORLEANS LA PONTCHARTRAIN BLVD NEW ORLEANS LA PONTCHARTRAIN BLVD NEW ORLEANS LA X
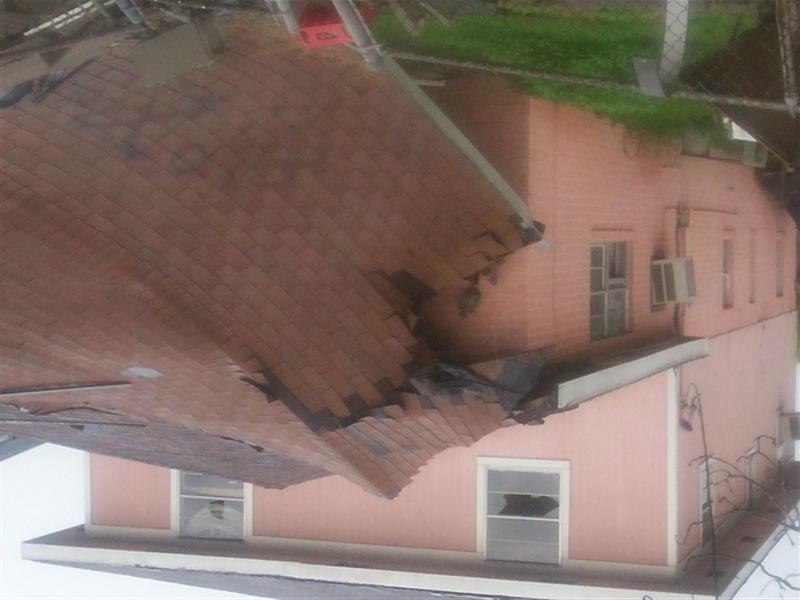
10 Fieldworker-assessed destruction status Completely destroyed: apparent utter destruction (i.e. house not standing, no roof remaining) Seriously damaged: apparent but not catastrophic damage (i.e. boarded up windows, seriously damaged roof) Not seriously damaged: any housing unit not fitting in above categories (Note: likely to be an overestimate, since many apparently livable households were vacant and interviewers could not determine conditions indoors)
11 Housing Destruction by Parish Orleans Jefferson St. Bernard Plaquemines % completely destroyed 6% 1% 25% 6% % seriously damaged 27% 3% 38% 13% % not seriously damaged 54% 77% 32% 77% % undetermined/ no access 13% 19% 4% 4% Total households observed or visited 11,332 4,
12 Housing Destruction in Orleans Parish Orleans Parish Total (11,332 units) Percent completely destroyed or seriously damaged Completely destroyed or seriously damaged Lower 9 th Ward (317 units) 97% Undetermined/ No access 13% 33% New Orleans East (1,336 units) 65% Garden District (1,715 units) 22% 54% Uptown (1,813 units) 22% Not seriously damaged Algiers (1,598 units) 9% Source: The Kaiser Post-Katrina Baseline Survey of the New Orleans Area (conducted September 12 November 13, 2006)
13 Vacancy Rates in Orleans Parish Among households in Orleans Parish classified as not seriously damaged where interviews were attempted: 52% were occupied 1,577 1,469 48% were vacant
14

15
16 Weighting Original plan was to weight using only the information we found in the field to determine occupancy rates by neighborhood. Problem with the approach is that it is less reliable in smaller neighborhoods where we only visited a few blocks. In October 2006, an updated DSF file became available from USPS, so it was possible to use DSF to create independent estimates of occupied housing units for each segment. HOWEVER, we were concerned that DSF might overestimate occupied households in a place like New Orleans, where people might be receiving mail but not living in a given household. FURTHER, we were concerned that the DSF overstatement might vary by neighborhood, and this variation could be dependent on the level of post-katrina destruction. SO, we used the results of our fieldwork to create an adjustment factor for each neighborhood by matching entire blocks from our sample to the DSF file and counting how many occupied households our fieldworkers found compared with how many DSF said were occupied.
17 Uptown STBernard Plaquemines Noeast Midcity Marigny Lower 9th Lakeview Jefferson Gentilly Garden Dist French Qtr EnglishTurn BWCooper Audubon Algiers th Ward Grand Total Stratum Adjustment Factor Raw Diff Fieldwork count: Occupied HHs October 2006 DSF: Active Residences Stratum DSF adjustments by neighborhood Uptown STBernard Plaquemines Noeast Midcity Marigny Lower 9th Lakeview Jefferson Gentilly Garden Dist French Qtr EnglishTurn BWCooper Audubon Algiers th Ward Grand Total Stratum Adjustment Factor Raw Diff Fieldwork count: Occupied HHs October 2006 DSF: Active Residences Stratum Uptown STBernard Plaquemines Noeast Midcity Marigny Lower 9th Lakeview Jefferson Gentilly Garden Dist French Qtr EnglishTurn BWCooper Audubon Algiers th Ward Grand Total Stratum Adjustment Factor Raw Diff Fieldwork count: Occupied HHs October 2006 DSF: Active Residences Stratum Uptown STBernard Plaquemines Noeast Midcity Marigny Lower 9th Lakeview Jefferson Gentilly Garden Dist French Qtr EnglishTurn BWCooper Audubon Algiers th Ward Grand Total Stratum Adjustment Factor Raw Diff Fieldwork count: Occupied HHs October 2006 DSF: Active Residences Stratum
18 Using secondary information (DSF) reduced the variance of estimates made using only fieldwork information Selection stratum DSF-adjusted estimate Estimate using fieldwork observations only Lakeview neighborhood Total 2,113 2, , SD Mean CV
19 Population information that became available after we went in the field In June 2006, Census (ACS) released 2005 ACS Special Product for the Gulf Coast Area, containing population and demographic estimates for Sept.-Dec for areas affected by the hurricanes, including the New Orleans MSA and Jefferson Parish, but no parish- or neighborhood-level estimates for Orleans In January 2007, Louisiana Health & Population Survey released results of household mail surveys conducted June- October 2006, including population estimates by Parish, but not by neighborhood In April 2007, the Census released updated estimates of population numbers at the Parish level as of July 2006
20 How our estimates compared KFF LHPS Census Sample frame date October 2006 June 2006 July 2006 Orleans 220, , ,388 Jefferson 455, , ,361 Plaquemines 16,298 17,860 22,512 St. Bernard 18,278 25,296 15,514 4-Parish Area 711, , ,775
21 When did people come back? 28% 19% 18% 1% 7% 3% 4% 2% 2% 2% 2% 2% 1% 1% 5% Never left Aug- 05 Sep- 05 Oct- 05 Nov- 05 Dec- 05 Jan- 06 Feb- 06 Mar- 06 Apr- 06 May- 06 Jun- 06 Jul- 06 Aug- 06 Sep- 06 Source: The Kaiser Post-Katrina Baseline Survey of the New Orleans Area (conducted September 12 November 13, 2006)
22 What does this mean for other survey projects in New Orleans? As population becomes more stable, further surveys should be easier Better estimates exist now, including updated demographics from Census (ACS) for 2006 Possible to do phone surveys now and still get a good sample? Need to include cell phones?
23 Cell phone and land line coverage Cell phone only Cell phone + land line Land line only No cell phone or land line Total 4- parish area 21% 62% 14% 3% Orleans 27% 52% 15% 3% Jefferson 14% 67% 15% 3% Source: The Kaiser Post-Katrina Baseline Survey of the New Orleans Area (conducted September 12 November 13, 2006)
24 Brookings/Census Report on 2006 New Orleans population: Key Findings One year after the storms, the city of New Orleans black population declined by 57 percent, while its white population decreased by 36 percent (yet the city remained a majority minority community). New Orleans 2006 post-storm population was smaller, older, more educated, less poor, with fewer renters, and fewer households with children than was recorded in Census Compared with stayers in the city of New Orleans, out-migrants were younger, poorer, more likely to be black, and more likely to have children. One year after the storm, black New Orleanians were most likely to have moved to the Houston metro area, whereas whites mostly moved elsewhere in the New Orleans metropolitan area.
25 Influx of Latinos? Orleans Jefferson Census 2000 KFF 2006 Diff Census 2000 KFF 2006 Diff Adults by race White non-hispanic 31% 39% +8% 69% 62% -7% Black non-hispanic 62% 53% -9% 20% 19% -1% Hispanic 3% 5% +2% 7% 13% +6% Other 4% 3% -1% 4% 6% +2%
26 Recent Brookings/Census publication One aspect of these estimates that may appear surprising is the relatively small Hispanic population that appears in the Census Bureau s 2006 estimates for New Orleans city and its metropolitan areas This is the case despite the fact that both [pre- and post-katrina] data sources included group quarters populations as well as household populations living in permanent residences. However, any group quarters that were established after the ACS sampling frame was established were not included in the survey. To the extent that Latino workers moved to New Orleans after the storm and lived in hastily arranged housing, it is very likely that the transitory nature of temporary working conditions of primarily Hispanic construction and service workers has eluded traditional estimation and survey techniques.
27 What does this mean for surveys in areas with rapidly changing populations? Try to use the best available information at the time Hybrid approaches to sampling and weighting can help
Planning in Post-Katrina New Orleans. Photo: CNN
 Planning in Post-Katrina New Orleans Photo: CNN Hurricane Katrina Photo: NOAA Stephen D. Villavaso, FAICP Hurricane Katrina Source: Times-Picayune Before dawn on the morning of Monday, August 29 th, Hurricane
Problem Set #3 Key. Forecasting
 Problem Set #3 Key Sonoma State University Business 581E Dr. Cuellar The data set bus581e_ps3.dta is a Stata data set containing annual sales (cases) and revenue from December 18, 2004 to April 2 2011.
Improving Capacity for Crime Repor3ng: Data Quality and Imputa3on Methods Using State Incident- Based Repor3ng System Data
 Improving Capacity for Crime Repor3ng: Data Quality and Imputa3on Methods Using State Incident- Based Repor3ng System Data July 31, 2014 Justice Research and Statistics Association 720 7th Street, NW,
Mango Retail Performance Report 2017
 Mango Retail Performance Report 2017 1 Table of Contents Pages 3-9 Pages 10-15 Pages 16-34 Pages 35-44 Pages 45-51 Pages 52-54 Executive Summary Fruit and Tropical Fruit Performance Whole Mango Performance
Hurricane Katrina: How the Business Recovery of New Orleans is Progressing
 Hurricane Katrina: How the Business Recovery of New Orleans is Progressing Louis C. Mancuso, Ph.D. Professor Southern University at New Orleans New Orleans, Louisiana, USA Lman454574@aol.com Abstract In
Coffee prices maintain downward trend as 2015/16 production estimates show slight recovery
 Coffee prices maintain downward trend as 2015/16 production estimates show slight recovery The coffee market fell again in December 2015, reaching its second lowest monthly average of the year. This decrease
Price monitoring of key food items in Donetsk and Luhansk Oblasts
 Market update Issue (October ) UKRAINE Price monitoring of key food items in Donetsk and Luhansk Oblasts Fighting hunger worldwide Highlight Cost of food basket remained higher at national level throughout
MANGO PERFORMANCE BENCHMARK REPORT
 MANGO PERFORMANCE BENCHMARK REPORT 2015-2016 TABLE OF CONTENTS Page 3 Page 5 Page 12 Page 15 Page 27 Page 36 Page 46 Approach and Data Set Parameters Overview and Mango Trend-Spotting Fruit and Tropical
Release #2461 Release Date: Thursday, February 20, 2014
 THE FIELD POLL THE INDEPENDENT AND NON-PARTISAN SURVEY OF PUBLIC OPINION ESTABLISHED IN 1947 AS THE CALIFORNIA POLL BY MERVIN FIELD Field Research Corporation 601 California Street, Suite 900 San Francisco,
Dairy Outlook. December By Jim Dunn Professor of Agricultural Economics, Penn State University. Market Psychology
 Dairy Outlook December 2015 By Jim Dunn Professor of Agricultural Economics, Penn State University Market Psychology The Class III market has taken a beating lately as cheese prices have drifted down and
Date: April 15, Holly Henry From: Daniel DeVries Results from New York survey.
 Date: April 15, 2009 To: Holly Henry hhenry@cspinet.org From: Daniel DeVries dan@zogby.com RE: Results from New York survey Methodology Zogby International was commissioned by the Center for Science in
NMTC TARGETED POPULATIONS
 NMTC TARGETED POPULATIONS Designation of Eligible Communities Serving Targeted Populations in the Gulf Opportunity Zone The Internal Revenue Service (IRS) recently published a Notice providing guidance
Summary Report Survey on Community Perceptions of Wine Businesses
 Summary Report Survey on Community Perceptions of Wine Businesses Updated August 10, 2018 Conducted by Professors David McCuan and Richard Hertz for the Wine Business Institute School of Business and Economics
2007 Sonoma Research Associates - All rights reserved.
 2007 Sonoma Research Associates - All rights reserved. Practical Applications of the Price Elasticity of Demand Presented by Dan Karnowsky, President Sonoma Research Associates Presented at Competitive
Update : Consumer Attitudes
 Blah blah blah blah blah Consumers developed 40 words/attributes to describe commercially available EVOOs. Sensory differences were independent of country of origin. Update : Consumer Attitudes There was
Seasonal trends in hectares planted, sales volumes on markets and market prices. Pieter van Zyl, Potatoes South Africa
 Seasonal trends in hectares planted, sales volumes on markets and market prices Pieter van Zyl, Potatoes South Africa Producers plant between 5 and 54 hectares of potatoes each year. According to Figure
Coffee market remains volatile but lacks direction
 Coffee market remains volatile but lacks direction Prices fluctuated significantly during August, with the ICO composite indicator dropping by 10 cents before jumping back up another 12 cents by the end
Timmie s tops in customer satisfaction
 FOR IMMEDIATE RELEASE Timmie s tops in customer satisfaction Starbucks and Tim Horton s lead in Canada - In a random sampling of public opinion taken by the Forum Poll among 1326 Canadian adults, Tim Horton
MONTHLY COFFEE MARKET REPORT
 E MONTHLY COFFEE MARKET REPORT February 2014 February 2014 has seen significant developments in the coffee market, with prices shooting upwards at a startling rate. The ICO composite daily price has increased
City Of Memory: New Orleans, Before And After Katrina (Center Books On The American South) READ ONLINE
 READ ONLINE") City Of Memory: New Orleans, Before And After Katrina (Center Books On The American South) READ ONLINE If you are searched for the ebook City of Memory: New Orleans, Before and After Katrina (Center Books
City Of Memory: New Orleans, Before And After Katrina (Center Books On The American South) READ ONLINE If you are searched for the ebook City of Memory: New Orleans, Before and After Katrina (Center Books
MONTHLY COFFEE MARKET REPORT
 1 E MONTHLY COFFEE MARKET REPORT March 2014 Ongoing uncertainty over the Brazilian coffee crop has caused significant fluctuations in coffee prices during March, with monthly volatility of the International
THIS REPORT CONTAINS ASSESSMENTS OF COMMODITY AND TRADE ISSUES MADE BY USDA STAFF AND NOT NECESSARILY STATEMENTS OF OFFICIAL U.S.
 THIS REPORT CONTAINS ASSESSMENTS OF COMMODITY AND TRADE ISSUES MADE BY USDA STAFF AND NOT NECESSARILY STATEMENTS OF OFFICIAL U.S. GOVERNMENT POLICY Required Report - public distribution Date: GAIN Report
MONTHLY COFFEE MARKET REPORT
 E MONTHLY COFFEE MARKET REPORT May 2014 After five consecutive months of rising prices, the coffee market reversed lower in May. From a high of 179 cents/lb in April, the daily price of the ICO composite
Coffee market ends 2017/18 in surplus
 Coffee market ends 217/18 in surplus World coffee production in coffee year 217/18 is estimated 5.7% higher at 164.81 million bags as output of Arabica increased by 2.2% to 11.82, and Robusta grew 11.7%
Coffee market ends 2016/17 coffee year in deficit for the third consecutive year
 Coffee market ends 2016/17 coffee year in deficit for the third consecutive year The ICO composite indicator continued its downward trend that started at the end of August, averaging 124.46 US cents/lb.
QUARTERLY REVIEW OF THE PERFORMANCE OF THE DAIRY INDUSTRY 1
 QUARTERLY REVIEW OF THE PERFORMANCE OF THE DAIRY INDUSTRY 1 The information in this document is from sources deemed to be correct. Milk SA, the MPO and SAMPRO are not responsible for the results of any
much better than in As may be seen in Table 1, the futures market prices for the next 12 months
 Dairy Outlook December 2009 By Jim Dunn Professor of Agricultural Economics, Penn State University Market Psychology prices are higher than last month, especially Class IV. The outlook for dairy prices
Federal Milk Market Administrator U.S. Department of Agriculture. H. Paul Kyburz, Market Administrator
 Federal Milk Market Administrator U.S. Department of Agriculture UPPER MIDWEST DAIRY NEWS H. Paul Kyburz, Market Administrator Volume 9, Issue 7 Upper Midwest Marketing Area, Federal Order No. 30 July
Comparing canola and lupin varieties by time of sowing in the Northern Agricultural Region
 Comparing canola and lupin varieties by time of sowing in the Northern Agricultural Region Martin Harries and Greg Shea, DPIRD Key messages Lupin yielded 3.0 t/ha and canola 2.0 t/ha from late May emergence.
Coffee Season 2013/14 Finishes in Balance but Deficit Expected Next Year
 Coffee Season 2013/14 Finishes in Balance but Deficit Expected Next Year Coffee prices were volatile again over the course of September, mostly reacting to weather news from Brazil. Daily prices fell initially
GLOBAL DAIRY UPDATE KEY DATES MARCH 2017
 MARCH 2017 GLOBAL DAIRY UPDATE European milk production decreased for the seventh consecutive month, while the US remains strong. The rate of decline in New Zealand production is easing. US exports continue
Record exports in coffee year 2017/18
 Record exports in coffee year 2017/18 Total coffee exports increased each year since 2010/11 with a new record reached in 2017/18 at 121.86 million bags, 2% higher than 2016/17. In the twelve months ending
July marks another month of continuous low prices
 July marks another month of continuous low prices In July 2018, the ICO composite indicator price decreased by 2.9% to an average of 107.20 US cents/lb, which is the lowest monthly average for July since
MONTHLY COFFEE MARKET REPORT
 E MONTHLY COFFEE MARKET REPORT June 2013 Coffee prices fell sharply in June 2013, as market fundamentals, combined with an uncertain macroeconomic outlook, drove the ICO composite indicator price to its
Mealybug Species. Vine Mealybug. Grape and Obscure Mealybugs. Longtailed Mealybug. Pink Hibiscus Mealybug. Gills Mealybug
 Vine Mealybug: Managing a Key Grape Pest Walt Bentley, Kent Danne, David Haviland, Steve Vasquez, Andrew Molinar University of California, Cooperative Extension Mealybug Species Vine Mealybug Grape and
(
 Supplementary Online Material of (http://doi.org/10.3920/jiff2016.0033) Journal of Insects as Food and Feed Knowledge, attitudes and practices on edible insects in Lango sub-region, northern Uganda J.
Coffee prices rose slightly in January 2019
 Coffee prices rose slightly in January 2019 In January 2019, the ICO composite indicator rose by 0.9% to 101.56 US cents/lb as prices for all group indicators increased. After starting at a low of 99.16
Record Exports for Coffee Year 2016/17
 Record Exports for Coffee Year 2016/17 Total exports in September 2017 reached 8.34 million bags, compared to 9.8 million in September 2016. While coffee year 2016/17 registered a decrease in its final
Coffee market continues downward trend
 Coffee market continues downward trend Since August 2017, the ICO composite indicator price has declined in each month except January 2018. The composite indicator decreased by 1.1% in March 2018 to an
Brady Center to Prevent Gun Violence
 Brady Center to Prevent Gun Violence Findings from a National Survey of 600 Registered Voters April 26-28, 2010 Celinda Lake, Joshua Ulibarri, and Christopher Panetta Attitudes Toward Open Carry Gun Laws
SFR Condo Residential Lot Sales Inventory Sales Inventory Sales Inventory. Month YTD Month Month YTD Month Month YTD Month
 Grand Strand Market Report 2016 Sales activity in the Grand Strand ended 2016 with a solid month of sales. SFR sales are up 2.0% for the month and up 4.1% for the year; setting a new market record for
Coffee market settles lower amidst strong global exports
 Coffee market settles lower amidst strong global exports The ICO composite indicator price declined by 1.2% in February 2018 to an average of 114.19 US cents/lb. Indicator prices for all three Arabica
SFR Condo Residential Lot Sales Inventory Sales Inventory Sales Inventory. Month YTD Month Month YTD Month Month YTD Month
 Grand Strand Market Report 2018 was a strong month for sales activity in the Grand Strand with SFR and condo sales volume up 5.11% and 19.14%, respectively, for the month. Residential lot sales are also
Downward correction as funds respond to increasingly positive supply outlook
 Downward correction as funds respond to increasingly positive supply outlook Coffee prices fell sharply at the end of April as institutional investors sold off their positions. The coffee market continues
Fresh Produce Report. P13: 12 w/e 3rd January Kantar Worldpanel
 Fresh Produce Report P13: 12 w/e 3rd January 2016 1 HOW IS TOTAL PRODUCE PERFORMING? Total Produce is worth 2.1bn and is growing by 4.1% compared to the same period last year. Much of this is driven by
Consumer Price Index
 KINGDOM OF Consumer Price Index Website: E-mail : Statistics Department P.O. Box 149 Nuku alofa Kingdom of Tonga www.spc.int/prism/tonga/ dept@stats.gov.to Mar, 2018 Price: $ 2.50 Fig 3: Contribution
UPPER MIDWEST MARKETING AREA THE BUTTER MARKET AND BEYOND
 UPPER MIDWEST MARKETING AREA THE BUTTER MARKET 1987-2000 AND BEYOND STAFF PAPER 00-01 Prepared by: Henry H. Schaefer July 2000 Federal Milk Market Administrator s Office 4570 West 77th Street Suite 210
WEEKLY MAIZE REPORT 13 JUNE 2018
 17/08/01 17/08/15 17/08/29 17/09/12 17/09/26 17/10/10 17/10/24 17/11/07 17/11/21 17/12/05 17/12/19 18/01/02 18/01/16 18/01/30 18/02/13 18/02/27 18/03/13 18/03/27 18/04/10 18/04/24 18/05/08 18/05/22 18/06/05
TRENDS IN SALES OF MILK & DAIRY PRODUCTS A RETAIL PERSPECTIVE. Milk Market Observatory 25 January 2017
 TRENDS IN SALES OF MILK & DAIRY PRODUCTS A RETAIL PERSPECTIVE Milk Market Observatory 25 January 2017 France Period ending 25 December 2016 Product category ) 4 weeks period (P13 15/P13 16) ) Year on year
Developing long-term law enforcement capacity to protect the Mali elephants. Dr Susan Canney Mali Elephant Project
 Developing long-term law enforcement capacity to protect the Mali elephants Dr Susan Canney Mali Elephant Project susan.canney@zoo.ox.ac.uk Timbuktu Range of habitats 100km Timbuktu 100km Timbuktu
WEEKLY MAIZE REPORT 28 NOVEMBER 2018
 WEEKLY MAIZE REPORT 28 NOVEMBER 2018 Unigrain (Pty) Ltd Tel. No. : +27 11 692 4400 Fax. No. : +27 11 412 1183 INTERNATIONAL MARKET Table 1: CME Maize prices and weekly changes (cents/bushel) Currently
Everclear still IS the NGS category with +95% share! Source(s): IRI Data 26 Weeks Ending 4/9/17 Total US MULO +C Nielsen Total US 7/15/17
: IRI Data 26 Weeks Ending 4/9/17 Total US MULO +C Nielsen Total US 7/15/17") Everclear still IS the NGS category with +95% share! Source(s): IRI Data 26 Weeks Ending 4/9/17 Total US MULO +C Nielsen Total US 7/15/17 MAKE IT YOUR OWN With a neutral profile and a unique ability to
Everclear still IS the NGS category with +95% share! Source(s): IRI Data 26 Weeks Ending 4/9/17 Total US MULO +C Nielsen Total US 7/15/17 MAKE IT YOUR OWN With a neutral profile and a unique ability to
Consumption of Dryland Indigenous Fruits to Improve Livelihoods in Kenya. The Case of Mwingi District.
 Consumption of Dryland Indigenous Fruits to Improve Livelihoods in Kenya. The Case of Mwingi District. P. Simitu 1,2, *, R. Jamnadass 1, R. Kindt 1, J. Kungu 2, and J. Kimiywe 2 1 World Agroforestry Centre
Sugar scenario in CIS countries:
 Sugar scenario in CIS countries: on the way to self-sufficiency Andrey Bodin Eurasian Sugar Association Commonwealth of Independent States (CIS) consists of 11 countries CIS Moldova Belarus Population
Measuring household food waste The Spain experience
 Measuring household food waste The Spain experience THE HOUSEHOLD FOOD WASTE PANEL Isabel Hernández Zapata Ministry of Agriculture and Fisheries, Food and Environment (MAPAMA) ihzapata@mapama.es menosdesperdicio@mapama.es
ACSI Restaurant Report 2014
 June 17, 2014 ACSI Restaurant Report 2014 Industry Results for: Full-Service Restaurants Limited-Service Restaurants Customer Satisfaction Rises for Full-Service Restaurants, Strong and Steady for Limited-Service
THE ECONOMIC IMPACT OF BEER TOURISM IN KENT COUNTY, MICHIGAN
 THE ECONOMIC IMPACT OF BEER TOURISM IN KENT COUNTY, MICHIGAN Dan Giedeman, Ph.D., Paul Isely, Ph.D., and Gerry Simons, Ph.D. 10/8/2015 THE ECONOMIC IMPACT OF BEER TOURISM IN KENT COUNTY, MICHIGAN EXECUTIVE
SFR Condo Residential Lot Sales Inventory Sales Inventory Sales Inventory. Month YTD Month Month YTD Month Month YTD Month
 Grand Strand Market Report 2017 Grand Strand market activity took a slight step back in after 3 months of steady growth. SFR sales volume dropped 5.7% for the month but is still up 7.2% year-to-date. The
Part 1: California Ag Exports Main Points From 2008 to 2009 California agricultural exports declined about 5 percent.
 The Importance of California Agricultural Exports: Situation, Outlook and Policy Prospects, with emphasis on the Korea Free Trade Agreement California Fresh Carrot Advisory Board 11 Research hsymposium
Composition and Value of Loin Primals
 Composition and Value of Loin Primals Tom J. Baas, Ph.D. Iowa State University Pork producers today are interested in adding value over and above traditional commodity markets to the hogs they produce
CARBONATED SOFT DRINKS
 International Markets Bureau AMERICAN EATING TRENDS REPORT CARBONATED SOFT DRINKS Unless otherwise stated, all of the information in this report was derived from the NPD Group s National Eating Trends
Brazil. Coffee Annual. Coffee
 THIS REPORT CONTAINS ASSESSMENTS OF COMMODITY AND TRADE ISSUES MADE BY USDA STAFF AND NOT NECESSARILY STATEMENTS OF OFFICIAL U.S. GOVERNMENT POLICY Required Report - public distribution Date: 5/7/2015
New from Packaged Facts!
 New from Packaged Facts! FOODSERVICE MARKET INSIGHTS A fresh perspective on the foodservice marketplace Essential Insights on Consumer customerservice@packagedfacts.com (800) 298-5294 (240) 747-3095 (Intl.)
China s Export of Key Products of Pharmaceutical Raw Materials
 China s Export of Key Products of Pharmaceutical Raw Materials During the period of the 62nd API China& INTERPHEX CHINA, China Pharmaceutical Industry Association released its annual Report on Analysis
segregation and educational opportunity
 segregation and educational opportunity new evidence from population data sean f. reardon stanford university october, 2017 Data (http://seda.stanford.edu) Average district-level standardized test scores
SFR Condo Residential Lot Sales Inventory Sales Inventory Sales Inventory. Month YTD Month Month YTD Month Month YTD Month
 Grand Strand Market Report 2017 SFR sales activity slides in as full year production flat to 2016. Tightening inventory contributing to SFR sales price growth. Condo sales volume and median sales prices
A Profile of the Generation X Wine Consumer in California
 A Profile of the Generation X Wine Consumer in California Marianne McGarry Wolf and Colin M. McVey This research shows that the wine market in California is segmented by age. Wine consumption behavior
Prices for all coffee groups increased in May
 Prices for all coffee groups increased in May In May 2018, the ICO composite indicator increased by 0.7% to an average of 113.34 US cents/lb, following three months of declines. Prices for all coffee groups
Growing divergence between Arabica and Robusta exports
 Growing divergence between Arabica and Robusta exports In April 218, the ICO composite indicator decreased by.4% to an average of 112.56, with the daily price ranging between 11.49 and 114.73. Prices for
WEEKLY MAIZE REPORT 11 JULY 2018
 28 29 21 211 212 213 214 215 216 217 218 WEEKLY MAIZE REPORT 11 JULY 218 Unigrain (Pty) Ltd Tel. No. : +27 11 692 44 Fax. No. : +27 11 412 1183 INTERNATIONAL MARKET Table 1: CME Maize prices and weekly
Perspective of the Labor Market for security guards in Israel in time of terror attacks
 Perspective of the Labor Market for security guards in Israel in time of terror attacks 2000-2004 By Alona Shemesh Central Bureau of Statistics, Israel March 2013, Brussels Number of terror attacks Number
Demographic, Seasonal, and Housing Characteristics Associated with Residential Energy Consumption in Texas, 2010
 Demographic, Seasonal, and Housing Characteristics Associated with Residential Energy Consumption in Texas, 2010 Lila Valencia, Carlos Valenzuela, Jeff Jordan, Steve White, Lloyd Potter Institute for Demographic
Britain s best-selling baking magazines
 Britain s best-selling baking magazines 23,100 41,500 The Power of Print Print advertising is still very important it builds the strongest consumer trust and loyalty, plus it has more tangibility and gravitas
World coffee consumption increases but prices still low
 World coffee consumption increases but prices still low The coffee market stabilised slightly in February, but prices remain at very low levels. A lack of news regarding fundamentals with expectations
THIS REPORT CONTAINS ASSESSMENTS OF COMMODITY AND TRADE ISSUES MADE BY USDA STAFF AND NOT NECESSARILY STATEMENTS OF OFFICIAL U.S.
 THIS REPORT CONTAINS ASSESSMENTS OF COMMODITY AND TRADE ISSUES MADE BY USDA STAFF AND NOT NECESSARILY STATEMENTS OF OFFICIAL U.S. GOVERNMENT POLICY Required Report - public distribution Date: GAIN Report
Vivekanandan, K. and G. D. Bandara. Forest Department, Rajamalwatta Road, Battaramulla, Sri Lanka.
 Vivekanandan, K. and G. D. Bandara. Forest Department, Rajamalwatta Road, Battaramulla, Sri Lanka. LEUCAENA SPECIES RESISTANCE TO PSYLLID (H ETERO PSYLLA CUBANA CRAWFORD) IN SRI LANKA Introduction. Giant
Soybean Yield Loss Due to Hail Damage*
 1 of 6 6/11/2009 9:22 AM G85-762-A Soybean Yield Loss Due to Hail Damage* This NebGuide discusses the methods used by the hail insurance industry to assess yield loss due to hail damage in soybeans. C.
G Soybean Yield Loss Due to Hail Damage
 Extension Historical Materials from University of Nebraska-Lincoln Extension University of Nebraska Lincoln Year 1985 G85-762 Soybean Yield Loss Due to Hail Damage Charles A. Shapiro T.A. Peterson A.D.
Peanut Stocks and Processing
 Stocks and Processing ISSN: 949-875 Released September 27,, by the National Agricultural Statistics Service (NASS), Agricultural Statistics Board, United States Department of Agriculture (USDA). Shelled
MONITORING WALNUT TWIG BEETLE ACTIVITY IN THE SOUTHERN SAN JOAQUIN VALLEY: OCTOBER 2011-OCTOBER 2012
 MONITORING WALNUT TWIG BEETLE ACTIVITY IN THE SOUTHERN SAN JOAQUIN VALLEY: OCTOBER 11-OCTOBER 12 Elizabeth J. Fichtner ABSTRACT Walnut twig beetle, Pityophthorus juglandis, is the vector of thousand cankers
Drinks Ontario Fall Members Meeting 22 November 2013
 Drinks Ontario Fall Members Meeting 22 November 2013 Shari Mogk-Edwards Vice President, Products, Sales and Merchandising Kathy Cannon Director, VINTAGES Dave Misetich Inventory Manager, VINTAGES Kelly
WEEKLY OILSEED REPORT 31 OCTOBER 2018
 WEEKLY OILSEED REPORT 31 OCTOBER 218 Unigrain (Pty) Ltd Tel. No. : +27 11 692 44 Fax. No. : +27 11 412 1183 INTERNATIONAL MARKET Table 1: CME Soybean prices and weekly change (cents/bushel) Currently 24/1/218
CONSUMER PRICE INDEX : April April 2014 Local, imported and all items
 SDT:339 CONSUMER PRICE INDEX : 03 04, imported and all items 4.0.0 08.0 Index 06.0 0.0 98.0 96.0 94.0 Apr Apr Mar 03 Mar Feb Jan Dec Nov Oct Sep Aug Jul Jun Apr 9.0 04 All Items Fig : Graphical representation
2018/19 expected to be the second year of surplus
 2018/19 expected to be the second year of surplus Coffee year 2018/19 is expected to be the second consecutive season of surplus, as global output, estimated at 167.47 million bags, exceeds world consumption,
Peanut Stocks and Processing
 Stocks and Processing ISSN: 949-875 Released November 29,, by the National Agricultural Statistics Service (NASS), Agricultural Statistics Board, United States Department of Agriculture (USDA). Shelled
UNITED STATES SECURITIES AND EXCHANGE COMMISSION Washington, D.C FORM 8-K
 UNITED STATES SECURITIES AND EXCHANGE COMMISSION Washington, D.C. 20549 FORM 8-K CURRENT REPORT Pursuant to Section 13 or 15(d) of the Securities Exchange Act of 1934 Date of Report (Date of earliest event
UPPER MIDWEST DAIRY NEWS
 Federal Milk Market Administrator U.S. Department of Agriculture UPPER MIDWEST DAIRY NEWS H. Paul Kyburz, Market Administrator Volume 3, Issue 10 Upper Midwest Marketing Area, Federal Order No. 30 October
WEEKLY MAIZE REPORT 06 FEBRUARY 2019
 WEEKLY MAIZE REPORT 06 FEBRUARY 2019 Unigrain (Pty) Ltd Tel. No. : +27 11 692 4400 Fax. No. : +27 11 412 1183 INTERNATIONAL MARKET Table 1: CME Maize prices and weekly changes (cents/bushel) Currently
EXECUTIVE SUMMARY. 1. When do Asian clams reproduce in Lake George? 2. How fast do Asian clams grow in Lake George?
 Reproduction and Growth of Asian Clams in Lake George Report to the Lake George Association 3-21-16 Sandra Nierzwicki-Bauer, Jeremy Farrell Darrin Fresh Water Institute EXECUTIVE SUMMARY Asian clams have
WEEKLY OILSEED REPORT 27 JUNE 2018
 WEEKLY OILSEED REPORT 27 JUNE 218 Unigrain (Pty) Ltd Tel. No. : +27 11 692 44 Fax. No. : +27 11 412 1183 INTERNATIONAL MARKET Table 1: CME Soybean prices and weekly change (cents/bushel) Currently 2/6/218
UPPER MIDWEST DAIRY NEWS
 Federal Milk Market Administrator U.S. Department of Agriculture UPPER MIDWEST DAIRY NEWS H. Paul Kyburz, Market Administrator Volume 14, Issue 7 Upper Midwest Marketing Area, Federal Order No. 30 July
Complex: The challenge of. incongruous markets. Jenkins Sugar Group, Inc. USDA Agricultural Outlook Forum February 19,2010
 The North American Sugar Complex: The challenge of managing incongruous markets USDA Agricultural Outlook Forum February 19,2010 Premise: World market has helpedsetthe the stage for the current US price
CONDIMENTS (Olives and Pickles)
") International Markets Bureau AMERICAN EATING TRENDS REPORT Unless otherwise stated, all of the information in this report was derived from the NPD Group s National Eating Trends database, updated to November
International Markets Bureau AMERICAN EATING TRENDS REPORT Unless otherwise stated, all of the information in this report was derived from the NPD Group s National Eating Trends database, updated to November
For personal use only
 SEPTEMBER 216 GLOBAL DAIRY UPDATE European milk production has decreased for the first time since early 215, with volumes in June down 2 compared to last year. Last week we announced our annual results,
Overview of the Manganese Industry
 39th Annual Conference Istanbul, Turkey 2013 Overview of the Manganese Industry International Manganese Institute Alberto Saavedra Market Research Manager June, 2013 Introduction Global Production Supply,
Coffee Supply Chain Development and Tourism in Timor-Leste
 Coffee Supply Chain Development and Tourism in Timor-Leste David Freedman, Asian Development Bank Country Economist, Timor-Leste. 18 July, 2016, Pacific Update Conference, Suva, Fiji. Today s Presentation
Record exports from Brazil weigh heavy on the coffee market
 Record exports from Brazil weigh heavy on the coffee market Coffee exports from Brazil reached a record high of 36.8 million bags in crop year 2014/15 (April to March), fuelled by domestic stocks and encouraged
Cultivation Pattern:
 Introduction: Cumin seed commonly know as Jeera (Cuminum cyminum) belongs to Apiacae family. Though Cumin is a native of Egypt, it now mostly produced in India. India is the largest producer and consumer
Dairy Market. May 2016
 Dairy Market R E P O R T Volume 19 No. 5 May 2016 DMI NMPF Overview Increased production per cow and expectations for additional milk production growth is dampening the outlook for milk prices for the
Soft Commodity Markets - Upcoming Milestones, and How the Market Could Be Affected
 Soft Commodity Markets - Upcoming Milestones, and How the Market Could Be Affected September 15, 2014 Judith Ganes President J. Ganes Consulting, LLC Weather & Politics Current Weather Expectations El