Economic Impact of Ending Sunday Blue Law Pell City, Alabama
|
|
|
- Nathaniel Pierce
- 5 years ago
- Views:
Transcription
1 Economic Impact of Ending Sunday Blue Law Pell City, Alabama Prepared by: Mr. Jeffery G. Hooie Research Analyst Jacksonville State University Jacksonville, Alabama Prepared Through: Center for Economic Development and Business Research Jacksonville State University 700 Pelham Road North Jacksonville, Alabama July 9, 2015
2 Economic Impact: End of Sunday Blue Law Introduction...1 Economic Impact of Blue Laws...2 Chart 1 Deadweight Loss to Society...2 Productive Efficiency...3 Chart 2 Productive Efficiency...3 Pell City Statistics/Potential for Expansion...3 Retail Goals and Services Expenditures...3 Retail Market Place Profile...3 Restaurant Market Potential (MPI)...4 Statistical Analysis...4 Total Impact...4 Tax Revenues...4 Job Benefits...4 Increase in Income in Pell City...4 Table 1 Annual Economic Impact Resulting from Sunday Sale of Alcohol in Pell City...5 Table 2 Alcohol Tax Increase (Sunday Sales)...6 Table 3 Impact of Sunday Alcohol Sales on Retail Expenditures...6 Restaurants and Zoning Criteria...7 Conclusion...7 References Exhibits i
3 Introduction On Monday, May 11, 2015, the Pell City City Council approved a resolution to allow the citizens the right to vote on whether to allow seven-day alcohol sales. In order to attract certain restaurants a city s commercial and retail zoning ordinance is required to include the sales of beer, wine, and liquor seven-days-per week. These chains and franchises also require certain location, trade area, traffic generators, and traffic counts in order to locate in a specific geographic area. The Pell City Market meets these requirements with the exception of Sunday liquor sales. Currently, the city of Pell City does not have this stipulation in their zoning of businesses and restaurants. At present alcohol in any form is only sold sixdays-per week until 2:00 am on Sunday morning. Some chains and franchises that do request seven-day-per-week sales are: Bagger Dave s, Buffalo Wild Wings, The Distillery, and Ker s Wing House Bar & Grill. There are also a number of restaurant s (both chain and franchise) that do not require sevenday-sales, but would be more favorable if a location has this within their zoning ordinance. These establishments include: Mellow Mushroom, Hooters, Olive Garden, Dave and Buster s, O Charley s, Outback Steakhouse, and Joe s Crab Shack. On average, these larger restaurant chains and franchises employ an average of employees per restaurant. Given this information, if Pell City was able to attract at least three of these, there could be an increase of new jobs created in the restaurant industry. When you look at the retail aspect of new development that usually is accompanied by these larger chains for example, Target and Sam s Club, they have an average of between employees per store. If Pell City was able to attract at least two of these, there would be an increase of new jobs created. According to the Bureau of Labor Statistics, both restaurant and retail industries will see a steady increase in employment and jobs within the next ten years. In the restaurant industry there will be an average increase of 11.5 percent. In the non-restaurant category that takes into account bars, nightclubs, and other entertainment related establishments will increase by 20.1 percent. In the retail industry there will be an average increase of 3.85 percent. A market retail analysis of Pell City shows that there is a surplus factor in the Industry Group of Drinking Places that serve alcoholic beverages of -2.5 percent. This translates into slightly higher in-shopping from outside Pell City (see Esri Retail Market Place Profile). On the flip side, there is a leakage in the Industry Group of Beer, Wine, and Liquor stores of percent (adjusted for information supplied by Pell City). This indicates that consumers are going outside the city limits of Pell City to purchase and/or consume the majority of alcoholic beverages. It also shows that the average household in Pell City spends $ per year on alcoholic beverages. 1
4 In the state of Alabama, municipalities are classified by population size. The city of Pell City falls within the Class 6 category. Similar cities to Pell City in size and make up have passed the sale of alcohol on Sunday (i.e., Anniston, Northport, Scottsboro, and Selma). Economic Impact of Blue Laws Regulation of hours or days of operation necessarily results in a reduced choice set for consumers, and thus lowers societal welfare for several reasons. First, there is a positive value placed on the ability to choose from alternative uses of one s time. Second, competition forces producers to operate efficiently. Sellers must pay attention to the needs and wants of consumers. Third, the market place insulated from competition due to regulation invariably results in higher prices and lower output. These higher prices and lower output are deadweight loss to society. P ~ Chart 1 ~ Deadweight Loss to Society S r p r S * p * D 0 Q r Q * Q S * is the unrestricted supply of activities and goods available to consumers on any day of the week. If this supply is restricted by the introduction of Blue Laws the supply curve is shifted back from S * to S r. Price is increased to p r and quantity is reduced from Q * to Q r resulting in a loss of wealth to society. Business revenue is also curtailed. 2
5 Productive Efficiency A business forced to close early or on particular days suffers from excess capacity. Fixed assets such as floor space, inventory, checkout counters and cash are not fully utilized resulting in an economic loss to the owners and increased cost to consumers who may pay higher prices and to workers why may be underemployed. Other costs include inconvenience to consumers due to lost opportunities for shopping. Cost ~ Chart 2 ~ Average Fixed Cost O Output/hours By operating more hours a business may lower its average fixed cost with resulting gains for both business and consumers (example large retailers like Wal-Mart). In a major study, Blue Laws, The History, Economics, and Politics of Sunday-Closing Laws by David N. Laband, the author suggests that the total amount of economic activity one engages in per week is a positive function of the number of legitimate days for selling. If the total of retail sales increases when Sunday sales are permitted, all businesses large and small may benefit from repeal of Sunday Blue Laws. Laband s research shows that businesses experience 10.1 percent greater sales per outlet in non-blue law states. Pell City Statistics/Potential for Expansion Retail Goals and Services Expenditures The Spending Potential Index (SPI) represents the amount spent for a product or service relative to the national average of 100. Pell City s SPI for food away from home is 86, slightly less than average (100). This shows potential for growth. Pell City s SPI for alcoholic beverages is 84, slightly less than the average (100). Sunday sales of alcohol should increase these averages. See Exhibit 1. Retail Market Place Profile Pell City s profile indicates that Pell City is an in-shopping area meaning more shopping money coming in than going out of the city. The profile is a supply (retail sales) and demand (retail 3
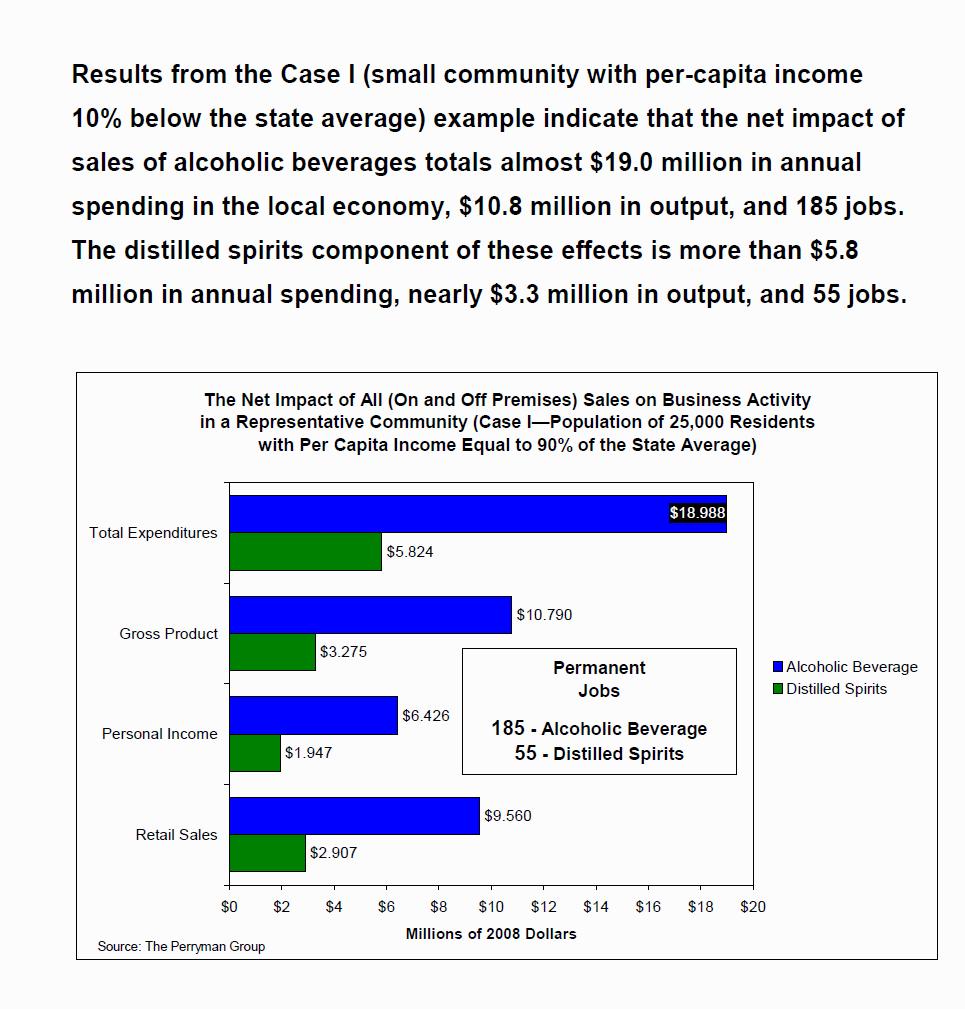
6 potential) analysis. Supply (retail sales) estimates sales to consumers by business establishments. Demand (retail potential) estimates the expected amount spent by consumers at retail establishments. The Leakage/Surplus Factor presents an estimate of retail opportunity. A +100 measures total leakage. All sales leave the locality. A -100 is a measure of total surplus, customers are drawn from outside the trade area (city). The retail gap is the difference between retail potential and retail sales. The Leakage/Surplus Factor (LSF) for the city as a whole is -37.9, indicating inshopping. For drinking places (alcohol) the LSF is a -2.5 indicating slight in-shopping from outside the Pell City area. For Beer, Wine & Liquor stores the LSF is a indicating a very substantial potential for growth in these types of service stores. Full service restaurants have a LSF of -21.6, indicating moderate in-shopping. However, this LSF of is less than for the city as a whole, a LSF of -37.9, indicating potential for growth in full service restaurants. See Exhibit 2. Restaurant Market Potential (MPI) The MPI for Pell City measures the relative likelihood of the adults in the trade area following purchasing patterns compared to the U.S. as a whole. An MPI of 100 is the U.S. average. Pell City has an MPI of 105, which indicates that consumers are more likely to purchase goods or services in this trade area. See Exhibit 3. Statistical Analysis Total Impact The total net expenditure impact from the Sunday sale of alcohol in Pell City is approximately $6.8 million dollars. This total is made up of a direct impact of $2.83 million and multiple spending and re-spending within the local economy, resulting in $6.8 million of impact (see Table 1 & 3). This analysis is consistent with expenditure increases documented in The Perryman Group study for Texas. See Exhibit 4. See Economic Impact of Legalizing Retail Alcohol Sales in Benton County, See Exhibit 7, Center for Business and Economic Research, University of Arkansas. Tax Revenues Retail sales are expected to increase by $2.72 million and alcohol by $110,061 resulting in increased tax collections of $145,129 thousand annually. Beer sales are expected to increase by $66,977 thousand, tax receipts by $6,698 thousand per year; liquor by approximately $42,821 and tax receipts by $2,141 per year (see Table 1). (Exhibit of City of Pell City Retail and Alcohol Sales, see Exhibit 5), National Tax Journal with individual states listed (See Exhibit 6.) Job Benefits Sunday sales of alcohol are expected to generate up to one hundred jobs. The $6.8 million increase in expenditures will create approximately 35 jobs per million of expenditures resulting in 98 new jobs for Pell City economy. See Table 1. Increase in Income in Pell City There are 98 new jobs in Pell City and median worker income is $32,060. Therefore, income in the city should increase by at least $3.1 million. See Table 1. 4
7 ~ Table 1 ~ Annual Economic Impact Resulting from Sunday Sale of Alcohol in Pell City A. DIRECT IMPACT FROM SUNDAY ALCOHOL SALES Dollar value of goods and services purchased in Pell City 1. Direct impact a) retail $2,723,088 (See Table 3) b) alcohol 110,061 $2,833, Estimated Indirect and Induced Expenditure MULTIPLIER Calculate TOTAL IMPACT FROM Sunday Alcohol Sales $6,799,558 B. TAX REVENUE BENEFITS FROM SUNDAY ALCOHOL SALES 1. Enter TOTAL EXPENDITURES from 3A above. $6,799, Retail $2,723,088 x.05 = Beer $66,977 x.10 = Liquor $42,821 x.05 = $136,154 $6,698 $2, Calculate: TAX REVENUES. Add figures in 2B (See Table 2) $145, Enter the number of additional jobs (Sunday Sales) Increase in income. Median worker income for Pell City is $32,060. To determine the increase in income multiply worker income by 98 jobs. $3,141,880 JOB BENEFITS FROM Sunday Sales 1. TOTAL EXPENDITURES from 3A, expressed in millions $ Estimate multiplier for JOBS CREATED PER MILLION DOLLARS OF TOTAL SALES. (Range is 10-50; average = 30) 35 C. 3. JOBS CREATED BY Sunday Sales 98 5
8 ~ Table 2 ~ Alcohol Tax Increase (Sunday Sales) Pell City FY13 Percentage Beer Sales $798,070 61% Liquor Sales $515,305 39% Total Alcohol $1,313, % Alcohol Sales increase due to Sunday Sales. $1,313,375 x.0838 * = $110,061 increase Beer sales $66,977 x.10 = $6,698 Liquor Sales $42,821 x.05 = $2,141 ~ Table 3 ~ Impact of Sunday Alcohol Sales on Retail Expenditures Annual Figures Total Retail Sales Average Weekly Retail Sales 2013 Retail Sales Data $139,246,600 $2,250,486 Average Daily Retail Sales $321,498 Expected direct increase in expenditures for Pell City $2.72 million, adjusted for days of week and Sunday sales volume * National Tax Journal with individual states listed. (Exhibit 6) (Exhibit 7) Pell City City Government. (Exhibit 5) Average Daily Retail Sales x 7 days = $2.25 million. In Pell City, only one day of the week, (Sunday) is subject to change. Thus 2.25 million is the appropriate weekly retail sales for Pell City. However, Sunday has a 21% greater expenditure volume than the weekly average. ** Thus, the $2.25 million must be adjusted by.21 resulting in an increase to $2.72 million. ** Sunday Sales and Georgia, Heartland Institute. Sunday Basket has 21% more than other days of the week. 6
9 Restaurants and Zoning Criteria Today s restaurant climate is more competitive than ever and alcohol sales, in some cases, are a big part of their operating, strategic planning, and sales budgeting. In order to attract certain restaurants, franchises, chains, and even bars a city s commercial and retail zoning ordinance is required to include the sales of beer, wine, and liquor seven-days-per-week. These chains and franchises also require certain location, trade area, traffic generators, and traffic counts in order to locate in a specific geographic area. Pell City meets these requirements with the exception of Sunday liquor sales. At present alcohol, in any form, is only sold six-days-per-week until 2:00 am on Sunday morning. Some establishments that do require seven-day-per-week sales in their search criteria are: Bagger Dave s, Buffalo Wild Wings, The Distillery, and Ker s Wing House Bar & Grill. (Examples of this criteria can be seen in Exhibit 8A & 8B) There are also restaurants that do not require the sales of alcohol on Sunday, but find it more appeasable if the zoning will allow for such sales within the market area they express interest in. Examples of these establishments include: Mellow Mushroom, Hooters, Olive Garden, Dave and Buster s, O Charley s, Outback Steakhouse, and Joe s Crab Shack. Overall, according to these industry specific criteria, the potential to attract these restaurants and bars can be increased by allowing Sunday sales because it helps to put your location on their radar. Conclusion There is no apparent economic rationale for banning the sale of alcohol on any particular day of the week. The rise in sales of alcohol when Sunday bans are eliminated strongly suggests that consumers are inconvenienced by Blue Laws. Sunday alcohol bans do create deadweight losses for society, because of increased prices and reduced output of goods and services. In addition, businesses may have substantial productivity losses due to limitation of hours/days of operation. Businesses cannot lower their average fixed cost to the optimal level. This analysis provides evidence that lifting the ban on Sunday alcohol sales in Pell City will increase retail sales and other expenditures and result in increased tax collections. Also, there will be an increase in employment within the city and a substantial increase in local income. 7
10 References Alabama Alcoholic Beverage Control Board. Annual Report. Montgomery, AL, Alabama Code Section 28-2A-1: Procedure for Wet or Dry Classification Option Elections. (Alcohol). Alabama Code Section 28-3A-25: Unlawful Acts and Offenses Penalties. (Alcohol). Atchison, David. Pell City inches closer to Sunday alcohol vote. The Daily Home. December Atchison, David. Pell City residents to get chance to vote on Sunday alcohol sales. The Daily Home. May Buxton IDentity Customers. Retail Leakage and Surplus Analysis. Retail Market Power (Claritas). December City of Pell City Finance and Revenue Department. Alcohol and Retail Sales Tax Data. Fiscal Years (Audited). City of Pell City Income and Careers. USA.com. June Edgemon, Erin. Bills to allow vote on Sunday alcohol sales in Shelby, St. Clair counties pass Legislature. AL.com. April Laband, David N.; Heinbuch, Deborah Henry. Blue Laws: The History, Economics, and Politics of Sunday-Closing Laws. Lexington Books, D.C. Heath and Company. (1987). Lovenheim, Michael F.; Steefel, Daniel P. Do Blue Laws Save Lives?: The Effect of Sunday Alcohol Sales Bans on Fatal Vehicle Accidents. May Perryman Group, The. The Economic and Fiscal Impact of Alcoholic Beverage Sales in Texas: An Analysis with Emphasis on Various Representative Communities. October 2008:
11 Restaurant Market Potential (Pell City, AL Market). Esri Business Analyst. June Retail Goods and Services Expenditures (Pell City, AL Market). Esri Business Analyst. June Retail MarketPlace Profile (Pell City, AL Market). Esri Business Analyst. June Stehr, Mark. The Effect of Sunday Sales Bans and Excise Taxes on Drinking and Cross-Border Shopping of Alcoholic Beverages. National Tax Journal Vol. LX, No. 1 (March 2007). Thompson, Jeff. Are Sunday alcohol sales right for your city? St. Clair News Aegis. April U.S. Census Bureau. Governments Individual State Descriptions (Alabama). January U.S. Bureau of Labor Statistics. Employment Projections for Restaurant and Retail Industries. (National and Pell City, AL Market). January U.S. Chamber of Commerce Foundation. Enterprising Cities: A Force for American Prosperity. September 2013: Walker, Willard J. Economic Impact of Legalizing Retail Alcohol Sales in Benton County. Center for Business and Economic Research. University of Arkansas Sam M. Walton College of Business. February
12 Retail Goods and Services Expenditures Pell City, AL Pell City, AL ( ) Place Exhibit 1 Top Tapestry Segments Percent Demographic Summary Middleburg (4C) 23.8% Population 12,888 13,268 Front Porches (8E) 19.7% Households 5,263 5,426 Comfortable Empty Nesters (5A) 17.4% Families 3,623 3,708 Green Acres (6A) 14.3% Median Age Down the Road (10D) 9.4% Median Household Income $50,191 $54,946 Spending Potential Average Amount Index Spent Total Apparel and Services 85 $1, $10,370,742 Men's 85 $ $1,933,573 Women's 86 $ $3,635,765 Children's 85 $ $1,672,167 Footwear 85 $ $2,046,766 Watches & Jewelry 85 $ $647,245 Apparel Products and Services (1) 85 $82.70 $435,224 Computer Computers and Hardware for Home Use 84 $ $961,333 Portable Memory 85 $4.59 $24,159 Computer Software 82 $16.58 $87,238 Computer Accessories 86 $16.44 $86,528 Entertainment & Recreation 86 $2, $15,023,552 Fees and Admissions 84 $ $2,861,064 Membership Fees for Clubs (2) 84 $ $760,584 Fees for Participant Sports, excl. Trips 85 $ $540,678 Admission to Movie/Theatre/Opera/Ballet 83 $ $721,992 Admission to Sporting Events, excl. Trips 86 $57.57 $302,983 Fees for Recreational Lessons 82 $ $532,336 Dating Services 78 $0.47 $2,492 TV/Video/Audio 87 $1, $6,011,883 Cable and Satellite Television Services 88 $ $4,153,565 Televisions 87 $ $676,548 Satellite Dishes 87 $1.37 $7,226 VCRs, Video Cameras, and DVD Players 86 $9.43 $49,642 Miscellaneous Video Equipment 88 $9.49 $49,965 Video Cassettes and DVDs 86 $27.61 $145,311 Video Game Hardware/Accessories 86 $19.82 $104,291 Video Game Software 87 $23.96 $126,076 Streaming/Downloaded Video 82 $4.69 $24,662 Rental of Video Cassettes and DVDs 85 $20.07 $105,651 Installation of Televisions 85 $0.95 $5,013 Audio (3) 83 $ $540,511 Rental and Repair of TV/Radio/Sound Equipment 83 $4.45 $23,422 Pets 87 $ $2,619,750 Toys and Games (4) 86 $ $557,631 Recreational Vehicles and Fees (5) 84 $ $959,652 Sports/Recreation/Exercise Equipment (6) 86 $ $861,003 Photo Equipment and Supplies (7) 85 $69.30 $364,727 Reading (8) 86 $ $685,986 Catered Affairs (9) 81 $19.35 $101,857 Food 86 $7, $38,543,600 Food at Home 86 $4, $23,719,974 Bakery and Cereal Products 86 $ $3,313,288 Meats, Poultry, Fish, and Eggs 87 $ $5,234,545 Dairy Products 86 $ $2,546,055 Fruits and Vegetables 85 $ $4,431,807 Snacks and Other Food at Home (10) 87 $1, $8,194,280 Food Away from Home 86 $2, $14,823,626 Alcoholic Beverages 84 $ $2,461,315 Nonalcoholic Beverages at Home 87 $ $2,277,689 Data Note: The Spending Potential Index (SPI) is household-based, and represents the amount spent for a product or service relative to a national average of 100. Detail may not sum to totals due to rounding. Source: Esri forecasts for 2015 and 2020; Consumer Spending data are derived from the 2011 and 2012 Consumer Expenditure Surveys, Bureau of Labor Statistics. June 16, Esri Page 1 of 3
13 Retail MarketPlace Profile Pell City, AL Pell City, AL ( ) Geography: Place Exhibit 2 Summary Demographics 2015 Population 12, Households 5, Median Disposable Income $40, Per Capita Income $26,305 NAICS Demand Supply Retail Gap Leakage/Surplus Number of Industry Summary (Retail Potential) (Retail Sales) Factor Businesses Total Retail Trade and Food & Drink 44-45,722 $140,154,163 $311,109,706 -$170,955, Total Retail Trade $125,869,844 $283,906,937 -$158,037, Total Food & Drink 722 $14,284,319 $27,202,769 -$12,918, NAICS Demand Supply Retail Gap Leakage/Surplus Number of Industry Group (Retail Potential) (Retail Sales) Factor Businesses Motor Vehicle & Parts Dealers 441 $26,803,875 $57,761,505 -$30,957, Automobile Dealers 4411 $23,155,882 $51,128,611 -$27,972, Other Motor Vehicle Dealers 4412 $1,652,517 $3,938,297 -$2,285, Auto Parts, Accessories & Tire Stores 4413 $1,995,476 $2,694,597 -$699, Furniture & Home Furnishings Stores 442 $2,959,624 $1,216,057 $1,743, Furniture Stores 4421 $1,676,793 $733,103 $943, Home Furnishings Stores 4422 $1,282,831 $482,954 $799, Electronics & Appliance Stores 443 $3,547,351 $629,157 $2,918, Bldg Materials, Garden Equip. & Supply Stores 444 $4,373,000 $26,396,159 -$22,023, Bldg Material & Supplies Dealers 4441 $3,610,058 $24,246,135 -$20,636, Lawn & Garden Equip & Supply Stores 4442 $762,942 $2,150,024 -$1,387, Food & Beverage Stores 445 $15,551,015 $64,065,130 -$48,514, Grocery Stores 4451 $14,641,743 $63,921,555 -$49,279, Specialty Food Stores 4452 $243,336 $143,575 $99, Beer, Wine & Liquor Stores 4453 $665,936 $0 $665, Health & Personal Care Stores 446,4461 $10,106,327 $20,432,056 -$10,325, Gasoline Stations 447,4471 $15,049,303 $62,586,553 -$47,537, Clothing & Clothing Accessories Stores 448 $7,521,723 $3,140,939 $4,380, Clothing Stores 4481 $5,494,185 $2,623,440 $2,870, Shoe Stores 4482 $931,942 $0 $931, Jewelry, Luggage & Leather Goods Stores 4483 $1,095,596 $517,499 $578, Sporting Goods, Hobby, Book & Music Stores 451 $2,838,153 $1,406,171 $1,431, Sporting Goods/Hobby/Musical Instr Stores 4511 $2,028,343 $1,236,795 $791, Book, Periodical & Music Stores 4512 $809,810 $169,376 $640, General Merchandise Stores 452 $27,820,385 $41,430,147 -$13,609, Department Stores Excluding Leased Depts $6,949,678 $4,512,626 $2,437, Other General Merchandise Stores 4529 $20,870,707 $36,917,521 -$16,046, Miscellaneous Store Retailers 453 $2,987,836 $3,056,217 -$68, Florists 4531 $177,806 $203,378 -$25, Office Supplies, Stationery & Gift Stores 4532 $1,154,111 $402,581 $751, Used Merchandise Stores 4533 $489,482 $440,238 $49, Other Miscellaneous Store Retailers 4539 $1,166,437 $2,010,020 -$843, Nonstore Retailers 454 $6,311,252 $1,786,846 $4,524, Electronic Shopping & Mail-Order Houses 4541 $5,306,939 $908,979 $4,397, Vending Machine Operators 4542 $172,343 $0 $172, Direct Selling Establishments 4543 $831,970 $877,867 -$45, Food Services & Drinking Places 722 $14,284,319 $27,202,769 -$12,918, Full-Service Restaurants 7221 $5,827,387 $9,034,051 -$3,206, Limited-Service Eating Places 7222 $7,511,273 $17,677,207 -$10,165, Special Food Services 7223 $520,958 $44,695 $476, Drinking Places - Alcoholic Beverages 7224 $424,701 $446,816 -$22, Data Note: Supply (retail sales) estimates sales to consumers by establishments. Sales to businesses are excluded. Demand (retail potential) estimates the expected amount spent by consumers at retail establishments. Supply and demand estimates are in current dollars. The Leakage/Surplus Factor presents a snapshot of retail opportunity. This is a measure of the relationship between supply and demand that ranges from +100 (total leakage) to -100 (total surplus). A positive value represents 'leakage' of retail opportunity outside the trade area. A negative value represents a surplus of retail sales, a market where customers are drawn in from outside the trade area. The Retail Gap represents the difference between Retail Potential and Retail Sales. Esri uses the North American Industry Classification System (NAICS) to classify businesses by their primary type of economic activity. Retail establishments are classified into 27 industry groups in the Retail Trade sector, as well as four industry groups within the Food Services & Drinking Establishments subsector. For more information on the Retail MarketPlace data, please view the methodology statement at whitepapers/pdfs/esri-data-retail-marketplace.pdf. Source: Esri and Dun & Bradstreet. Copyright 2015 Dun & Bradstreet, Inc. All rights reserved. June 16, Esri Page 1 of 2
14 Exhibit 3 Restaurant Market Potential Pell City, AL Pell City, AL ( ) Place Demographic Summary Population 12,888 13,268 Population 18+ 9,952 10,201 Households 5,263 5,426 Median Household Income $50,191 $54,946 Expected Number of Product/Consumer Behavior Adults Percent MPI Went to family restaurant/steak house in last 6 mo 7, % 105 Went to family restaurant/steak house 4+ times/mo 3, % 111 Spent at family rest/steak hse last 6 months: <$ % 118 Spent at family rest/steak hse last 6 months: $ % 104 Spent at family rest/steak hse last 6 months: $ , % 107 Spent at family rest/steak hse last 6 months: $ , % 106 Spent at family rest/steak hse last 6 months: $ % 103 Spent at family rest/steak hse last 6 months: $ % 98 Family restaurant/steak house last 6 months: breakfast 1, % 101 Family restaurant/steak house last 6 months: lunch 2, % 104 Family restaurant/steak house last 6 months: dinner 5, % 109 Family restaurant/steak house last 6 months: snack % 88 Family restaurant/steak house last 6 months: weekday 3, % 111 Family restaurant/steak house last 6 months: weekend 4, % 107 Fam rest/steak hse/6 months: Applebee`s 2, % 112 Fam rest/steak hse/6 months: Bob Evans Farms % 125 Fam rest/steak hse/6 months: Buffalo Wild Wings % 102 Fam rest/steak hse/6 months: California Pizza Kitchen % 54 Fam rest/steak hse/6 months: Carrabba`s Italian Grill % 100 Fam rest/steak hse/6 months: The Cheesecake Factory % 74 Fam rest/steak hse/6 months: Chili`s Grill & Bar 1, % 101 Fam rest/steak hse/6 months: CiCi`s Pizza % 121 Fam rest/steak hse/6 months: Cracker Barrel 1, % 131 Fam rest/steak hse/6 months: Denny`s % 98 Fam rest/steak hse/6 months: Golden Corral 1, % 130 Fam rest/steak hse/6 months: IHOP 1, % 98 Fam rest/steak hse/6 months: Logan`s Roadhouse % 146 Fam rest/steak hse/6 months: LongHorn Steakhouse % 115 Fam rest/steak hse/6 months: Old Country Buffet % 112 Fam rest/steak hse/6 months: Olive Garden 1, % 110 Fam rest/steak hse/6 months: Outback Steakhouse 1, % 110 Fam rest/steak hse/6 months: Red Lobster 1, % 107 Fam rest/steak hse/6 months: Red Robin % 101 Fam rest/steak hse/6 months: Ruby Tuesday % 120 Fam rest/steak hse/6 months: Texas Roadhouse % 132 Fam rest/steak hse/6 months: T.G.I. Friday`s % 96 Fam rest/steak hse/6 months: Waffle House % 137 Went to fast food/drive-in restaurant in last 6 mo 9, % 102 Went to fast food/drive-in restaurant 9+ times/mo 4, % 108 Spent at fast food/drive-in last 6 months: <$ % 94 Spent at fast food/drive-in last 6 months: $11-$ % 105 Spent at fast food/drive-in last 6 months: $21-$40 1, % 101 Spent at fast food/drive-in last 6 months: $41-$ % 103 Spent at fast food/drive-in last 6 months: $51-$100 1, % 109 Spent at fast food/drive-in last 6 months: $101-$200 1, % 115 Spent at fast food/drive-in last 6 months: $201+ 1, % 107 Data Note: An MPI (Market Potential Index) measures the relative likelihood of the adults in the specified trade area to exhibit certain consumer behavior or purchasing patterns compared to the U.S. An MPI of 100 represents the U.S. average. Source: These data are based upon national propensities to use various products and services, applied to local demographic composition. Usage data were collected by GfK MRI in a nationally representative survey of U.S. households. Esri forecasts for 2015 and June 16, Esri Page 1 of 3
15 Exhibit 4
16 Exhibit 5 Pell City, AL ALCOHOL SALES TAX FY 09 FY10 FY11 FY12 FY13 TOTAL BEER $ 81, $ 72, $ 102, $ 97, $ 79, $ 433, WINE & LIQUOR $ 21, $ 29, $ 5, $ 9, $ 25, $ 91, TOTAL $ 103, $ 102, $ 107, $ 106, $ 105, $ 525, TOTAL RETAIL SALES & USE TAX $ 9,646, $ 10,875, $ 13,082, $ 13,819, $ 13,924, Pell City Tax Rates City: (4%) in 2009 thru May % Beer Tax: 10% *Taxed at regular sales tax rate State: 4% Wine & Liquor: 5% *Tax collected on gross sales Couny: 1% Total: 10% **Taxed at 9% in 2009 thru May 2010 Alcohol Type Fiscal Year 2009** 2010** Beer Sales $ 906, $ 806, $ 1,025, $ 973, $ 798, Liquor Sales $ 437, $ 591, $ 106, $ 188, $ 515, Total Sales Beer, Wine & Liquor $ 1,343, $ 1,398, $ 1,132, $ 1,162, $ 1,313, Retail Sales Fiscal Year Total Retail Sales $ 107,183, $ 120,836, $ 130,829, $ 138,199, $ 139,246, Total Sales Beer, Wine & Liquor $ 1,343, $ 1,398, $ 1,132, $ 1,162, $ 1,313, Overall Sales Total $ 108,527, $ 122,234, $ 131,962, $ 139,362, $ 140,559,975.20
17 Exhibit 6
18 Exhibit 7
19
20
21 Exhibit 8A Restaurant/Franchise/Chain Location Criteria
22 Exhibit 8B
23
Restaurant Specialty Report 93101, Santa Barbara, (ZipCode) Site Map , Santa Barbara, (ZipCode) October 10, of 17
 Site Map , Santa Barbara, (ZipCode) October 10, of 17") Restaurant Specialty Report 93101, Santa Barbara, (ZipCode) Site Map 1 of 17 Restaurant Specialty Report 93101, Santa Barbara, (ZipCode) Demographic & Income Profile SUMMARY CENSUS 2010 2017 2022 Population
Restaurant Specialty Report 93101, Santa Barbara, (ZipCode) Site Map 1 of 17 Restaurant Specialty Report 93101, Santa Barbara, (ZipCode) Demographic & Income Profile SUMMARY CENSUS 2010 2017 2022 Population
NEW BUSINESS INFORMATION PACKET. Welcome to the Village of West Dundee! We are so happy that you have chosen to open your doors to this community.
 NEW BUSINESS INFORMATION PACKET Welcome to the Village of West Dundee! We are so happy that you have chosen to open your doors to this community. We want to ensure that the process of opening your business
ECONOMIC IMPACT OF LEGALIZING RETAIL ALCOHOL SALES IN BENTON COUNTY. Produced for: Keep Dollars in Benton County
 ECONOMIC IMPACT OF LEGALIZING RETAIL ALCOHOL SALES IN BENTON COUNTY Produced for: Keep Dollars in Benton County Willard J. Walker Hall 545 Sam M. Walton College of Business 1 University of Arkansas Fayetteville,
2.51 Acres. Colonial Boulevard
 2.51 Acres Colonial Boulevard The Weiner Companies. Inc. 1642 Medical Lanes Suite B Fort Myers, Florida 33907 Voice: (239): 939-7088 Fax: (239): 939-7892 Email: Ken@TheWeinerCompanies.com 2.51 acres on
McDONALD'S AS A MEMBER OF THE COMMUNITY
 McDONALD'S ECONOMIC IMPACT WITH REBUILDING AND REIMAGING ITS RESTAURANTS IN SOUTH LOS ANGELES, CALIFORNIA A Report to McDonald's Corporation Study conducted by Dennis H. Tootelian, Ph.D. November 2010
Table 1 ( Weights). Relative importance of components in the Consumer Price Indexes: U.S. city average, December 2005
. Relative importance of components in the Consumer Price Indexes: U.S. city average, December 2005") Table 1 (2003-2004 Weights). Relative importance of components in the Consumer Price Indexes: U.S. city average, December 2005 (Percent of all items) Item and group U.S. city average CPI-U CPI-W Expenditure
Table 1 (2003-2004 Weights). Relative importance of components in the Consumer Price Indexes: U.S. city average, December 2005 (Percent of all items) Item and group U.S. city average CPI-U CPI-W Expenditure
Sportzfun.com. Source: Joseph Pine and James Gilmore, The Experience Economy, Harvard Business School Press.
 National Extension Tourism Conference Park City, Utah Center for Agribusiness and Economic Development June 15 th, 2009 or Agribusin siness and Econ onomic Deve Center fo velopment What does Agritourism
ECONOMIC IMPACTS OF THE FLORIDA CITRUS INDUSTRY IN
 ECONOMIC IMPACTS OF THE FLORIDA CITRUS INDUSTRY IN 2007- Mohammad Rahmani and Alan W. Hodges Food and Resource Economics Department Institute of Food and Agricultural Sciences FLORIDA CITRUS INDUSTRY HIGHLIGHTS
How Rest Area Commercialization Will Devastate the Economic Contributions of Interstate Businesses. Acknowledgements
 How Rest Area Commercialization Will Devastate the Economic Contributions of Interstate Businesses Acknowledgements The NATSO Foundation, a charitable 501(c)(3) organization, is the research and educational
The 2006 Economic Impact of Nebraska Wineries and Grape Growers
 A Bureau of Business Economic Impact Analysis From the University of Nebraska Lincoln The 2006 Economic Impact of Nebraska Wineries and Grape Growers Dr. Eric Thompson Seth Freudenburg Prepared for The
Economic Contributions of the Florida Citrus Industry in and for Reduced Production
 Economic Contributions of the Florida Citrus Industry in 2014-15 and for Reduced Production Report to the Florida Department of Citrus Alan W. Hodges, Ph.D., Extension Scientist, and Thomas H. Spreen,
For the purposes of this page, this distribution arrangement will be referred to as a wine boutique and wine includes wine coolers.
 Beer and Wine Tax Beer and wine taxes are included in the price you pay for: made by an Ontario manufacturer, microbrewer or brew pub that you buy from: Brewers Retail Inc. (i.e., The Beer Store) licensed
Please see Section IX. for Additional Information:
 The Florida Senate BILL ANALYSIS AND FISCAL IMPACT STATEMENT (This document is based on the provisions contained in the legislation as of the latest date listed below.) BILL: CS/CS/SB 106 Prepared By:
The Economic Impact of Wine and Grapes in Lodi 2009
 The Economic Impact of Wine and Grapes in Lodi 2009 Prepared for the Lodi District Grape Growers Association and the Lodi Winegrape Commission May 2009 A S T O N E B R I D G E R E S E A R C H R E P O R
The Economic Impact of the Craft Brewing Industry in Maine. School of Economics Staff Paper SOE 630- February Andrew Crawley*^ and Sarah Welsh
 The Economic Impact of the Craft Brewing Industry in Maine School of Economics Staff Paper SOE 630- February 2017 Andrew Crawley*^ and Sarah Welsh School of Economics, University of Maine Executive Summary
Table 1. Consumer Price Index for All Urban Consumers (CPI-U): U.S. city average, by expenditure category and commodity and service group
: U.S. city average, by expenditure category and commodity and service group") Table 1. Consumer Price for All Urban Consumers (CPI-U): U.S. city average, by expenditure category and commodity and service group Relative importance, December Unadjusted indexes Unadjusted percent change
Table 1. Consumer Price for All Urban Consumers (CPI-U): U.S. city average, by expenditure category and commodity and service group Relative importance, December Unadjusted indexes Unadjusted percent change
THE ECONOMIC IMPACT OF BEER TOURISM IN KENT COUNTY, MICHIGAN
 THE ECONOMIC IMPACT OF BEER TOURISM IN KENT COUNTY, MICHIGAN Dan Giedeman, Ph.D., Paul Isely, Ph.D., and Gerry Simons, Ph.D. 10/8/2015 THE ECONOMIC IMPACT OF BEER TOURISM IN KENT COUNTY, MICHIGAN EXECUTIVE
HOUSE COMMITTEE ON APPROPRIATIONS FISCAL NOTE. HOUSE BILL NO. 466 PRINTERS NO. 521 PRIME SPONSOR: Turzai
 HOUSE COMMITTEE ON APPROPRIATIONS FISCAL NOTE HOUSE BILL NO. 466 PRINTERS NO. 521 PRIME SPONSOR: Turzai COST / (SAVINGS) FUND FY 2014/15 FY 2015/16 State Stores Fund $0 See fiscal impact State Stores Fund
The Economic Contribution of the Colorado Wine Industry
 The Economic Contribution of the Colorado Wine Industry Doug Caskey, Exec. director CO Wine Industry Development Board Dawn Thilmany, PhD CSU Dept. of Ag and Resource Economics and CSU Extension Contributions
Overview of Presentation
 The Changing Marketplace for California Crops: Focus on Fresh Fruits and Vegetables Dr. Roberta Cook Dept. of Agricultural and Resource Economics UC Davis March 2005 Overview of Presentation US food industry
Technical Memorandum: Economic Impact of the Tutankhamun and the Golden Age of the Pharoahs Exhibition
 Technical Memorandum: Economic Impact of the Tutankhamun and the Golden Age of the Pharoahs Exhibition Prepared for: The Franklin Institute Science Museum Prepared by: Urban Partners November 2007 Economic
Annika Stensson. Director Research Communications National Restaurant Association Washington, D.C. Restaurant.org/Research.
 Annika Stensson Director Research Communications National Restaurant Association Washington, D.C. @WeRRestaurants /RestaurantDotOrg /NationalRestaurantAssociation Restaurant.org/Research 1 Agenda Overview
Perceptions of Privatization
 Perceptions of Privatization Research conducted on behalf of the Commonwealth Foundation and Keystone Politics September 30, 2013 Contact: Jennifer Airey, Partner, Heart+Mind Strategies 201.670.8261 jairey@heartandmindstrategies.com
Businesses Permitted in the C 3 Downtown Business District Excerpt from Sanger Municipal Code Chapter 90 Zoning
 Businesses Permitted in the C 3 Downtown Business District Excerpt from Sanger Municipal Code Chapter 90 Zoning Antique shops. Apartment hotels. Artists' studios. Business colleges. Commercial schools.
Administration Table of Contents
 Table of Contents Administration Table of Contents DAILY TASKS... 1 Manager s Opening Checklist... 1 Mid-Day Management Activities... 3 Manager s Closing Checklist... 3 WEEKLY TASKS... 5 Monday Morning
THE ECONOMIC IMPACT OF WINE AND WINE GRAPES ON THE STATE OF TEXAS 2015
 THE ECONOMIC IMPACT OF WINE AND WINE GRAPES ON THE STATE OF TEXAS 2015 A Frank, Rimerman + Co. LLP Report Updated January 2017 This study was commissioned by the Texas Wine and Grape Growers Association
GENERAL DESCRIPTION OF INDUSTRY AND COMPANY
 Appendix G Appendix Sample G: Import Business Business Plan: Otoro Plan: Import Company Otoro Import Company EXECUTIVE SUMMARY Otoro Imports is a spice importing and marketing corporation established in
Economic Census Overview and Exercises
 Economic Census Overview and Exercises NJ State Data Center Meeting New Brunswick, NJ June 20, 2012 Presented by: Andy Hait Economic Planning & Coordination Division Outline Economic Programs At a Glance
ECONOMIC IMPACT OF WINE AND VINEYARDS IN NAPA COUNTY
 ECONOMIC IMPACT OF WINE AND VINEYARDS IN NAPA COUNTY An Report prepared for Jack L. Davies Napa Valley Agricultural Land Preservation Fund and Napa Valley Vintners JUNE 2005 FULL ECONOMIC IMPACT OF WINE
Table 3A. Consumer Price Index for all Urban Consumers (CPI-U): U.S. city average, detailed expenditure categories
: U.S. city average, detailed expenditure categories") Table 3A. Consumer Price Index for all Urban Consumers (CPI-U): U.S. city, detailed expenditure categories to All items... 215.303 214.537-0.4 All items (1967=100)... 644.951 642.658 - Food and beverages...
Table 3A. Consumer Price Index for all Urban Consumers (CPI-U): U.S. city, detailed expenditure categories to All items... 215.303 214.537-0.4 All items (1967=100)... 644.951 642.658 - Food and beverages...
Results from the First North Carolina Wine Industry Tracker Survey
 Results from the First North Carolina Wine Industry Tracker Survey - 2009 Dr. Michael R. Evans Director and Professor of Hospitality and Tourism Management and Dr. James E. Stoddard Professor of Marketing
FACTORS DETERMINING UNITED STATES IMPORTS OF COFFEE
 12 November 1953 FACTORS DETERMINING UNITED STATES IMPORTS OF COFFEE The present paper is the first in a series which will offer analyses of the factors that account for the imports into the United States
RESTAURANT OUTLOOK SURVEY
 Reference Period: Fourth Quarter 2016 RESTAURANT OUTLOOK SURVEY Prepared by Chris Elliott, Senior Economist January 23, 2017 Q2-2011 Restaurant Outlook Survey Fourth Quarter 2016 1 Highlights The share
THE ECONOMIC IMPACT OF MODEL WINERIES IN TEXAS. Industry Report
 THE ECONOMIC IMPACT OF MODEL WINERIES IN TEXAS Industry Report by Pati Mamardashvili, PhD International School of Economics at Tbilisi State University, Tbilisi, Georgia Tim Dodd, PhD Texas Tech University,
The National Association of Convenience Stores (NACS) defines a convenience store as:
 defines a convenience store as:") The National Association of Convenience Stores (NACS) defines a convenience store as: A retail business with primary emphasis placed on providing the public a convenient location to quickly purchase from
The National Association of Convenience Stores (NACS) defines a convenience store as: A retail business with primary emphasis placed on providing the public a convenient location to quickly purchase from
You now get to create a menu for your restaurant! The menu should include the following items: A restaurant name. A menu with prices for every item
 Activity 6-60: Creating a Menu You now get to create a menu for your restaurant! The menu should include the following items: A restaurant name A menu with prices for every item The menu should contain
EXECUTIVE SUMMARY OVERALL, WE FOUND THAT:
 THE ECONOMIC IMPACT OF CRAFT BREWERIES IN LOS ANGELES LA s craft brewing industry generates short-term economic impacts through large capital investments, equipment purchases, and the construction of new
DELIVERING REFRESHING SOFT DRINKS
 BEVERAGES DIVISION DELIVERING REFRESHING SOFT DRINKS Swire Beverages manufactures, markets and distributes refreshing soft drinks to consumers in Hong Kong, Taiwan, Mainland China and the USA. 46 215 PERFORMANCE
Esri Demographic Data Release Notes: Israel
 Introduction The Esri demographic dataset for Israel provides key population and household attributes for use in a variety of applications. Release notes provide information such as the attribute list,
2016 STATUS SUMMARY VINEYARDS AND WINERIES OF MINNESOTA
 IN PARTNERSHIP WITH THE NORTHERN GRAPES PROJECT, AN USDA SPECIALITY CROPS RESEARCH INITIATIVE PROGRAM, NIFA 2016 STATUS SUMMARY VINEYARDS AND WINERIES OF MINNESOTA Brigid Tuck and William Gartner INTRODUCTION
New York Workers Compensation & Employers Liability Manual Code 8043 Retail Store NOC Clarification Effective Date October 1, 2015
 B U L L E T I N 733 Third Avenue New York, New York 10017 Tel: (212) 697-3535 www.nycirb.org July 2, 2015 Contact: Ms. Annmarie Visciano Manager, Underwriting Services Ext. 161, avisciano@nycirb.org R.C.
Economic and Fiscal Impacts of LiftFund:
 Economic and Fiscal Impacts of LiftFund: 2010-2015 Study Conducted By: Steven R. Nivin, Ph.D., LLC April 2016 1 I. Executive Summary LiftFund is a non-profit small business lender with the mission to provide
More information from: https://www.wiseguyreports.com/reports/ global-online-food-delivery-and-takeaway-marketanalysis-by-order-type
 Report Information More information from: https://www.wiseguyreports.com/reports/1079744-global-online-food-delivery-and-takeaway-marketanalysis-by-order-type Global Online Food Delivery and Takeaway Market
Fiscal and Economic Impacts of Beverage Excise Taxes Imposed by Maine Public Law 629
 MPRA Munich Personal RePEc Archive Fiscal and Economic Impacts of Beverage Excise Taxes Imposed by Maine Public Law 629 Todd Gabe University of Maine October 2008 Online at https://mpra.ub.uni-muenchen.de/66888/
THE ECONOMIC IMPACT OF THE WINE AND GRAPE INDUSTRY IN CANADA 2015
 THE ECONOMIC IMPACT OF THE WINE AND GRAPE INDUSTRY IN CANADA 2015 Canada s Wine Economy Ripe, Robust, Remarkable A Report with special assistance from Rob Eyler, President, Economic Forensics and Analytics
MODERNIZATION OF OKLAHOMA S ALCOHOL LAWS: READY OR NOT HERE IT COMES! Presented by the Oklahoma ABLE Commission
 MODERNIZATION OF OKLAHOMA S ALCOHOL LAWS: READY OR NOT HERE IT COMES! Presented by the Oklahoma ABLE Commission GENERAL OVERVIEW A brief walk through of some of the basic changes coming in October HOW
Re: Winery-Vineyard Economic Impacts
 University of Wisconsin Madison/Extension Office of Steven Deller Department of Agricultural and Applied Economics 515 Taylor Hall 247 Lorch St. Madison, WI 53706 (608) 263-6251 (fax) (608) 262-4376 scdeller@wisc.edu
Food and beverage services statistics - NACE Rev. 2
 Food and beverage services statistics - NACE Rev. 2 Statistics Explained Data extracted in October 2015. Most recent data: Further Eurostat information, Main tables and Database. This article presents
WE DELIVER A Comprehensive Economic Impact Study of the U.S. Foodservice Distribution Industry.
 WE DELIVER A Comprehensive Economic Impact Study of the U.S. Foodservice Distribution Industry Introduction The foodservice distribution industry has a significant impact on communities across America.
CHAPTER I BACKGROUND
 CHAPTER I BACKGROUND 1.1. Problem Definition Indonesia is one of the developing countries that already officially open its economy market into global. This could be seen as a challenge for Indonesian local
$1B+ Restaurant Chain Same Store Sales Data (y/y % Change) 2017 U.S. System Sales $'000 (6) Report Outline
 2017 U.S. System Sales $'000 (6) Report Outline") Concept Applebee's Buffalo Wild Wings Cheesecake Factory Chili's Grill & Bar (2) LongHorn (2) Olive Garden (2) Outback Red Robin Ruby Tuesday (2) T.G.I. Friday's Texas Roadhouse Casual Bob Evans (2) Cracker
Concept Applebee's Buffalo Wild Wings Cheesecake Factory Chili's Grill & Bar (2) LongHorn (2) Olive Garden (2) Outback Red Robin Ruby Tuesday (2) T.G.I. Friday's Texas Roadhouse Casual Bob Evans (2) Cracker
The Impact of Fair Trade: How the Exchange of Goods Links Producers and Consumers. Jessica Stanley-Asselmeier
 The Impact of Fair Trade: How the Exchange of Goods Links Producers and Consumers Jessica Stanley-Asselmeier What is Fair Trade? Trading Partnership Developed After WWII Billion Dollar Industry Anthropological
LIQUOR LICENSE TRANSFER INFORMATION
 LIQUOR LICENSE TRANSFER INFORMATION City of Carbondale City Clerk 200 S. Illinois Avenue Carbondale, Illinois 62901 Phone (618) 457-3281 Fax (618) 457-3282 Explorecarbondale.com LICENSE CLASSIFICATIONS
An update from the Competitiveness and Market Analysis Section, Alberta Agriculture and Forestry.
 An update from the Competitiveness and Market Analysis Section, Alberta Agriculture and Forestry. The articles in this series includes information on what consumers are buying and why they are buying it.
Chicken Usage Summary
 http://www.nationalchickencouncil.org Chicken Usage Summary July 2014 Presentation prepared for: National Chicken Council Prepared by: PKS Research Partners Funding provided by: Background PKS Research
Classification of Liquor Licenses. License Classes
 Village of Lake Zurich 70 E Main Street Lake Zurich, IL 60047 847-438-5141 LakeZurich.org Classification of Liquor Licenses General Provisions 1. The classes of liquor licenses in the village are those
Labor Supply of Married Couples in the Formal and Informal Sectors in Thailand
 Southeast Asian Journal of Economics 2(2), December 2014: 77-102 Labor Supply of Married Couples in the Formal and Informal Sectors in Thailand Chairat Aemkulwat 1 Faculty of Economics, Chulalongkorn University
Demand, Supply and Market Equilibrium. Lecture 4 Shahid Iqbal
 Demand, Supply and Market Equilibrium Lecture 4 Shahid Iqbal Markets & Economics A market is a group of buyers and sellers of a particular good or service. The terms supply and demand refer to the behavior
(A report prepared for Milk SA)
") South African Milk Processors Organisation The voluntary organisation of milk processors for the promotion of the development of the secondary dairy industry to the benefit of the dairy industry, the consumer
South African Milk Processors Organisation The voluntary organisation of milk processors for the promotion of the development of the secondary dairy industry to the benefit of the dairy industry, the consumer
SEMINOLE COUNTY AUDIT OF THE ALTERNATIVE FEE RATE STUDIES SEPTEMBER 2008
 SEMINOLE COUNTY AUDIT OF THE ALTERNATIVE FEE RATE STUDIES SEPTEMBER 2008 Prepared by: Internal Audit Division Clerk of the Circuit Court DISTRIBUTION LIST BOARD OF COUNTY COMMISSIONERS Ms. Brenda Carey
China Coffee Market Overview The Guidance For Selling Coffee In China Published November Pages PDF Format 420
 China Coffee Market Overview 2009 2010 The Guidance For Selling Coffee In China Published November 2009 102 Pages PDF Format 420 Order online at: http://www.drinksector.com/basket.asp?idreport=76&basketaction=auto
SUBCHAPTER 4E - ALCOHOLIC BEVERAGES TAX SECTION LICENSES
 SUBCHAPTER 4E - ALCOHOLIC BEVERAGES TAX SECTION.0100 - LICENSES 17 NCAC 04E.0101 PERMIT REQUIRED TO OBTAIN LICENSE History Note: Authority G.S. 105-113.69; 105-113.102; 17 NCAC 04E.0102 APPLICATION FOR
Economic Losses from Pollution Closure of Clam Harvesting Areas in Machias Bay
 Economic Losses from Pollution Closure of Clam Harvesting Areas in Machias Bay Kevin Athearn, Ph.D. University of Maine at Machias June 8, 2012 Tora Johnson (UMM) and Brian Beal (UMM) assisted with this
Peet's Coffee & Tea, Inc. Reports 62% Increase in Second Quarter 2008 Diluted Earnings Per Share
 Peet's Coffee & Tea, Inc. Reports 62% Increase in Second Quarter 2008 Diluted Earnings Per Share EMERYVILLE, Calif., July 31, 2008 /PRNewswire-FirstCall via COMTEX News Network/ -- Peet's Coffee & Tea,
The Vietnam urban food consumption and expenditure study
 The Centre for Global Food and Resources The Vietnam urban food consumption and expenditure study Factsheet 4: Where do consumers shop? Wet markets still dominate! The food retail landscape in urban Vietnam
CHAPTER 2 BEER, WINE AND LIQUOR
 TITLE 5 CHAPTER 2 BEER, WINE AND LIQUOR SECTIONS: 5-02-01 ADOPTION OF BEER, WINE AND LIQUOR LAWS 5-02-02 LIQUOR BY THE DRINK 5-02-03 WINE 5-02-04 BEER 5-02-05 ELECTION DAY SALES 5-02-06 LIQUOR RELATED
New from Packaged Facts!
 New from Packaged Facts! FOODSERVICE MARKET INSIGHTS A fresh perspective on the foodservice marketplace Essential Insights on Consumer customerservice@packagedfacts.com (800) 298-5294 (240) 747-3095 (Intl.)
Looking Long: Demographic Change, Economic Crisis, and the Prospects for Reducing Poverty. La Conyuntura vs. the Long-run
 Looking Long: Demographic Change, Economic Crisis, and the Prospects for Reducing Poverty Manuel Pastor June 2009 La Conyuntura vs. the Long-run We tend to think about short-term pressures and politics......
HONDURAS. A Quick Scan on Improving the Economic Viability of Coffee Farming A QUICK SCAN ON IMPROVING THE ECONOMIC VIABILITY OF COFFEE FARMING
 HONDURAS A Quick Scan on Improving the Economic Viability of Coffee Farming 1 OBJECTIVES OF STUDY Overall objective Identify opportunities for potential benefits to coffee farmers from improved farm profitability
DISTILLERY REPORT. Prepared for Colorado Distillers Guild
 DISTILLERY REPORT Prepared for Colorado Distillers Guild Consumer Insights and Business Innovation Center (CiBiC) Daniels College of Business, University of Denver Intern Researcher: Federica Bologna Faculty
A Profile of the Generation X Wine Consumer in California
 A Profile of the Generation X Wine Consumer in California Marianne McGarry Wolf and Colin M. McVey This research shows that the wine market in California is segmented by age. Wine consumption behavior
Commercial Crawfish Fishing in the Gulf of Mexico States
 Commercial Crawfish Fishing in the Gulf of Mexico States Crawfish (Procambarus clarkii) are crustaceans and are also known as crayfish, crawdads, and mudbugs 1. Crawfish are native to the Gulf Coast from
Retailing Frozen Foods
 61 Retailing Frozen Foods G. B. Davis Agricultural Experiment Station Oregon State College Corvallis Circular of Information 562 September 1956 iling Frozen Foods in Portland, Oregon G. B. DAVIS, Associate
Agenda. DEFINITION: Restaurant Industry Food Away from Home. FCP Webinar February 24, 2017 STATE OF THE RESTAURANT INDUSTRY
 2016 Restaurant Industry Forecast Annika Stensson Director Research Communications National Restaurant Association Washington, D.C. Food & Culinary Professionals Academy of Nutrition and Dietetics State
Whether to Manufacture
 Whether to Manufacture Butter and Powder or Cheese A Western Regional Research Publication Glen T. Nelson Station Bulletin 546 November 1954 S S De&dim9 S Whether to Manufacture Butterand Powder... or
BILL NUMBER: AB 727 BILL TEXT AMENDED IN ASSEMBLY MARCH 25, 2011 FEBRUARY 17, 2011
 BILL NUMBER: AB 727 BILL TEXT AMENDED AMENDED IN ASSEMBLY MARCH 25, 2011 INTRODUCED BY Assembly Member Mitchell FEBRUARY 17, 2011 An act to add Chapter 6.5 (commencing with Section 12405) to Part 2 of
UPPER MIDWEST MARKETING AREA THE BUTTER MARKET AND BEYOND
 UPPER MIDWEST MARKETING AREA THE BUTTER MARKET 1987-2000 AND BEYOND STAFF PAPER 00-01 Prepared by: Henry H. Schaefer July 2000 Federal Milk Market Administrator s Office 4570 West 77th Street Suite 210
Country Profile: Bakery & Cereals sector in Indonesia
 Country Profile: Bakery & Cereals sector in Indonesia #1157469 $875 156 pages In Stock Report Description Country Profile: Bakery & Cereals sector in Indonesia Summary GlobalDatas Country Profile report
New York Beef Culinary Tour: Industry Trends
 New York Beef Culinary Tour: Industry Trends A l i s o n K r e b s, D i r e c t o r M a r k e t I n t e l l i g e n c e N a t i o n a l C a t t l e m e n s B e e f A s s o c i a t i o n A C o n t r a c
2017 FINANCIAL REVIEW
 2017 FINANCIAL REVIEW In addition to activity, strategy, goals, and challenges, survey respondents also provided financial information from 2014, 2015, and 2016. Select results are provided below: 2016
Model Guidance on Senate Bill 85
 Model Guidance on Senate Bill 85 SUMMARY Governor Nathan Deal signed Senate Bill 85 into law on May 8, 2017. SB 85 allows manufacturers of distilled spirits and malt beverages to sell a limited amount
ORDINANCE NO as. An ordinance amending Chapter 51, Dallas Development Code: Ordinance No.
 103081 12-8-10 ORDINANCE NO. 0 An ordinance amending Chapter 51, Dallas Development Code: Ordinance No. 10962. as amended, and Chapter 51A, Dallas Development Code: Ordinance No. 19455. as amended, of
 1 Introduction The beer industry in the UK provides nearly 900,000 jobs and contributes 23bn annually to the UK economy. The sector also supports the employment of a large number of people in underrepresented
Challenges in Fluid Milk Consumption. October 25, 2017
 Challenges in Fluid Milk Consumption October 25, 2017 Increased Competition At Store 1970 s Milk Soft Drinks Coffee Juice 1980 s Milk Soft Drinks Coffee Juice Bottled water RTD juice Teas 1990 s Milk Soft
Canada-EU Free Trade Agreement (CETA)
") Canada-EU Free Trade Agreement (CETA) The Issue: Following 5-years of negotiation, CETA was signed in principle on October 18, 2013, and signed officially by Prime Minister Trudeau on October 29, 2016,
Canada-EU Free Trade Agreement (CETA) The Issue: Following 5-years of negotiation, CETA was signed in principle on October 18, 2013, and signed officially by Prime Minister Trudeau on October 29, 2016,
CHAPTER Committee Substitute for Committee Substitute for House Bill No. 315
 CHAPTER 98-408 Committee Substitute for Committee Substitute for House Bill No. 315 An act relating to tax on sales, use, and other transactions; amending s. 212.08, F.S.; revising the exemption for food
Guideline to Food Safety Supervisor Requirements
 Guideline to Food Safety Supervisor Requirements The Food Safety Supervisor (FSS) Why is a Food Safety Supervisor important? Food laws in NSW require certain food businesses in the hospitality and retail
EZ Stop N Save Convenience Stores
 EZ Stop N Save Convenience Stores Case Study Sponsored By: Page1 EZ Stop N Save Convenience Stores Case Logistics You will have 12 minutes to present to the coffee buying team of EZ Stop N Save. You should
Virginia. Accommodation and Food Services Profile
 Virginia Accommodation and Food Services Profile May 2015 For additional information or explanation of the contents of this document, you may contact the Economic/Operations Research section at (804) 786-7497
Coca-Cola beverages bring a refreshing taste to consumers.
 Coca-Cola beverages bring a refreshing taste to consumers. BEVERAGES DIVISION DELIVERING REFRESHING SOFT DRINKS Swire Beverages manufactures, markets and distributes refreshing soft drinks to consumers
APPENDIX B NERS PROPERTY CLASSIFICATION CODES. m:\consultants\cb7 ners spencers\memos\appendix b august 24.docx
 APPENDIX B NERS PROPERTY CLASSIFICATION CODES SUBCATEGORY GLOSSARY VACANCY: 1. Yes The site is undeveloped. 2. No The site is developed with a completed structure or a building under construction. USE:
GLOBAL DAIRY UPDATE KEY DATES MARCH 2017
 MARCH 2017 GLOBAL DAIRY UPDATE European milk production decreased for the seventh consecutive month, while the US remains strong. The rate of decline in New Zealand production is easing. US exports continue
Privatization Study Results
 Privatization Study Results Prepared for: Interview Dates: Audience: Commonwealth Foundation September 3 through 12 th, 2013 via telephone n=1,151 Pennsylvania residents 21+ yrs old Note: A * indicates
DATA AND ASSUMPTIONS (TAX CALCULATOR REVISION, MARCH 2017)
") DATA AND ASSUMPTIONS (TAX CALCULATOR REVISION, MARCH 2017) Taxes on sugary drinks can generate considerable revenue for states, cities, and the nation. The revised Revenue Calculator for Sugary Drink Taxes
DATA AND ASSUMPTIONS (TAX CALCULATOR REVISION, MARCH 2017) Taxes on sugary drinks can generate considerable revenue for states, cities, and the nation. The revised Revenue Calculator for Sugary Drink Taxes
Fair Trade C E R T I F I E D
 Fair Trade C E R T I F I E D Every Purchase Matters. Apparel & Home Goods Program What is Fair Trade? Safe Working Conditions Guarantee of safe factory working conditions Advancement of People Direct mechanism
More information at Global and Chinese Pressure Seal Machines Industry, 2018 Market Research Report
 Report Information More information at https://www.htfmarketreport.com/reports/1320915 Global and Chinese Pressure Seal Machines Industry, 2018 Market Research Report Report Code: HTF1320915 Pages: 150
Sales of Prepared Food by Food Service Providers
 Sales of Prepared Food by Food Service Providers TB-71 Issued May 13, 2013 Tax: Sales and Use Tax PREPARED FOOD In general, sales of food and food ingredients purchased for human consumption are exempt
Foodservice EUROPE. 10 countries analyzed: AUSTRIA BELGIUM FRANCE GERMANY ITALY NETHERLANDS PORTUGAL SPAIN SWITZERLAND UK
 Foodservice EUROPE MARKET INSIGHTS & CHALLENGES 2015 2016 2017 2020 Innovative European Foodservice Experts 18, avenue Marcel Anthonioz BP 28 01220 Divonne-les-Bains - France 10 countries analyzed: AUSTRIA
Candy/Snack Innovation Forum. February 21, 2006
 Candy/Snack Innovation Forum February 21, 2006 Welcome To The Candy/Snack Forum Facilitators Debbie Wildrick Product Director- Packaged Goods 7-Eleven, Inc. Bill Dusek Managing Director Dechert-Hampe &
MOBILE VENDING BUSINESS PERMIT APPLICATION Public Land
 MOBILE VENDING BUSINESS PERMIT APPLICATION Public Land Initial applications will be received between April 1 st and April 15 th (Applications received after April 15 th - see regulations for the Wait List