2015 EXPORT HIGHLIGHTS BRITISH COLUMBIA AGRIFOOD & SEAFOOD
|
|
|
- Lucas Richardson
- 5 years ago
- Views:
Transcription


1 2015 EXPORT HIGHLIGHTS BRITISH COLUMBIA AGRIFOOD & SEAFOOD
2 Table of Contents BRITISH COLUMBIA AGRIFOOD & SEAFOOD EXPORT HIGHLIGHTS TOTAL VALUE OF B.C. AGRIFOOD & SEAFOOD EXPORTS ($ BILLIONS)... 3 TOP B.C. AGRIFOOD AND SEAFOOD EXPORTS IN 2015 BY VALUE ($ MILLIONS)... 4 TOP B.C. AGRIFOOD AND SEAFOOD EXPORT MARKETS IN 2015 BY VALUE ($ MILLIONS)... 5 B.C. AGRIFOOD EXPORT HIGHLIGHTS TOTAL VALUE OF B.C. AGRIFOOD EXPORTS ($ BILLIONS)... 7 TOP B.C. AGRIFOOD EXPORTS IN 2015 BY VALUE ($ MILLIONS)... 8 TOP B.C. AGRIFOOD EXPORT MARKETS IN 2015 BY VALUE ($ MILLIONS)... 9 TOP B.C. EXPORTS FRUIT & NUT PRODUCTS TOTAL VALUE OF FRUIT AND NUT PRODUCT EXPORTS ($ MILLIONS) TOP B.C. EXPORTS VEGETABLE PRODUCTS TOTAL VALUE OF VEGETABLE PRODUCT EXPORTS ($ MILLIONS) TOP B.C. EXPORTS ANIMALS & ANIMAL PRODUCTS TOTAL VALUE OF ANIMAL PRODUCT EXPORTS ($ MILLIONS) TOP B.C. EXPORTS BEVERAGES TOTAL VALUE OF BEVERAGE EXPORTS ($ MILLIONS) TOP B.C. EXPORTS OTHER AGRIFOOD PRODUCTS TOTAL VALUE OF OTHER AGRIFOOD PRODUCT EXPORTS ($ MILLIONS) B.C. SEAFOOD EXPORT HIGHLIGHTS TOTAL VALUE OF B.C. SEAFOOD EXPORTS ($ BILLIONS) TOP B.C. SEAFOOD EXPORTS IN 2015 BY VALUE ($ MILLIONS) TOP B.C. SEAFOOD EXPORT MARKETS IN 2015 BY VALUE ($ MILLIONS) TOP B.C. EXPORTS SALMON & TROUT PRODUCTS TOTAL VALUE OF SALMON & TROUT PRODUCT EXPORTS ($ MILLIONS) TOP B.C. EXPORTS GROUNDFISH PRODUCTS TOTAL VALUE OF GROUNDFISH PRODUCT EXPORTS ($ MILLIONS) TOP B.C. EXPORTS INVERTEBRATE & MARINE PLANT PRODUCTS TOTAL VALUE OF INVERTEBRATE & MARINE PRODUCT EXPORTS ($ MILLIONS) TOP B.C. EXPORTS OTHER SEAFOOD SPECIES & PRODUCTS TOTAL VALUE OF OTHER SEAFOOD PRODUCT EXPORTS ($ MILLIONS) NOTES AND DEFINITIONS P a g e 2
3 BRITISH COLUMBIA AGRIFOOD & SEAFOOD EXPORT HIGHLIGHTS 2015 The value of exports of British Columbia agrifood and seafood increased 21 per cent in Of this, agrifood exports rose 23 per cent while seafood exports rose 15 per cent. In 2015, B.C. exported $3.5 billion worth of agrifood and seafood products to 159 markets. Agrifood product shipments contributed 68 per cent and seafood shipments contributed 32 per cent to the total value of provincial agrifood and seafood exports in The top export commodities in 2015 were farmed Atlantic salmon valued at $411 million and food preparations for manufacturing and natural health products valued at $294 million. The United States was B.C. s largest export market with a 72 per cent share in 2015 worth $2.5 billion. Wine exports grew 12 per cent, reaching $9 million in value. China was the top destination for wine shipments. Commodities with the greatest growth from 2014 to 2015 included: o o o Cranberries up 91 per cent to $56 million Farmed Atlantic Salmon up 61 per cent to $411 million Mushrooms up 49 per cent to $131 million Markets showing significant growth from 2014 to 2015 included: o o o South Korea up 62 per cent to $54 million Ukraine up 56 per cent to $16 million China up 32 per cent to $343 million TOTAL VALUE OF B.C. AGRIFOOD & SEAFOOD EXPORTS ($ BILLIONS) P a g e 3
4 TOP B.C. AGRIFOOD & SEAFOOD EXPORTS TOP B.C. AGRIFOOD AND SEAFOOD EXPORTS IN 2015 BY VALUE ($ MILLIONS) RANK PRODUCT DESCRIPTION TOP MARKETS IN Farmed Atlantic Salmon $267.1 $255.0 $ % 61.3% U.S., China, Japan, Taiwan, Hong Kong 2 3 Food Preparations for Manufacturing Baked Goods and Cereal Products $189.6 $234.8 $ % 25.0% U.S., South Korea, China $171.8 $185.2 $ % 24.4% U.S. 4 Blueberries $154.4 $168.7 $ % 29.3% U.S., Japan, China, Chile, Australia 5 Mushrooms $79.4 $88.1 $ % 48.9% U.S., Japan, France, Switzerland, Netherlands 6 Chocolate & Cocoa $80.0 $91.4 $ % 36.1% U.S. 7 Crab $86.8 $102.0 $ % 13.7% China, U.S., Hong Kong, Singapore, Vietnam 8 Alfalfa, Fodder & Animal Feeds $74.5 $84.3 $ % 27.8% U.S. 9 Plants, Bulbs & Flowers $65.5 $81.7 $ % 18.4% U.S. 10 Pork Products $88.4 $83.8 $ % 9.7% Japan, China, Taiwan 11 Cherries $40.5 $53.8 $ % 70.3% U.S., China, Hong Kong, Taiwan U.K. 12 Peppers $57.7 $71.5 $ % 25.4% U.S. 13 Live Cattle & Bison $48.3 $63.5 $ % 10.0% U.S. 14 Coffee & Tea $42.7 $46.7 $ % 43.0% U.S. 15 Tomatoes $64.3 $63.4 $ % 3.1% U.S. 16 Cranberries $41.4 $29.1 $ % 90.5% U.S. 17 Fruit Syrups & Concentrates $35.1 $39.5 $ % 39.3% U.S. 18 Shrimp & Prawns $45.4 $48.6 $ % 2.7% China, Japan, U.S., Vietnam, Taiwan, Hong Kong 19 Water $41.4 $35.4 $ % 41.1% U.S., China 20 Hake $61.4 $40.7 $ % 8.4% Ukraine, China, Nigeria, Lithuania, Benin, U.S. 21 Geoduck Clams $47.6 $47.0 $ % -7.4% China, Vietnam, Macao, Hong Kong 22 Wild Sockeye Salmon $16.8 $90.0 $ % -57.6% U.S., U.K., Australia, Japan, China 23 Halibut $26.1 $32.0 $ % 18.8% U.S. 24 Wheat Flour $23.6 $38.4 $ % -3.3% U.S., Taiwan 25 Dairy Products $34.4 $35.5 $ % -1.4% U.S., Brazil, China All Other Agrifood and Seafood $777.5 $828.8 $ % 7.7% -- TOTAL AGRIFOOD & SEAFOOD $2,661.7 $2,938.9 $3, % 20.6% U.S., China, Japan, Hong Kong, South Korea Source: Statistics Canada, CATSNET Analytics (October 2016) P a g e 4
5 TOP B.C. AGRIFOOD & SEAFOOD EXPORT MARKETS TOP B.C. AGRIFOOD AND SEAFOOD EXPORT MARKETS IN 2015 BY VALUE ($ MILLIONS) RANK MARKET United States $1,823.4 $2,045.7 $2, % 24.1% 2 China $223.2 $259.5 $ % 32.3% 3 Japan $170.2 $187.8 $ % 1.4% 4 Hong Kong $70.3 $62.8 $ % -1.2% 5 South Korea $28.7 $33.5 $ % 62.3% 6 Taiwan $38.9 $42.4 $ % -5.0% 7 Vietnam $15.1 $27.4 $ % 7.3% 8 United Kingdom $16.9 $20.7 $ % 26.3% 9 Australia $19.1 $23.8 $ % 4.5% TOP PRODUCTS IN 2015 Atlantic Salmon, Food Preparations for Manufacturing & Natural Health Products, Baked Goods & Cereal Products, Blueberries, Chocolate & Cocoa Preparations, Mushrooms, Alfalfa, Fodder & Animal Feeds, Plants, Bulbs & Flowers, Peppers, Live Cattle & Bison, Tomatoes, Cranberries, Halibut, Chinook Salmon, Water Crab, Pork Products, Cherries, Geoduck Clams, Shrimp & Prawns, Food Preparations for Manufacturing & Natural Health Products, Hake, Flounder, Atlantic Salmon, Water, Canola Seeds, Wine, Herring, Tuna, Dairy Products Pork Products, Herring, Mushrooms, Blueberries, Sablefish, Sea Urchins, Shrimp & Prawns, Vegetable Oil, Atlantic Salmon, Canola Seeds, Chinook Salmon, Tuna, Sockeye Salmon, Flounder, Wheat & Meslin Cherries, Geoduck Clams, Sea Cucumbers, Food Preparations for Manufacturing & Natural Health Products, Pork Products, Sea Cucumbers, Atlantic Salmon, Sea Urchins, Shrimp & Prawns, Crabs, Poultry Products, Ginseng Products Food Preparations for Manufacturing & Natural Health Products, Coffee, Peptones/Hide Powder/Protein Derivatives, Animal Feed Preparations, Skate, Pork Products, Sea Urchins Pork Products, Food Preparations for Manufacturing & Natural Health Products Cherries, Water, Atlantic Salmon, Shrimp & Prawns, Sea Urchins, Poultry Products Geoduck Clams, Tobacco, Shrimp & Prawns, Apples, Cherries, Food Preparations for Manufacturing & Natural Health Products, Clams, Crabs, Cod, Herring Sockeye Salmon, Cherries, Pink Salmon, Sablefish Margarine, Coffee, Food Preparations for Manufacturing & Natural Health Products, Dogfish, Wheat & Meslin Food Preparations for Manufacturing & Natural Health Products, Sockeye Salmon, Coffee, Blueberries, Pink Salmon, Dairy Products, Baked Goods and Cereal Products, Jams & Fruit Jellies, Alfalfa, Fodder & Animal Feeds 10 Ukraine $26.1 $10.3 $ % 55.8% Hake, Pollock, Sockeye Salmon All Other Export Markets $229.8 $225.0 $ % -3.3% -- WORLD $2,661.7 $2,938.9 $3, % 20.6% Source: Statistics Canada, CATSNET Analytics (October 2016) Atlantic Salmon, Food Preparations for Manufacturing &Natural Health Products, Baked Goods & Cereal Products, Blueberries, Mushrooms, Chocolate & Cocoa Preparations, Crab, Alfalfa, Fodder & Animal Feeds, Plants, Bulbs & Flowers, Pork Products, Cherries, Peppers, Live Cattle & Bison P a g e 5


6 2015 BRITISH COLUMBIA AGRIFOOD EXPORT HIGHLIGHTS P a g e 6
7 B.C. AGRIFOOD EXPORT HIGHLIGHTS 2015 B.C. exported $2.4 billion worth of agrifood products to 149 different markets in 2015, an increase of 23 per cent over Ninety-per cent of the export value was generated by B.C. s top five markets: U.S., China, Japan, South Korea and Hong Kong. Exports of fruit and nut products increased by 35 per cent in 2015, rising from $378 million to $508 million. Exports of vegetable products increased by 26 per cent in 2015, rising from $263 million to $331 million. Exports of animals and animal products decreased by one per cent in 2014, falling from $279 million to $276 million. Exports of beverages increased by 20 per cent in 2015, rising from $81 million to $98 million. Exports of other agrifood products grew by 26 per cent in 2015, rising from $957 million to $1.2 billion. TOTAL VALUE OF B.C. AGRIFOOD EXPORTS ($ BILLIONS) P a g e 7
8 TOP B.C. AGRIFOOD EXPORTS TOP B.C. AGRIFOOD EXPORTS IN 2015 BY VALUE ($ MILLIONS) RANK 1 2 PRODUCT DESCRIPTION Food Preparations for Manufacturing & Natural Health Products Baked Goods & Cereal Products $189.6 $234.8 $ % 25.0% TOP MARKETS IN 2015 U.S., South Korea, China $171.8 $185.2 $ % 24.4% U.S. 3 Blueberries $154.4 $168.7 $ % 29.3% U.S., Japan, China, Chile, Australia 4 Mushrooms $79.4 $88.1 $ % 48.9% 5 6 Chocolate & Cocoa Preparations Alfalfa, Fodder & Animal Feeds U.S., Japan, France, Switzerland, Netherlands $80.0 $91.4 $ % 36.1% U.S. $74.5 $84.3 $ % 27.8% U.S. 7 Plants, Bulbs & Flowers $65.5 $81.7 $ % 18.4% U.S. 8 Pork Products $88.4 $83.8 $ % 9.7% Japan, China, Taiwan 9 Cherries $40.5 $53.8 $ % 70.3% U.S., China, Hong Kong, Taiwan U.K. 10 Peppers $57.7 $71.5 $ % 25.4% U.S. 11 Live Cattle & Bison $48.3 $63.5 $ % 10.0% U.S. 12 Coffee & Tea $42.7 $46.7 $ % 43.0% U.S. 13 Tomatoes $64.3 $63.4 $ % 3.1% U.S. 14 Cranberries $41.4 $29.1 $ % 90.5% U.S. 15 Fruit Syrups & Concentrates $35.1 $39.5 $ % 39.3% U.S. 16 Water $41.4 $35.4 $ % 41.1% U.S., China 17 Wheat Flour $23.6 $38.4 $ % -3.3% U.S., Taiwan 18 Dairy Products $34.4 $35.5 $ % -1.4% U.S., Brazil, China 19 Sugar & Sugar Confectionary $22.3 $22.6 $ % 17.8% U.S. 20 Poultry Products $39.3 $38.9 $ % -35.6% 21 Fruit & Vegetable Juice U.S., Philippines, Congo, Taiwan, Gabon, Benin $10.1 $22.4 $ % 10.8% U.S. 22 Apples $19.0 $19.3 $ % 6.0% U.S., Vietnam 23 Wheat $22.1 $24.1 $ % -18.4% U.S., Indonesia, Japan, Peru, Bangladesh, China 24 Canola Seed $21.1 $25.7 $ % -24.9% China, Japan, Mexico, Pakistan, U.S. 25 Furskins $18.1 $21.3 $ % -7.8% U.S. All Other Agrifood Products $307.8 $313.3 $ % 11.1% -- TOTAL AGRIFOOD PRODUCTS $1,770.7 $1,958.3 $2, % 23.3% Source: Statistics Canada, CATSNET Analytics (October 2016) U.S., China, Japan, South Korea, Hong Kong P a g e 8
9 TOP B.C. AGRIFOOD EXPORT MARKETS TOP B.C. AGRIFOOD EXPORT MARKETS IN 2015 BY VALUE ($ MILLIONS) RANK MARKET United States $1,352.7 $1,504.3 $1, % 22.6% 2 China $65.7 $80.9 $ % 73.8% 3 Japan $69.1 $79.6 $ % 29.7% 4 South Korea $22.9 $29.3 $ % 63.8% 5 Hong Kong $28.0 $31.4 $ % 42.4% 6 Taiwan $29.5 $35.2 $ % -14.0% 7 Australia $14.1 $17.3 $ % 9.0% 8 Philippines $21.4 $15.2 $ % -8.2% 9 Vietnam $10.0 $8.8 $ % 41.3% 10 Netherlands $6.5 $7.3 $ % 67.6% TOP PRODUCTS IN 2015 Food Preparations for Manufacturing & Natural Health Products, Baked Goods & Cereal Products, Blueberries, Chocolate & Cocoa Preparations, Mushrooms, Alfalfa, Fodder & Animal Feeds, Plants, Bulbs & Flowers, Peppers, Live Cattle & Bison, Tomatoes, Cranberries, Water, Wheat & Meslin Flour, Cherries Pork Products, Cherries, Food Preparations for Manufacturing & Natural Health Products, Water, Canola Seed, Wine, Dairy Products, Flax Fibre, Blueberries, Wheat & Meslin Pork Products, Mushrooms, Blueberries, Canola Seeds, Baked Goods & Cereal Products, Vegetable Oils, Water, Wheat, Condiments, Sauces, Seasonings & Soups Food Preparations for Manufacturing & Natural Health Products, Pork Products, Alfalfa, Fodder & Animal Feeds, Coffee, Peptones/Hide Powder/Protein Derivatives, Wheat & Meslin Flour Cherries, Food Preparations for Manufacturing & Natural Health Products, Pork Products, Poultry Products, Dairy Products, Ginseng Products Pork Products, Cherries, Food Preparations for Manufacturing & Natural Health Products, Water, Poultry Products, Wheat & Meslin Flour Food Preparations for Manufacturing & Natural Health Products, Coffee, Dairy Products, Blueberries, Baked Goods & Cereal Products, Alfalfa, Fodder & Animal Feeds, Chocolate & Cocoa Preparations Poultry Products, Food Preparations for Manufacturing & Natural Health Products, Pork Products, Malt Extract, Wheat & Meslin Tobacco, Apples, Cherries, Food Preparations for Manufacturing & Natural Health Products, Flax Fibre, Flours, Meals, & Pellets Food Preparations for Manufacturing & Natural Health Products, Mushrooms, Tea, Mustard Seeds All Other Export Markets $150.8 $149.0 $ % -2.7% -- WORLD $1,770.7 $1,958.3 $2, % 23.3% Source: Statistics Canada, CATSNET Analytics (October 2016) Food Preparations for Manufacturing & Natural Health Products, Baked Goods & Cereal Products, Blueberries, Mushrooms, Chocolate & Cocoa Preparations, Alfalfa, Fodder & Animal Feeds, Plants, Bulbs & Flowers, Pork Products, Cherries P a g e 9
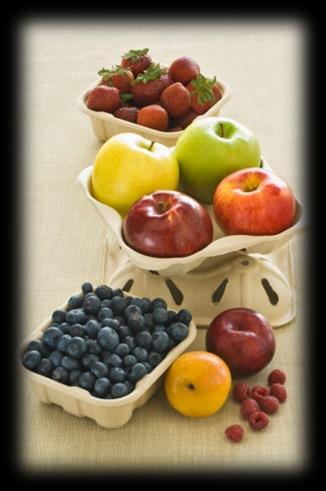
10 TOP B.C. EXPORTS FRUIT & NUT PRODUCTS TOTAL VALUE OF FRUIT AND NUT PRODUCT EXPORTS ($ MILLIONS) PRODUCT DESCRIPTION Blueberries $154,447,667 $168,678,947 $218,049, % 29.3% Cherries $40,549,733 $53,815,468 $91,673, % 70.3% TOP MARKETS IN 2015 U.S., Japan, China, Chile, Australia U.S., China, Hong Kong, Taiwan, U.K. Cranberries $41,442,468 $29,148,301 $55,541, % 90.5% U.S. Apples $19,045,736 $19,340,483 $20,508, % 6.0% U.S., Vietnam Raspberries $12,601,559 $14,526,069 13,464, % -7.3% U.S. Strawberries $1,031,176 $3,054,118 $2,083, % -31.8% U.S. Hazelnuts $652,896 $411,552 $298, % -27.6% U.S. Apricots $5,239 $16,718 $168, % 908.8% Turkey Pears & Quinces $8,441 $12,277 $87, % 612.4% U.S. Pineapples $85,880 $33,426 $72, % 116.4% U.S. Grapes $22,897 $7,714 $4, % -38.5% Malaysia Prunes $10,244 $5,575 $2, % -51.0% China Peaches/Nectarines $100,347 $49,253 $ % -98.9% Singapore Other Fruit & Nut Products $78,591,251 $88,408,298 $106,467, % 20.4% -- TOTAL FRUIT & NUT PRODUCTS $348,595,534 $377,508,199 $508,422, % 34.7% Source: Statistics Canada, CATSNET Analytics (October 2016) U.S., China, Japan, Hong Kong, Taiwan P a g e 10
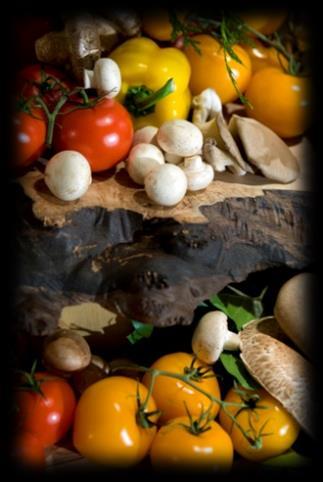
11 TOP B.C. EXPORTS VEGETABLE PRODUCTS TOTAL VALUE OF VEGETABLE PRODUCT EXPORTS ($ MILLIONS) PRODUCT DESCRIPTION Mushrooms $79,391,208 $88,131,659 $131,200, % 48.9% TOP MARKETS IN 2015 U.S., Japan, France, Switzerland, Netherlands Peppers $57,679,543 $71,492,237 $89,637, % 25.4% U.S. Tomatoes $64,323,553 $63,408,536 $65,376, % 3.1% U.S., Japan Cucumbers & Gherkins $13,701,829 $11,988,486 $12,313, % 2.7% U.S. Potatoes $6,774,341 $8,040,458 $10,642, % 32.4% U.S. Peas $25,978,462 $3,340,838 $3,826, % 14.5% U.S., China Chickpeas $354,467 $266,870 $3,545, % % Pakistan, India Lettuce $1,850,942 $1,970,454 $2,762, % 40.2% U.S. Beans $4,326,768 $5,044,421 $1,763, % -65.0% U.S. Eggplant $697,158 $920,985 $1,245, % 35.3% U.S. Vegetable Seeds for Sowing $128,934 $1,070,707 $802, % -25.0% China, India, Taiwan Beetroot/Radishes $445,296 $762,974 $667, % -12.5% U.S. Brussels Sprouts $294,256 $188,274 $655, % 248.4% U.S. Carrots $534,199 $184,351 $475, % 158.2% U.S. Corn $101,305 $380,304 $244, % -35.8% U.S., Australia, Singapore Onions & Shallots $18,421 $22,808 $73, % 221.4% U.S. Spinach -- $81,341 $49, % -39.5% U.S., China Turnips $12,235 $9,212 $47, % 411.3% U.S. Celery $21,445 $12,478 $46, % 275.6% U.S. Asparagus 0 0 $9, % 100% U.S. Other Vegetable Products $4,512,050 $6,111,494 $5,435, % -11.1% -- TOTAL VEGETABLE PRODUCTS $261,146,412 $263,428,887 $330,822, % 25.6% Source: Statistics Canada, CATSNET Analytics (October 2016) U.S., Japan, China, France, Switzerland P a g e 11
12 TOP B.C. EXPORTS ANIMALS & ANIMAL PRODUCTS TOTAL VALUE OF ANIMAL PRODUCT EXPORTS ($ MILLIONS) PRODUCT DESCRIPTION TOP MARKETS IN 2015 Pork Products $88,443,915 $83,798,271 $91,928, % 9.7% Japan, China, Taiwan Live Cattle & Bison $48,275,705 $63,517,985 $69,894, % 10.0% U.S. Dairy Products $34,415,640 $35,481,496 $34,972, % -1.4% U.S., Brazil, China Poultry Products $39,325,064 $38,924,205 $25,072, % -35.6% U.S., Philippines, Congo, Taiwan, Gabon, Benin Furskins $18,050,885 $21,264,165 $19,604, % -7.8% U.S. Live Horses $8,339,637 $9,772,065 $8,124, % -16.9% U.S., Japan Sausages & Similar Products $3,553,492 $4,206,846 3,897, % -7.4% U.S., New Zealand, Hong Kong, Japan Eggs $3,867,425 $3,663,660 $3,704, % 1.1% U.S. Beef Products $2,513,311 $2,651,598 $3,385, % 27.7% U.S., Japan Animal Fats $2,992,392 $3,070,445 $1,145, % -2.5% U.S., Japan Raw Hides & Skins $3,772,480 $3,293,015 $2,090, % -36.5% U.S. Honey $733,048 $1,759,237 1,747, % -0.6% China, Japan, U.S. Live Poultry $788,373 $1,429,799 $652, % -54.4% U.S. Live Swine $61,338 $0 $58, % 100.0% U.S. Other Livestock & Animal Products TOTAL ANIMALS & ANIMAL PRODUCTS Source: Statistics Canada, CATSNET Analytics (October 2016) $7,272,612 $6,275,691 $9,436, % 50.4% -- $262,405,317 $279,108,478 $275,713, % -1.2% U.S., China, Japan, Taiwan, Philippines, Hong Kong P a g e 12
13 TOP B.C. EXPORTS BEVERAGES TOTAL VALUE OF BEVERAGE EXPORTS ($ MILLIONS) PRODUCT DESCRIPTION TOP MARKETS IN 2015 Water $41,377,459 $35,381,571 $49,918, % 41.1% U.S., China Fruit & Vegetable Juice $10,149,181 $22,446,836 $24,870, % 10.8% U.S. Beer & Cider $13,854,500 $14,494,610 $11,718, % -19.1% U.S. Wine $7,602,687 $8,302,653 $9,297, % 12.0% China Other Non-Alcoholic Beverages $966,048 $447,040 $1,868, % 318.0% U.S., Hong Kong Distilled Spirits $1,582,112 $424,009 $208, % -50.9% U.S., China TOTAL BEVERAGES $75,531,987 $81,496,719 $97,882, % 20.1% U.S., China Source: Statistics Canada, CATSNET Analytics (October 2016) P a g e 13
14 TOP B.C. EXPORTS OTHER AGRIFOOD PRODUCTS TOTAL VALUE OF OTHER AGRIFOOD PRODUCT EXPORTS ($ MILLIONS) , PRODUCT DESCRIPTION Food Preparations for Manufacturing & Natural Health Products $189,560,472 $234,814,865 $293,620, % 25.0% TOP MARKETS IN 2015 U.S., South Korea, China Baked Goods & Cereal Products $171,785,210 $185,155,088 $230,372, % 24.4% U.S. Chocolate & Cocoa Preparations $80,026,518 $91,366,251 $124,375, % 36.1% U.S. Alfalfa, Fodder & Animal Feeds $74,515,396 $84,259,171 $107,696, % 27.8% U.S. Plants, Bulbs & Flowers $65,489,021 $81,713,979 $96,721, % 18.4% U.S. Coffee & Tea $42,743,744 $46,677,935 $66,753, % 43.0% U.S. Milled Cereals & Milling Products $47,578,506 $56,580,407 $56,505, % -0.1% U.S. Fruit Syrups & Beverage Concentrates $35,095,207 $39,452,501 $54,962, % 39.3% U.S. Grains & Cereals $35,855,878 $43,990,378 $40,650, % -7.6% U.S., China Sugar & Sugar Confectionary $22,326,333 $22,649,756 $26,684, % 17.8% U.S. Oilseeds $22,588,034 $26,518,683 $21,936, % -17.3% China, Japan, Mexico, U.S. Vegetable Oil & Oilcakes $7,581,093 $9,589,965 $17,155, % 78.9% U.S., Japan, U.K. Industrial By-Products & Residues $13,846,220 $11,544,536 $12,789, % 10.8% U.S. Tobacco $3,528,120 $2,590,646 $4,348, % 67.9% Vietnam, Singapore Condiments, Sauces, Seasonings & Soups $3,846,865 $3,861,784 $4,261, % 10.4% U.S., Japan Seeds for Sowing $1,574,493 $1,721,637 $1,967, % 14.3% U.S. Ice Cream & Edible Ice Products $191,246 $214,577 $141, % -34.2% China, South Korea Spices $24,283 $78,881 $126, % 59.9% U.S., U.A.E., Taiwan Other Agrifood Products $4,900,105 $14,031,506 $39,829, % 183.9% -- TOTAL OTHER AGRIFOOD PRODUCTS $823,056,744 $956,812,546 $1,200,899, % 25.5% Source: Statistics Canada, CATSNET Analytics (October 2016) U.S., China, South Korea, Japan P a g e 14

15 2015 BRITISH COLUMBIA SEAFOOD EXPORT HIGHLIGHTS P a g e 15
16 B.C. SEAFOOD EXPORT HIGHLIGHTS 2015 B.C. exported $1.1 billion worth of seafood products to 79 different markets in 2015, an increase of 15 per cent from Ninety per cent of B.C. s total seafood export value was generated by its top five markets: U.S., China, Japan, Hong Kong and Vietnam. Exports to the U.S. increased by 28 per cent in 2015, from $541 million in 2014 to $695 million in Exports of salmon and trout products reached $578 million in 2015, an increase of 18 per cent from Exports of groundfish products increased by 23 per cent, rising from $126 million in 2014 to $155 million in Invertebrate and marine plant exports rose to $273 million in 2015, an eight per cent increase over the $253 million export value in Exports in the other seafood products and species category increased by nine per cent, rising from $113 million in 2014 to $124 million in TOTAL VALUE OF B.C. SEAFOOD EXPORTS ($ BILLIONS) P a g e 16
17 TOP B.C. SEAFOOD EXPORTS TOP B.C. SEAFOOD EXPORTS IN 2015 BY VALUE ($ MILLIONS) RANK PRODUCT DESCRIPTION TOP MARKETS IN Farmed Atlantic Salmon $267.1 $255.0 $ % 61.3% U.S., China, Japan, Taiwan, Hong Kong 2 Crab $86.8 $102.0 $ % 13.7% China, U.S., Hong Kong, Singapore, Vietnam 3 Shrimp & Prawns $45.4 $48.6 $ % 2.7% 4 Hake $61.4 $40.7 $ % 8.4% China, Japan, U.S., Vietnam, Taiwan, Hong Kong Ukraine, China, Nigeria, Lithuania, Benin, U.S. 5 Geoduck Clams $47.6 $47.0 $ % -7.4% China, Vietnam, Macao, Hong Kong 6 Wild Sockeye Salmon $16.8 $90.0 $ % -57.6% U.S., U.K., Australia, Japan, China 7 Halibut $26.1 $32.0 $ % 18.8% U.S. 8 Herring $33.8 $38.2 $ % -8.2% Japan, China, Fiji, U.S. 9 Tuna $25.6 $25.2 $ % 22.8% U.S., Japan, China, Spain 10 Wild Chinook Salmon $12.6 $21.0 $ % 17.3% U.S., Japan, Italy 11 Sablefish $12.0 $12.2 $ % 66.4% Japan, U.S., U.K., China 12 Sea Urchins $16.4 $15.5 $ % 28.4% Japan, Taiwan, Hong Kong, China 13 Farmed Chinook Salmon $17.5 $18.7 $ % -7.3% U.S., Japan 14 Oysters $12.6 $15.4 $ % 8.8% U.S., Singapore, China 15 Wild Chum Salmon $15.2 $14.7 $ % 13.6% U.S., France, China, Italy 16 Flounder $7.0 $10.3 $ % 40.7% China, Japan, U.S. 17 Wild Pink Salmon $30.0 $28.0 $ % -50.1% Belgium, U.K., Australia, U.S., Netherlands 18 Clams $9.7 $10.8 $ % -1.7% U.S., China, Vietnam, Hong Kong 19 Sea Cucumbers $9.8 $10.0 $ % -16.0% Hong Kong, China, U.S. 20 Wild Coho Salmon $5.8 $4.8 $ % 27.8% U.S., France, Italy, Japan, Germany 21 Cod $2.8 $2.4 $ % 62.3% U.S., Hong Kong, Vietnam, Japan, China 22 Pollock $3.0 $5.8 $ % -34.6% China, South Korea, Nigeria, Ukraine, Benin, U.S. 23 Farmed Coho Salmon $2.2 $1.3 $ % 139.6% U.S. 24 Sole $2.2 $2.0 $ % 7.2% U.S., China 25 Pacific Ocean Perch $1.6 $1.7 $ % -2.8% U.S., China All Other Seafood Products $120.0 $127.3 $ % 9.4% -- TOTAL SEAFOOD PRODUCTS $891.0 $980.6 $1, % 15.2% U.S., China, Japan, Hong Kong, Vietnam Source: Statistics Canada, CATSNET Analytics (April 2016) P a g e 17
18 TOP B.C. SEAFOOD EXPORT MARKETS TOP B.C. SEAFOOD EXPORT MARKETS IN 2015 BY VALUE ($ MILLIONS) RANK MARKET TOP PRODUCTS IN United States $470.7 $541.4 $ % 28.3% 2 China $157.6 $178.6 $ % 13.6% 3 Japan $101.1 $108.2 $ % -19.5% 4 Hong Kong $42.3 $31.4 $ % -44.8% 5 Vietnam $5.1 $18.5 $ % -8.9% 6 United Kingdom $11.6 $12.8 $ % 30.7% Atlantic Salmon, Halibut, Wild Chinook Salmon, Tuna, Oysters, Farmed Chinook Salmon, Wild Sockeye Salmon, Crab, Oysters, Shrimp & Prawns Crab, Geoduck Clams, Hake, Flounder, Atlantic Salmon, Herring Herring, Sablefish, Sea Urchin, Shrimp & Prawns, Atlantic Salmon, Wild Chinook Salmon, Tuna Geoduck Clams, Sea Cucumber, Atlantic Salmon, Sea Urchin, Shrimp & Prawns Geoduck Clams, Shrimp & Prawns, Clams, Crab, Cod, Herring, Sea Cucumber, Sablefish, Wild Chum Salmon Wild Sockeye Salmon, Wild Pink Salmon, Sablefish, Dogfish 7 Ukraine $25.9 $10.3 $ % 56.2% Hake, Pollock, Wild Sockeye Salmon 10 Taiwan $9.4 $7.2 $ % 38.7% Atlantic Salmon, Shrimp & Prawns, Sea Urchins, Crab 9 South Korea $5.8 $4.1 $ % 52.2% Skate, Sea Urchin, Pollock, Herring, Sole 10 Australia $4.9 $6.5 $ % -7.5% Wild Sockeye Salmon, Wild Pink Salmon All Other Export Markets $56.6 $61.6 $ % -9.1% -- WORLD $891.0 $980.6 $1, % 15.2% Atlantic Salmon, Crab, Shrimp & Prawns, Hake, Geoduck Clams, Wild Sockeye Salmon Source: Statistics Canada, CATSNET Analytics (April 2016) P a g e 18
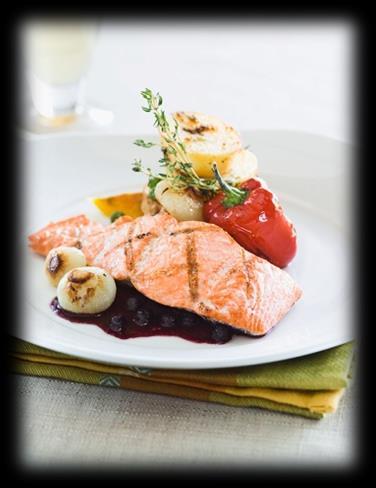
19 TOP B.C. EXPORTS SALMON & TROUT PRODUCTS TOTAL VALUE OF SALMON & TROUT PRODUCT EXPORTS ($ MILLIONS) Total Farmed Salmon Wild Salmon PRODUCT DESCRIPTION Farmed Atlantic $267,105,802 $254,988,871 $411,297, % 61.3% TOP MARKETS IN 2015 U.S., China, Japan, Taiwan, Hong Kong Wild Sockeye $16,775,690 $90,022,775 $38,159, % -57.7% U.S., U.K., Australia, Japan, China Wild Chinook $12,649,031 $21,027,999 $24,656, % 17.3% U.S., Japan, Italy Farmed Chinook $17,483,174 $18,672,272 $17,308, % -7.3% U.S., Japan Wild Chum $15,238,598 $14,676,833 $16,667, % 13.6% U.S., France, China, Italy Wild Pink $29,975,515 $28,038,367 $13,982, % -50.1% Belgium, U.K., Australia, U.S., Netherlands Wild Coho $5,814,506 $4,760,720 $6,083, % 27.8% U.S. Farmed Coho $2,245,603 $1,349,525 $3,232, % 139.6% U.S. Farmed Trout $400,038 $114,796 $587, % 411.5% U.S. Other Salmon & Trout Products $47,365,837 $54,105,575 $45,661, % -15.6% -- Subtotal - Farmed $287,234,617 $275,125,564 $432,426, % 57.2% U.S., China, Japan, Taiwan, Hong Kong Subtotal - Wild $127,819,177 $212,632,269 $145,211, % -31.7% U.S., Japan, U.K. TOTAL SALMON & TROUT PRODUCTS $415,053,794 $487,757,733 $577,637, % 18.4% U.S., Japan, China, U.K. Source: Statistics Canada, CATSNET Analytics (April 2016) P a g e 19
20 TOP B.C. EXPORTS GROUNDFISH PRODUCTS TOTAL VALUE OF GROUNDFISH PRODUCT EXPORTS ($ MILLIONS) PRODUCT DESCRIPTION Hake $61,411,251 $40,698,371 $44,117, % 8.4% TOP MARKETS IN 2015 Ukraine, China, Nigeria, Lithuania, Benin, U.S. Halibut $26,083,632 $32,038,116 $38,055, % 18.8% U.S. Sablefish $11,974,838 $12,180,939 $20,267, % 66.4% Japan, U.S., U.K., China Flounder $7,021,398 $10,287,082 $14,478, % 40.7% China, Japan, U.S. Cod $2,781,119 $2,381,099 $3,863, % 62.3% Pollock $2,960,333 $5,776,841 $3,780, % -34.6% U.S., Hong Kong, Vietnam, Japan, China China, South Korea, Nigeria, Ukraine, Benin, U.S. Sole $2,153,821 $2,042,987 $2,188, % 7.2% U.S., China Pacific Ocean Perch $1,623,130 $1,673,588 $1,626, % -2.8% U.S., China Lingcod $1,009,740 $1,102,481 $1,416, % 28.4% U.S. Skate $893,480 $686,955 $1,407, % 104.9% South Korea Dogfish $556,699 $408,584 $885, % 116.8% U.K., China, Germany Turbot $274,296 $14,363 $63, % 339.3% China Other Groundfish Products $15,977,688 $17,207,925 $22,742, % 32.2% -- TOTAL GROUNDFISH PRODUCTS $134,721,425 $126,499,331 $154,892, % 22.5% U.S., China, Ukraine, Japan Source: Statistics Canada, CATSNET Analytics (April 2016) P a g e 20
21 TOP B.C. EXPORTS INVERTEBRATE & MARINE PLANT PRODUCTS TOTAL VALUE OF INVERTEBRATE & MARINE PLANT PRODUCT EXPORTS ($ MILLIONS) PRODUCT DESCRIPTION Crab $86,835,454 $102,015,992 $115,966, % 13.7% Shrimp & Prawns $45,438,669 $48,649,238 $49,942, % 2.7% TOP MARKETS IN 2015 China, U.S., Hong Kong, Singapore, Vietnam China, Japan, U.S., Vietnam, Taiwan, Hong Kong Geoduck Clams $47,606,563 $47,009,052 $43,519, % -7.4% China, Vietnam, Macao, Hong Kong Sea Urchins $16,412,972 $15,480,016 $19,873, % 28.4% Japan, Taiwan, Hong Kong, China Oysters $12,600,029 $15,376,056 $16,721, % 8.8% U.S., Singapore Clams $9,656,065 $10,791,282 $10,613, % -1.7% U.S., China, Vietnam Sea Cucumbers $9,754,915 $9,982,877 $8,387, % -16.0% Hong Kong, China, U.S. Mussels $94,729 $264,600 $1,493, % 464.3% U.S., Japan Scallops $215,272 $425,232 $1,292, % 204.0% U.S., Hong Kong, Indonesia Marine Plants $427,140 $551,055 $373, % -32.2% France, South Korea Octopus $8,924 $24,366 $8, % -63.2% U.S. Other Invertebrate & Marine Plant Products $1,891,391 $2,318,663 $5,263, % 127.0% -- TOTAL INVERTEBRATE & $230,942,123 $252,888,429 $273,457, % 8.1% MARINE PLANT PRODUCTS Source: Statistics Canada, CATSNET Analytics (April 2016) China, U.S., Japan, Hong Kong, Vietnam, Taiwan, Singapore P a g e 21
22 TOP B.C. EXPORTS OTHER SEAFOOD SPECIES & PRODUCTS TOTAL VALUE OF OTHER SEAFOOD PRODUCT EXPORTS ($ MILLIONS) PRODUCT DESCRIPTION TOP MARKETS IN 2015 Herring $33,776,664 $38,161,765 $35,016, % -8.2% Japan, China, Fiji, U.S. Tuna $25,558,289 $25,223,893 $30,974, % 22.8% U.S., Japan, China, Spain Other Fish Fillets $18,882,326 $17,345,495 $21,327, % 23.0% U.S. Other Fats, Oils & Extracts $7,416,202 $5,010,911 $4,281, % -14.6% South Korea, U.S., Japan Flour, Meal & Pellets for Non-Human Consumption $3,237,067 $2,860,824 $4,216, % 47.4% U.S., South Africa Caviar $2,462,697 $2,512,144 $1,223, % -51.3% Germany, U.S. Eels $892,094 $877,471 $175, % -80.0% South Korea Sardines $728,268 $202,270 $44, % -78.0% Mauritius, Panama Other Seafood Species & Products $17,299,001 $21,271,254 $26,747, % 25.7% -- TOTAL OTHER SEAFOOD SPECIES & PRODUCTS Source: Statistics Canada, CATSNET Analytics (April 2016) $110,252,608 $113,466,027 $124,008, % 9.3% U.S., Japan, China, South Korea P a g e 22
23 NOTES AND DEFINITIONS Agrifood includes agrifood products produced by farmers, growers and ranchers in British Columbia, as well as food, beverage and tobacco products manufactured by B.C. s food, beverage and tobacco processors (regardless of where ingredients were sourced from). Agrifood does not include any fish, shellfish or marine plant products. Seafood includes fish, shellfish and marine plants and their products harvested or cultured in marine and freshwater as well as seafood products manufactured by B.C. s seafood processors. Food Preparations for Manufacturing and Natural Health Products includes pastes, powders and flavourings used by food manufacturers, as well as natural health products. Industrial By-Products & Residues includes bran, waxes, animal or vegetables fats and other byproducts and residues from food and beverage manufacturing. Export data provided in this analysis refers to B.C. Domestic Exports. Domestic exports consist of the exports of all goods grown, produced, extracted or manufactured in the province (British Columbia) and leaving the province (through customs) for a foreign destination. Exports of imported merchandise that has been substantially enhanced in value are also included. Export data provided in the Agrifood analysis has been revised from raw data released by Statistics Canada to account for apparent discrepancies regarding exports of soya beans, rapeseed/canola oil and oilcakes that are believed to come from other Canadian provinces. Excluded soya bean products totaled $6.2 million in 2013, $1.4 million in 2014, and $1.2 million in Excluded rapeseed/canola oil and oilcake products totaled $271.0 million in 2013, $310.0 million in 2014, and $315.0 million in Therefore, the total export values for B.C. Agrifood provided in this analysis have been reduced by $277.2 million in 2013, $311.3 million in 2014 and $316.2 million in The Ministry of Agriculture is working with Statistics Canada to investigate these discrepancies. P a g e 23
24 CONTACT INFORMATION For more information on B.C. agrifood and seafood please contact: AgriService BC Telephone: November 2016 P a g e 24
2012 EXPORT HIGHLIGHTS BRITISH COLUMBIA AGRIFOODS
 2012 EXPORT HIGHLIGHTS BRITISH COLUMBIA AGRIFOODS REVISED FEBRUARY 2014 Table of Contents British Columbia Agrifoods Export Highlights - 2012... 1 Total BC Agrifoods Exports... 1 Top BC Agrifoods Exports
2017 BRITISH COLUMBIA AGRIFOOD AND SEAFOOD INTERNATIONAL EXPORT HIGHLIGHTS
 BRITISH COLUMBIA AGRIFOOD AND SEAFOOD INTERNATIONAL EXPORT HIGHLIGHTS Table of Contents B.C. AGRIFOOD AND SEAFOOD INTERNATIONAL EXPORT HIGHLIGHTS -... 3 B.C. AGRIFOOD AND SEAFOOD INTERNATIONAL EXPORTS...
Agri-Food Exports. Alberta to 2014 Economics and Competitiveness. Highlights on Alberta Agri-Food Exports in Tables:
 Agri-Food Exports Alberta 2005 to 2014 Economics and Competitiveness Highlights on Alberta Agri-Food Exports in 2014 Tables: Alberta Agri-Food Exports, 2005-2014: - Top 5 Export Products and Markets -
Major California Agricultural Exports to the Top Destinations in 1999* (1) Canada Rank Approximate Export Value (millions)
 Canada Rank Approximate Export Value (millions)") (1) Canada Rank Approximate Export Value (millions) Table Grapes 1 119 Tomatoes, Processed 2 115 Lettuce 3 102 Wine 4 84 Strawberries 5 78 Carrots 6 50 Tomatoes, Fresh 7 43 Peaches/Nectarines 8 42 Broccoli
(1) Canada Rank Approximate Export Value (millions) Table Grapes 1 119 Tomatoes, Processed 2 115 Lettuce 3 102 Wine 4 84 Strawberries 5 78 Carrots 6 50 Tomatoes, Fresh 7 43 Peaches/Nectarines 8 42 Broccoli
Alberta Agri-Food Exports, 2008 to 2017 (1)
") Alberta Agri-Food Exports, 2008 to 2017 (1) Table of Content Tables Page 1 Alberta Agri-Food Exports, Top Products and Markets, 2008-2017, Value 1 2 Alberta Agri-Food Exports by Product, 2008-2017, Value
Alberta Agri-Food Exports, 2008 to 2017 (1) Table of Content Tables Page 1 Alberta Agri-Food Exports, Top Products and Markets, 2008-2017, Value 1 2 Alberta Agri-Food Exports by Product, 2008-2017, Value
Monitoring EU Agri-Food Trade: Development until November 2016
 Monitoring EU Agri-Food Trade: Development until November 2016 November 2016 EU agri-food exports again at record level The monthly value of EU agri-food exports in November 2016 reached a new record level
Monitoring EU Agri-Food Trade: Development until August 2018
 Monitoring EU Agri-Food Trade: Development until August 2018 August 2018: Export performance remains stable; imports from US continue to increase The value of EU agri-food trade in the month of August
BRITISH COLUMBIA ANNUAL FISHERIES PRODUCTION SCHEDULE
 Corporate Statistics & Research Unit PO Box 9120 Stn Prov Govt Victoria, BC V8W 9B4 BRITISH COLUMBIA ANNUAL FISHERIES PRODUCTION SCHEDULE REPORT OF FINAL PROCESSED WEIGHTS AND MARKET SELLING VALUES Phone:
Monitoring EU Agri-Food Trade: Development until October 2018
 Monitoring EU Agri-Food Trade: Development until October 2018 October 2018: best EU agri-food export performance ever The monthly value of EU agri-food trade in October 2018 was second biggest ever recorded
Monitoring EU Agri-Food Trade: Development until October 2016
 Monitoring EU Agri-Food Trade: Development until October 2016 October 2016 EU agri-food exports stabilise at high level The monthly value of EU agri-food exports in October 2016 stabilised at EUR 11.4
PHILIPPINES. 1. Market Trends: Import Items Change in % Major Sources in %
 PHILIPPINES A. MARKET OF FRESH FRUITS & VEGETABLES 1. Market Trends: Import Items 2003 2007 Change in % Major Sources in % Value Quantity Value Quantity Value Quantity USD '000 Tons USD '000 Tons Grapes
Monitoring EU Agri-Food Trade: Development until April 2017
 Monitoring EU Agri-Food Trade: Development until April 2017 April 2017: Agri-food exports back to average values The monthly value of EU agri-food exports in April 2017 reached a value of EUR 10.6 billion,
Monitoring EU Agri-Food Trade: Development until December 2016
 Monitoring EU Agri-Food Trade: Development until December 2016 EU agri-food exports at highest annual level ever: EUR 130.7 billion The annual value of EU agri-food exports in 2016 reached a new record
Monitoring EU Agri-Food Trade: Development until August 2017
 Monitoring EU Agri-Food Trade: Development until August 2017 August 2017: Agri-food exports continue strong The monthly value of EU agri-food exports rose slightly to EUR 11.5 billion in August 2017, a
Monitoring EU Agri-Food Trade: Development until March 2018
 Monitoring EU Agri-Food Trade: Development until March 2018 14.000 EU28: Export to Extra-EU of Agri-Food Products 13.000 12.000 11.000 10.000 2018 2017 2015 2016 2014 9.000 8.000 7.000 6.000 Jan Feb Mar
Monitoring EU Agri-Food Trade: Development until March 2017
 Monitoring EU Agri-Food Trade: Development until March 2017 March 2017: record value in monthly agri-food exports at EUR 12.7 billion The monthly value of EU agri-food exports in March 2017 reached a value
Monitoring EU Agri-Food Trade: Development until January 2018
 Monitoring EU Agri-Food Trade: Development until January 2018 January 2018: good start of a year for EU agri-food exports The value of EU agri-food exports in January 2018 kept its very high level, now
Fruit & vegetable preparations 2 558
 United States: Main Exported Agricultural products average 2008-2010 (million US 2 558 $) Bovine meat Oilcakes Pork meat Poultry meat Fruits - fresh or dried (excl. citrus) Tropical - fruits & spices Cotton
Monitoring EU Agri-Food Trade: Development until December 2015
 Monitoring EU Agri-Food Trade: Development until December 2015 December 2015 - EU agri-food exports again higher than in previous years EU agri-food exports in December 2015 achieved a value of EUR 11.2
Monitoring EU Agri-Food Trade: Development until June 2017
 Monitoring EU Agri-Food Trade: Development until June 2017 June 2017: Agri-food exports again above previous years level After a rebound in May, the monthly value of EU agri-food exports went down to EUR
EU28: Main exported Agricultural products (average in million Euro)
") EU28: Main exported Agricultural products (average 2011-2013 - in million Euro) Agricultural products Spirits and liqueurs Wine and vermouth Wheat Pork meat (fresh, chilled or frozen), w/o preparations
EU28: Main exported Agricultural products (average 2011-2013 - in million Euro) Agricultural products Spirits and liqueurs Wine and vermouth Wheat Pork meat (fresh, chilled or frozen), w/o preparations
EU-28: Main imported Agricultural products (average in million Euro)
") EU-28: Main imported Agricultural products (average 2011-2013 - in million Euro) Oilcakes Soyabeans Cocoa Oilseeds, other than soyabeans Raw tobacco Cereals, other than wheat and rice Beet and cane sugar
EU-28: Main imported Agricultural products (average 2011-2013 - in million Euro) Oilcakes Soyabeans Cocoa Oilseeds, other than soyabeans Raw tobacco Cereals, other than wheat and rice Beet and cane sugar
Competitive Trade Analysis Hong Kong
 MARKET ACCESS SECRETARIAT Global Analysis Report Competitive Trade Analysis Hong Kong June 2015 REPORT CONTENT SUMMARY This report looks to highlight the major sectors in Hong Kong, and attempts to identify
Monitoring EU Agri-Food Trade: Development until January 2016
 Monitoring EU Agri-Food Trade: Development until January 2016 January 2015 - EU agri-food exports in line with seasonal trend EU agri-food exports in January 2016 were worth EUR 9.3 billion, thus just
Monitoring EU Agri-Food Trade: Development until September 2018
 Monitoring EU Agri-Food Trade: Development until September 2018 September 2018: Slowdown in EU export performance; imports from Brazil and US still on the rise The monthly value of EU agri-food trade in
Competitive Trade Analysis Mexico
 MARKET ACCESS SECRETARIAT Global Analysis Report Competitive Trade Analysis Mexico September 2015 REPORT CONTENT SUMMARY This report looks to highlight the major sectors in Mexico, and attempts to identify
SINGAPORE. Summary Table: Import of Fresh fruits and Vegetables in Fresh fruit and Vegetables Market Value $000 Qty in Tons
 SINGAPORE A. MARKET FOR FRESH FRUIT AND VEGETABLES 1. Market Trend and Opportunities Summary Table: Import of Fresh fruits and Vegetables in Fresh fruit and Vegetables Market Products/ Other Info. Product
Deliveries to dairies 198/86 GENERAL AGREEMENT ON TARIFFS AND TRADE. Consurption of fresh milk (including exports) 1985/86. Industrial uses 1985/86
 1985/86. Industrial uses 1985/86") GENERAL AGREEMENT ON TARIFFS AND TRADE RESTRICTED DPC/STAT/12/Add. 14 23 September 1986 International Dairy Arrangement INTERNATIONAL DAIRY PRODUCTS Reply to Questionnaire 4 AUSTRALIA COUNCIL (Financial
GENERAL AGREEMENT ON TARIFFS AND TRADE RESTRICTED DPC/STAT/12/Add. 14 23 September 1986 International Dairy Arrangement INTERNATIONAL DAIRY PRODUCTS Reply to Questionnaire 4 AUSTRALIA COUNCIL (Financial
Fresh Deciduous Fruit (Apples, Grapes, & Pears): World Markets and Trade
: World Markets and Trade") Fresh Deciduous Fruit (Apples, Grapes, & Pears): World Markets and Trade June 21 APPLES Record Production but Trade Estimate Revised Downward The world production estimate for 29/1 is virtually unchanged
Fresh Deciduous Fruit (Apples, Grapes, & Pears): World Markets and Trade June 21 APPLES Record Production but Trade Estimate Revised Downward The world production estimate for 29/1 is virtually unchanged
Our Business. Our Values. Transparency : Services : Integrity :
 Our Business The Straits International Pte Ltd, founded in 2010, is a Singapore based supply chain manager specializing in agricultural and protein commodities. We originate and buy physical products from
AMERICAN PECAN COUNCIL. Shipments and Inventory on Hand. For the One Month Ended November 30, 2018
 Shipments and Inventory on Hand Shipments: Total Shelled Meats 15,791,127 Inshell 3,035,663 Total Shipments (Inshell Basis) 34,617,917 Total Pecans in Inventory: Shelled Meats 43,994,659 Inshell 48,911,798
AMERICAN PECAN COUNCIL. Shipments and Inventory on Hand. For the One Month and Five Months Ended January 31, 2019
 Shipments and Inventory on Hand One Month Five Months Shipments: Shelled Meats Retail/Grocery/Export 11,247,569 65,205,488 Inter-handler Transfers Shipped 28,470 3,650,972 Inter-handler Transfers Received
Quarterly AGRI-FOOD TRADE HIGHLIGHTS
 Quarterly AGRI-FOOD TRADE HIGHLIGHTS First Quarter 1998 Agriculture and Agri-Food Canada Agriculture et Agroalimentaire Canada QUARTERLY AGRI-FOOD TRADE HIGHLIGHTS FIRST QUARTER 1998 NO. 98:1 JULY 1998
Fresh Deciduous Fruit (Apples, Grapes, & Pears): World Markets and Trade
: World Markets and Trade") United States Department of Agriculture Foreign Agricultural Service Fresh Deciduous Fruit (Apples, Grapes, & Pears): World Markets and Trade 9 1, MT Deciduous Fruit on Seasonal Cycles 6 Northern Hemisphere
United States Department of Agriculture Foreign Agricultural Service Fresh Deciduous Fruit (Apples, Grapes, & Pears): World Markets and Trade 9 1, MT Deciduous Fruit on Seasonal Cycles 6 Northern Hemisphere
GAIN Report Global Agriculture Information Network
 Foreign Agricultural Service GAIN Report Global Agriculture Information Network Voluntary Report - public distribution Date: 5/26/2000 China, Peoples Republic of GAIN Report #CH0612 Trade data - Multiple
AMERICAN PECAN COUNCIL. Pecan Industry Position Report. For the Crop Year Ended August 31, 2018
 Pecan Industry Position Report INTER-HANDLER TRANSFERS OF PECANS Total Inshell Pounds Transferred: Improved 109,898,013 Native/Seedling 14,813,988 Substandard 16,809,311 Total 141,521,312 YEAR-END INVENTORY
Tuna Trade. Fatima Ferdouse
 Tuna Trade Fatima Ferdouse HIGHLIGHTS East Asia is the world s largest processing and exporting region for canned tuna. Producing countries in the region also depend on imported raw materials The fluctuating
United States Is World Leader in Tree Nut Production and Trade
 Special Article United States Is World Leader in Tree Nut and Trade by Doyle C. Johnson Abstract: Crops of all major U.S. tree nuts will be larger in 997. However, beginning stocks of most tree nuts are
INTERNATIONAL DAIRY PRODUCTS COUNCIL. Reply to Questionnaire 4. Australia (1988/89) I. Milk. A. Production and Utilization of Milk
 I. Milk. A. Production and Utilization of Milk") GENERAL AGREEMENT ON TARIFFS AND TRADE ACCORD GENERAL SUR LES TARIFS DOUANIERS ET LE COMMERCE ACUERDO GENERAL SOBRE ARANCELES ADUANEROS Y COMERCIO RESTRICTED DPC/STAT/12/Add.20 29 September 198 9 International
GENERAL AGREEMENT ON TARIFFS AND TRADE ACCORD GENERAL SUR LES TARIFS DOUANIERS ET LE COMMERCE ACUERDO GENERAL SOBRE ARANCELES ADUANEROS Y COMERCIO RESTRICTED DPC/STAT/12/Add.20 29 September 198 9 International
Fresh Deciduous Fruit (Apples, Grapes, & Pears): World Markets and Trade
: World Markets and Trade") Million MT United States Department of Agriculture Foreign Agricultural Service December 21 Fresh Deciduous Fruit (Apples, Grapes, & Pears): World Markets and Trade 21/11 Forecast: World Apple Trade Declines;
Million MT United States Department of Agriculture Foreign Agricultural Service December 21 Fresh Deciduous Fruit (Apples, Grapes, & Pears): World Markets and Trade 21/11 Forecast: World Apple Trade Declines;
Comparison across international sources of the value of exports for top 25 countries, 1992 (US$ billion )
") Table 1 Comparison across international sources of the value of exports for top 25 countries, 1992 (US$ billion ) FAO WB IFS UN WB b.o.p. United States 448.2 448.0 448.2 444.2 440.4 Germany 429.7 422.0
Table 1 Comparison across international sources of the value of exports for top 25 countries, 1992 (US$ billion ) FAO WB IFS UN WB b.o.p. United States 448.2 448.0 448.2 444.2 440.4 Germany 429.7 422.0
Inside the United States The Fish and Seafood Trade
 MARKET ACCESS SECRETARIAT Global Analysis Report Inside the United States The Fish and Seafood Trade November 2015 TRADE SUMMARY* The United States (U.S.) is the largest importer of fish and seafood in
DESSERT INSPIRATION FACTS AND FIGURES GLOBAL PRODUCT TRENDS VIOGERM WHEAT GERMS OUR PROPOSALS
 DESSERT INSPIRATION DESSERT INSPIRATION FACTS AND FIGURES GLOBAL PRODUCT TRENDS VIOGERM WHEAT GERMS OUR PROPOSALS 2 FACTS & FIGURES Market value for the top 10 countries in 2012 in millions of euros Total:
AGRI-FOOD TRADE STATISTICAL FACTSHEET. European Union - OECD (excl EU incl US Virgin Isl)
") European Commission Directorate-General for Agriculture and Rural Development AGRI-FOOD TRADE STATISTICAL FACTSHEET European Union - OECD (excl EU incl US Virgin Isl) Notes to the reader: The data used
European Commission Directorate-General for Agriculture and Rural Development AGRI-FOOD TRADE STATISTICAL FACTSHEET European Union - OECD (excl EU incl US Virgin Isl) Notes to the reader: The data used
Statistical Overview of the 2015 Canadian Fruit Industry
 Statistical Overview of the Canadian Statistical Fruit Overview Industry of the 2015 Canadian Fruit Industry 2016 Prepared by: Market Analysis and Information Section Horticulture and Cross Sectoral Division
WINE EXPORTS. February Nadine Uren. tel:
 WINE EXPORTS February 2012 Nadine Uren tel: +27 21 807 5707 e-mail: nadine@sawis.co.za OVERVIEW OF WINE EXPORTS HIGHLIGHTS Exports as a percentage of wine production decreased from 48.5% in 2010 to 43.2%
canadian seafood 3 oceans 2,000,000 lakes 1 place Fisheries Council of Canada Conseil Canadien des Pêches
 canadian seafood 3 oceans 2,000,000 lakes 1 place Fisheries Council of Canada Conseil Canadien des Pêches canada Canada is home to the world s largest coastline, bound by the icy Arctic waters in the north,
Bearing Produced by IAR Team Focus Technology Co., Ltd.
 Bearing 2013.06 Produced by IAR Team Focus Technology Co., Ltd. Contents 1. Bearing Industry Exports of 2012... 3 1.1. China Bearing Industry Export Classification Tables of 2012... 3 1.2. China Ball or
3.7.1 World exports and EU external trade in all products, agricultural products ( 1 ) and other products 10/01/2014 EU-27 (Mrd EUR)
 and other products 10/01/2014 EU-27 (Mrd EUR)") 3.7.1 World exports and EU external trade in all products, agricultural products ( 1 ) and other products 10/01/2014 EU-27 (Mrd EUR) 2007 2008 2009 2010 2011 2012 1 2 3 4 5 6 7 World exports ( 2 ) - All
3.7.1 World exports and EU external trade in all products, agricultural products ( 1 ) and other products 10/01/2014 EU-27 (Mrd EUR) 2007 2008 2009 2010 2011 2012 1 2 3 4 5 6 7 World exports ( 2 ) - All
Statistical Overview of the Canadian Vegetable Industry 2012
 Statistical Overview of the Canadian Vegetable Industry 2012 Prepared by : Market Analysis and Information Section Horticulture and Cross Sectoral Division Agriculture and Agri-Food Canada November 2013
Economic Role of Maize in Thailand
 Economic Role of Maize in Thailand Hnin Ei Win Center for Applied Economics Research Thailand INTRODUCTION Maize is an important agricultural product in Thailand which is being used for both food and feed
The Potential Role of Latin America Food Trade in Asia Pacific PECC Agricultural and Food Policy Forum Taipei
 The Potential Role of Latin America Food Trade in Asia Pacific 2011 PECC Agricultural and Food Policy Forum Taipei Universidad EAFIT, Colombia December 2, 2011 1 CONTENTS 1. Introduction 2. Food Trade
ACUERDO GENERAL SOBRE ARANCELES ADUANEROS Y COMERCIO INTERNATIONAL DAIRY PRODUCTS COUNCIL. Reply to Questionnaire 4 AUSTRALIA I.
 GENERAL AGREEMENT ON TARIFFS AND TRADE RESTRICTED ACCORD GENERAL SUR LES TARIFS DOUANIERS ET LE COMMERCE?!!P ST^T/ *^dd * 29 ACUERDO GENERAL SOBRE ARANCELES ADUANEROS Y COMERCIO 2 December 1994 Special
The IWSR Global LOCAL KNOWLEDGE, GLOBAL INTELLIGENCE
 2008 The IWSR Global Wine Handbook LOCAL KNOWLEDGE, GLOBAL INTELLIGENCE 2008 The IWSR Disclaimer: While at all times The IWSR tries to ensure that the information presented in the database and reports
COLD STORAGE HOLDINGS OF FISH
 COLD STORAGE HOLDINGS OF FISH SEPTEMBER, 1957 Memorandum OF OCT 22 1951 \ popt c I L1 Published by Authority of The Honourable Gordon Churchill, Minister of Trade and Commerce DOMINION BUREAU OF STATISTICS
AGRI-FOOD TRADE STATISTICAL FACTSHEET. European Union - ASEAN (Association Of South-East Asian Nations)
") European Commission Directorate-General for Agriculture and Rural Development AGRI-FOOD TRADE STATISTICAL FACTSHEET European Union - ASEAN (Association Of South-East Asian Nations) Notes to the reader:
European Commission Directorate-General for Agriculture and Rural Development AGRI-FOOD TRADE STATISTICAL FACTSHEET European Union - ASEAN (Association Of South-East Asian Nations) Notes to the reader:
Global Trade in Mangoes
 Global Trade in Mangoes October 2014 Jim Lang Managing Director TradeData International Pty Ltd jim.lang@tradedata.net www.tradedata.net COUNTRIES WITH MONTH IMPORT STATISTICS 1. The global market is just
2013Q2 Daily Chemical Produced by IAR Team Focus Technology Co., Ltd.
 2013Q2 Daily Chemical 2013.10 Produced by IAR Team Focus Technology Co., Ltd. Contents 1. China Daily Chemical Industry Export Trend Analysis... 3 1.1. China Soap Export Trend Analysis from Jan. to June
US-MEXICO AGRICULTURAL PARTNERSHIP. March 2017
 US-MEXICO AGRICULTURAL PARTNERSHIP March 2017 Before 1994 Lack of clarity about trade and investment rules Lack of skills needed to compete in the global marketplace Limited competition Focus mainly on
Statistical Overview of the 2015 Canadian Fruit Industry
 Statistical Overview of the Canadian Statistical Fruit Overview Industry of the 2015 Canadian Fruit Industry 2017 Prepared by: Market Analysis and Information Section Horticulture and Cross Sectoral Division
World Yoghurt Market Report
 World Yoghurt Market Report 2000-2020 Price: 1,800 /$2,200 The report contains 330 pages of valuable information Analysis of the current market situation and future possibilities in all regions of the
Inside the Portuguese Seafood Trade
 International Markets Bureau MARKET INDICATOR REPORT APRIL 2012 Inside the Portuguese Seafood Trade Source: Shutterstock. Inside the Portuguese Seafood Trade TRADE SUMMARY Portugal is not currently an
Industry Advisory Panel Item 4c Trade of Stainless Steel Scrap
 Industry Advisory Panel Item 4c Trade of Stainless Steel Scrap Lisbon Tuesday 22 April 2008 Sven Tollin Chief Statistician 1 Stainless Steel Waste & Scrap Comparison calendar with Except Kazakhstan only
Outline. Long-term Outlook for Cotton Consumption. World End-Use Consumption of Textile Fibers. World Consumption of Textile Fibers
 World Cotton Supply and Use International Cotton Advisory Committee Secretariat Outline! Long-term Outlook for Consumption! Outlook for /! Developments in World Cotton Trade Fifth Open Session: Cotton
Shellfish Trends in China
 MARKET ACCESS SECRETARIAT Global Analysis Report Sector Trend Analysis Shellfish Trends in China February 2018 Executive summary China is Canada's second-largest agri-food and seafood trading partner in
MARKETING WINE: DEVELOPING NEW MARKETS IN ASIA
 MARKETING WINE: DEVELOPING NEW MARKETS IN ASIA MARKETING WINE: DEVELOPING NEW MARKETS IN ASIA GEOGRAPHY OF MARKETS IN ASIA INDIA CHINA HONG KONG MACAO THAILAND VIETNAM SINGAPORE MALAYSIA SOUTH KOREA TAIWAN
P E C A N R E P O R T
 P E C A N R E P O R T Agricultural Marketing Service 16 Forest Parkway Specialty Crops Programs Building 1-218 Market News Division Forest Park, Georgia 30297 Phone (404) 361-1376 FAX (404) 363-2523 Pecan
Statistical Overview of the Canadian Greenhouse Vegetable Industry 2015
 Statistical Overview of the Canadian Greenhouse Vegetable Industry 2015 Prepared by: Market Analysis and Information Section Horticulture and Cross Sectoral Division Agriculture and Agri-Food Canada June
AGRI-FOOD TRADE STATISTICAL FACTSHEET. European Union - BRICS
 European Commission Directorate-General for Agriculture and Rural Development AGRI-FOOD TRADE STATISTICAL FACTSHEET European Union - BRICS Notes to the reader: The data used in this factsheet were provided
PERMITTED Products of Animal origin for Internment by Tourists
 PERMITTED Products of origin for Internment by Tourists Use Merchandise Requirements and Specifications Countries with MCRZI combination of requirements Butter Cream Yoghurt Liquid pasteurized or UHT,
Statistical Overview of the Canadian Fruit Industry 2013
 Statistical Overview of the Canadian Fruit Industry 2013 Prepared by: Market Analysis and Information Section Horticulture and Cross Sectoral Division Agriculture and Agri-Food Canada November 2014 Her
AMAZONIA (BRAZIL) NUTS MACADAMIAS HAZELNUTS PISTACHIOS WALNUTS PINE NUTS PECANS
 NUTS MACADAMIAS HAZELNUTS PISTACHIOS WALNUTS PINE NUTS PECANS") HAZELNUTS MACADAMIAS PECANS PINE NUTS INTRODUCTION WORLD PRODUCTION PRODUCTION AND CONSUMPTION TRENDS SUPPLY VALUE ALMONDS AMAZONIA (BRAZIL) NUTS CASHEWS PISTACHIOS WALNUTS PEANUTS DATES 05 06 09 13 14
HAZELNUTS MACADAMIAS PECANS PINE NUTS INTRODUCTION WORLD PRODUCTION PRODUCTION AND CONSUMPTION TRENDS SUPPLY VALUE ALMONDS AMAZONIA (BRAZIL) NUTS CASHEWS PISTACHIOS WALNUTS PEANUTS DATES 05 06 09 13 14
Food Additive Produced by IAR Team Focus Technology Co., Ltd
 Food Additive 2012.03 Produced by IAR Team Focus Technology Co., Ltd Contents 1. 2009-2011 Chinese Citric Acid Export Data Analysis... 3 2009-2011 Major Importers of Chinese Citric Acid...4 2. 2009-2011
Vegetable Imports Approaching 20% of Total
 Vegetable Imports Approaching 20% of Total Domestic Supply The taste of imported vegetables has become more familiar to the palates of Japanese consumers in recent years. According to the Ministry of Finance,
LAMPIRAN A. Senarai Produk Import Sumber Perikanan di Brunei
 LAMPIRAN A Senarai Produk Import Sumber Perikanan di Brunei 1605110 Abalone Canned 0303260 Abalone Fresh Chilled Frozen Salted Dried or Boiled 1605210 Abalone Not Canned 0372210 Abalone Prepared or Preserved
North America Grains Outlook
 banchero costa North America Grains Outlook (covering wheat and coarse grains) September 2018 bancosta blue studies volume DRY 2018/#12 banchero costa research www.bancosta.com ; research@bancosta.com
Competitive Trade Analysis Italy
 MARKET ACCESS SECRETARIAT Global Analysis Report Competitive Trade Analysis Italy July 2015 REPORT CONTENT SUMMARY This report looks to highlight the major sectors in Italy, and attempts to identify the
International Table Grape Symposium November 2014 Australian Table Grapes Jeff Scott Chief Executive Officer
 International Table Grape Symposium November 2014 Australian Table Grapes Jeff Scott Chief Executive Officer Australian Table Grape Industry - Snapshot There are approximately 900 table grape growers throughout
Citrus: World Markets and Trade
 Department of Agriculture eign Agricultural Service January Citrus: World Markets and Trade Citrus: / ecast Global Orange Production and Trade Expand Global production and trade for is forecast at. million
FCC Ag Economics. Trade Ranking Report: Agriculture
 FCC Ag Economics Trade Ranking Report: Agriculture Published November 7, 2017 1 Introduction There s good reason to be optimistic about the future of Canada s agri-food. Demand for agricultural commodities
MARCOS S. JANK. JAPAN BRAZIL Bilateral Dynamics and Partnership in the Agri-Food Sector
 MARCOS S. JANK JAPAN BRAZIL Bilateral Dynamics and Partnership in the Agri-Food Sector JAPAN-BRAZIL BUSINESS COUNCIL Tokyo, Japan 24 th July 2018 Japan and Brazil Competitive Advantages in the Agri-Food
ANALYSIS ON THE STRUCTURE OF HONEY PRODUCTION AND TRADE IN THE WORLD
 ANALYSIS ON THE STRUCTURE OF HONEY PRODUCTION AND TRADE IN THE WORLD GU G., ZHANG Ch., HU F.* Department of Sericulture and Apiculture, College of Animal Science Zhejiang University, Hangzhou 310029, CHINA
JAPAN
 https://www.youtube.com/watch?v=_4br5tp4jpu JAPAN Imports 2016 2017 % Change Salmon Chinook (Frozen H&G) 40 $ 162 128 $ 599 222% 271% Chum (Frozen H&G) 1,722 $ 3,916 2,878 $ 10,627 67% 171% Coho (Frozen
DEVELOPMENTS IN STEEL SCRAP IN 2009
 DEVELOPMENTS IN STEEL SCRAP IN 2009 AMERICAN SCRAP COALITION WASHINGTON, DC DEVELOPMENTS IN STEEL SCRAP 2009 The year 2009 demonstrated that the United States continues to experience a crisis with respect
Blow Molding Machine Produced by IAR Team Focus Technology Co., Ltd
 Blow Molding Machine 2012.08 Produced by IAR Team Focus Technology Co., Ltd Contents 1. 2009-2011 Chinese Blow Molding Machines Export Trend Analysis...3 2009-2011 Chinese Blow Molding Machines Export
Soybean Oil and Palm Oil Account For An Increasing Share of World Vegetable Oil Consumption
 United States Department of Agriculture Foreign Agricultural Service Circular Series FOP 01-03 January 2003 Soybean Oil and Palm Oil Account For An Increasing Share of World Vegetable Oil Consumption Percent
KUWAIT. Similarly there is a decreasing trend for other fresh fruits products like grapes and lychee. India shared 37.6% of import market in Kuwait.
 KUWAIT A. MARKET FOR FRESH FRUITS AND FRESH VEGETABLES 1. Market Trend and Opportunities: Fresh Fruits The market for fresh fruits in Kuwait has a downward trend. Bananas import volume decreased by 34%
Inside the United Kingdom Seafood Trade
 International Markets Bureau MARKET INDICATOR REPORT MARCH 2011 Inside the United Kingdom Seafood Trade The United Kingdom Seafood Trade TRADE SUMMARY The United Kingdom (U.K.) has been a relatively small
YUM! Brands Inc. Restaurant Units Activity Summary December 31, 2011 Total
 Total Unconsolidated Excluding Company Affiliates Franchisees Licensees (a) Total Worldwide Beginning of Year 7,271 525 27,852 35,648 New Builds 749 73 1,058 1,880 Acquisitions 137 - (137) - Refranchising
World of sugar PAGE 54
 World of sugar More than 1 countries produce sugar, about 8% of which is made from sugar cane grown primarily in the tropical and sub-tropical zones of the southern hemisphere, and the balance from sugar
GENERAL AGREEMENT ON TARIFFS AND TRADE ACCORD GENERAL SUR LES TARIFS DOUANIERS ET LE COMMERCE ACUERDO GENERAL SOBRE ARANCELES ADUANEROS Y COMERCIO
 GENERAL AGREEMENT ON TARIFFS AND TRADE ACCORD GENERAL SUR LES TARIFS DOUANIERS ET LE COMMERCE ACUERDO GENERAL SOBRE ARANCELES ADUANEROS Y COMERCIO RESTRICTED DPC/STAT/12/Add.l2 26 September 1985 International
Table grape. Horticulture trade intelligence. Quarter 1: January to March 2017
 Horticulture trade intelligence A custom report compiled for Hort Innovation by Euromonitor International Table grape Quarter 1: January to March 217 Horticulture trade intelligence: Table grape: 217:
EMBARGO TO ON FRIDAY 16 SEPTEMBER. Scotch Whisky Association. Exports of Scotch Whisky; Year to end of June 2016 (2016 H1)
") EMBARGO TO 00.01 ON FRIDAY 16 SEPTEMBER Scotch Whisky Association Exports of Scotch Whisky; Year to end of June 2016 (2016 H1) VOLUME UP 3.1% to 531 MILLION bottles VALUE DOWN SLIGHTLY BY 1.0% TO 1.70
EMBARGO TO 00.01 ON FRIDAY 16 SEPTEMBER Scotch Whisky Association Exports of Scotch Whisky; Year to end of June 2016 (2016 H1) VOLUME UP 3.1% to 531 MILLION bottles VALUE DOWN SLIGHTLY BY 1.0% TO 1.70
YUM! Brands Inc. Restaurant Units Activity Summary June 16, 2012 Total
 Unconsolidated Company Affiliates Franchisees Licensees (a) Worldwide Beginning of Year 7,437 587 26,928 34,952 New Builds 352 28 359 739 Acquisitions 200-275 475 Refranchising (200) - 200 - Closures (56)
AGRI-FOOD TRADE STATISTICAL FACTSHEET. European Union - Sub-Saharan Africa
 European Commission Directorate-General for Agriculture and Rural Development AGRI-FOOD TRADE STATISTICAL FACTSHEET European Union - Sub-Saharan Africa Notes to the reader: The data used in this factsheet
AGRI-FOOD TRADE STATISTICAL FACTSHEET. European Union - Australia And New Zealand
 European Commission Directorate-General for Agriculture and Rural Development AGRI-FOOD TRADE STATISTICAL FACTSHEET European Union - Australia And New Zealand Notes to the reader: The data used in this
What s new in B.C. WILD SEAFOOD. British Columbia leads all of. Albacore tuna, geoduck, Dungeness crab, and Pacific sardines.
 What s new in B.C. Winter 2012 spotlight on: WILD SEAFOOD Albacore tuna, geoduck, Dungeness crab, and Pacific sardines Contents: 1. Industry overview 2. Sustainability Seafood associations 3. Products
Are we loosing the young generation? Amund Bråthen Senior Advisor Estoril February 7 th 2019
 Are we loosing the young generation? Amund Bråthen Senior Advisor Estoril February 7 th 2019 A MAJOR PART OF WPP, THE WORLD S LARGEST MARKETING COMMUNICATIONS GROUP ADVERTISING & MEDIA HEALTHCARE PR &
1. Registry situation
 Index Registry situation page 1 Production evolution page 2 Foreign market summary page 3 Foreign market 2014 page 4 Cava sales within the EU page 6 Cava sales in other foreign markets page 7 Evolution
Fruit Production and Export in China
 Fruit Production and Export in China Xiuxin Deng College of Hort. & Forestry Huazhong Agricultural University Wuhan, Hubei 430070 P.R.China The Present Situation of Fruit Production China produced 15.2%