How New Technology and Market Access is Increasing the Role of Mexico in Global Produce Trade
|
|
|
- Arthur Jefferson
- 5 years ago
- Views:
Transcription
1 How New Technology and Market Access is Increasing the Role of Mexico in Global Produce Trade DR. ROBERTA COOK Dept. of Agricultural and Resource Economics University of California, Davis for Global Trade Symposium New York City December 2, 2014
2 Agenda US fresh produce imports and the growing role of Mexico Mexico s export concentration on the US market Primer on protected culture The fresh berry story The N. American fresh market tomato story Conclusions
3 US Fresh Produce Imports, by Key Category, $Millions, ,000 14,000 12,000 10,000 8,000 6,000 4,000 2,000 0 Imports: Fresh Veg Imports: Other Fresh Fruit Imports: Bananas/plantains Source: USDA GATS online queries, BICO-10.
4 Fresh fruit and vegetable imports as a share of US fresh utilization/consumption, 2013 (despite rising imports most of US consumption is still produced here) Item % Vegetables, excl. melons and potatoes Melons Potatoes Fruit, all Excluding Bananas Source: Economic Research Service, USDA.
5 Value Shares of Total U.S. Fresh Fruit Imports, by Product Bananas Grapes Other Berries Avocados Citrus Apples & Stone tropical* Pears fruits** * includes pineapples, mangos, papayas, durians ** includes apricots, cherries, peaches, plums Source: Imports Contribute to Year-Round Fresh Fruit Availability, FTS , Dec. 2013, ERS/USDA
6 Value Shares of Total U.S. Fresh Fruit Imports, by Region: Mexico Wins! Equatorial Southern Mexico Canada Others countries* Hemisphere countries** * Equatorial countries include Costa Rica, Guatemala, Ecuador, Colombia, and Honduras ** Southern Hemisphere countries include Chile, Argentina, Peru, New Zealand, Brazil, South Africa, and Australia Source: Imports Contribute to Year-Round Fresh Fruit Availability, FTS , Dec. 2013, ERS/USDA
7 NAFTA Fresh Produce Trade N. American fresh veg trade mainly intra- NAFTA! 77% of US fresh vegetable exports go to Canada, then 8% to Mexico. 2/3 s of US fresh veg imports come from Mexico; most of the remainder from Canada. Fresh fruit trade is diverse beyond NAFTA. Typically Mexico was much more of a veg than a fruit exporter. This is changing.
8 US Imports of Fresh Fruit and Vegetables from Mexico, (excludes canned, frozen, juice and dried) 8,000 7,000 6,000 Vegetables Million $ 5,000 4,000 3,000 2,000 1,000 Fruit 0 Source: USDA/FAS GATS.
9 Mexico s Role in US Fresh Produce Trade Tomatoes, bell peppers, chile peppers, cucumbers, eggplant, green beans, asparagus, brussel sprouts, watermelon, limes, avocados, mangoes, table grapes, papaya, blackberries, raspberries (and emerging in blueberries and strawberries), green onions, sugar snap peas, cilantro many tropical and specialty fruit/veg, both Mexican and Asian. NOT important in leafy greens, broccoli, cauliflower, celery, onions, potatoes, apples, pears, cherries, kiwi, peaches/nectarines/plums, oranges, tangerines, grapefruit, bananas.
10 Mexican Fresh Produce Trade Mexico is a powerhouse fresh fruit and veg exporter and is an integral part of the North American fresh produce supply chain for many commodities. In 2013, Mexican fresh produce exports to the world totaled $8.743 billion including: $4.9B fresh veg, plus $3.9B fresh fruit. To put this in context, the USA exported $7.4 billion of fresh produce in 2013.
11 Shares of Total Mexican Exports of Fresh Produce by Key Country of Destination Product Fruit % US & Canada % Other 14 8 Vegetables % US & Canada % Other 1 1 Source: Calculated by the author based on SIAVI database from Secretaria de Economia, Mexico, Source: Nielsen 52 weeks ending July 12, Excludes nontraditional retailers, such as, Walmart and clubs.
12 Mexican exports of avocados by key country of destination, (million dollars) 1,400 Other Million $ 1,200 1, Canada Japan US Source: calculated by the author based on SIAVI database from Secretaria de Economia, Mexico, 2014.
13 Hass avocado sources of supply in the US market, million pounds, excludes Florida Million pounds 1,800 1,600 1,400 1,200 1, California Chile Mexico Other Source: Hass Avocado Board, online data queries.
14 The Avocado Story in the US Market Mexico gradually achieved full market access. Important to include all shippers into a market as contributors to generic promotion or free riders will make the program unsustainable. California helped to create a national marketing order for promotion of all Hass avocadoes, including imports, administered by the Hass Avocado Board, assessments began in Demographic changes have stimulated demand. The Ca. avo industry is still competitive despite the rapid growth in imports. Generic promotion pays off! Major changes in relative competitiveness and market shares, and quickly!
15 Protected Culture (PC) A continuum from passive to active control of the growing environment
16 Protected Culture Basics Structure location matters even if indoors! Climate, light levels, elevation, humidity, temps, etc. Production season length is especially important for the most capital intensive structures. Canada and the northeastern US cannot grow in the winter without lights, which is usually too costly unless serving a regional or niche market. They face springfall markets when prices are lower. Greenhouse is now in vogue in the USA and there is more interest in locating houses in northerly locations close to destination markets. Technology must improve to make viable and lower energy costs. Time will tell.
17 Protected Culture Basics Still subject to weather events. Economics vary greatly by location. Even shade house production is much higher technology and capital intensive than open field. Shade houses provide some protection from the elements, for all PC, the higher the technology, the more protection but not necessarily cost efficient. PC yields, quality, packouts are much higher than open field, usually get higher average prices but per unit costs are higher. Food safety, labor efficiency and plant disease advantages to PC.
18

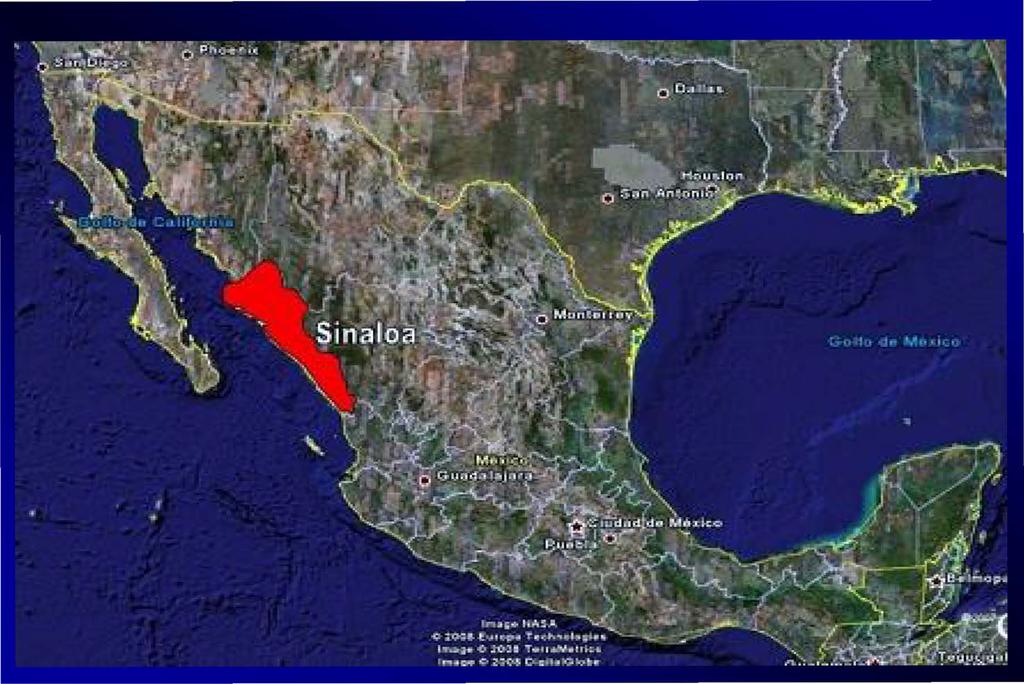
19 A protected culture operation in Sinaloa, Mexico: A warm climate greenhouse
20 Sinaloa vs Rest of Mexico Sinaloa, a winter producer, has always been the biggest tomato exporter to the USA. Unlike in the USA, Sinaloa open field producers have aggressively pursued PC. Minimal extension of season but crop disease protection and other advantages. Low elevation and humid, hot summer climate means high tech greenhouses not appropriate there. To ship year-round, large Sinaloa growers are building higher technology houses in high elevations in central Mexico - temperate climates. As forward-integrated exporters they offer yr-round supplies to buyers.
21 Sinaloa vs Rest of Mexico PC production now exists in most Mexican states. About 50% of the PC acreage is estimated by AMHPAC to be located in Sinaloa, 15% in Jalisco and 12% in Baja. Outside investors have entered greenhouse production in Central Mexico, some are high tech. Many new entrants in Central Mexico have failed due to lack of industry understanding, insufficient capital to make it through 3 yr plus learning curve. Financing from Mexican and European govts have contributed to investments that aren t market-driven.

22 Production of Peppers in Sinaloa, Mexico: Shade houses evolving into hybrids with greenhouses

23 Protected production enables controlled access to facilities, offering food safety benefits

24 Hydroponic production (coconut substrate) of Historical Perspective tomatoes in a greenhouse in Sinaloa, Mexico

25 Hydroponic production of tomatoes in a shade house in Sinaloa, Mexico

26 Protected culture production of raspberries in central Mexico

27 x Plastic tunnel production of blueberries. Source: Dave Brazelton, Fall Creek Farm and Nursery
28 Mexican Fresh Berry Export Industry: An economic cluster developed largely by California and Chilean berry firms
29 US Fresh Blackberry Imports by Source, Metric tons 50,000 40,000 Total 30,000 20,000 10,000 Mexico Source: GATS/FAS/USDA online data query.
30 US Fresh Raspberry Imports by Key Country of Origin, Metric tons 35,000 30,000 25,000 20,000 15,000 10,000 5,000 0 Canada Chile Guatemala/Others Mexico Source: GATS/FAS/USDA online data queries
31 USA Fresh Blueberry Imports by Key Country of Origin, Metric Tons 70,000 60,000 50,000 40,000 30,000 20,000 10,000 0 Note: Jan-Sept 2014 imports from Mexico 7,010 MT vs 4,683 in CY Chile Canada Argentina Mexico Other Source: GATS/FAS/USDA online data queries

32 PC production of blueberries in Central Mexico
33 U.S. Fresh Strawberry Imports From Mexico and Total, Metric tons 150, ,000 90,000 60,000 30,000 Despite the growth, imports still represented only 13% of US consumption in Mexico Total Source: USDA/ERS Fruit and Tree Nut Yearbook, October 2014.

34 x Protected culture production of strawberries, central Mexico.
35 Changing Role of Mexico Mexico just got market access to China for blackberries and raspberries. Several flights/week from Guadalajara to Hong Kong. Shipments may start in early January Matching fund export promotion dollars are available from ProMexico. Export volumes may amount to 5-10% of export value. Chile has duty-free access while Mexico faces 25% duty.
36 Changing Role of Mexico Mexico is likely to replace much of the fall blueberry volume from Argentina in the USA. If Mexico succeeds with strawberries and blueberries it may tighten the market windows of other players. Loss of methyl bromide and the ability to find replacements may play a role in production location. Labor availability and costs are likely to affect location of production.
37 Fresh Tomato Market Supply and Consumption: A Story of Cannibalization and Market Saturation
38 Fresh Tomato Types Field-grown only Mature green tomatoes Vine-ripe tomatoes Tomatillo Protected culture only Beef/round tomatoes with calyx Tomatoes-on-the-vine (TOV) Both field-grown and protected culture Grape tomatoes Romas Cherry Heirloom Other specialty
39 US Fresh Tomatoes: Production, Consumption, Imports, and Exports, p million pounds Imports Consumption Production Exports P Sources: USDA/ERS, Vegetables and Pulses Yearbook Data May 30, 2014; includes an estimated 603,3 million pounds of US greenhouse tomato production and imported greenhouse tomatoes.
40 US Fresh Tomato Imports, All Types, by Key Country, , million pounds Millions 4,000 3,500 3,000 2,500 2,000 1,500 1, Mexico Canada Other Countries Total Sources: US Department of Commerce Foreign Trade Statistics.
41 U.S. Fresh Tomato Imports from Mexico, in Value and Volume, vs and Value (million dollars) Volume (thousand metric tons) Crop Tomatoes 229 1,252 1, ,138 1,363 Source: USDA/ERS Outlook, NAFTA at 17, March 2011 and GATS trade data for
42 U.S. Fresh Field Tomato Production, California and Florida only, (excludes other states and greenhouse) million pounds Florida California 0 Sources: various USDA/NASS Vegetable Annual Reports; and Vegetables Final Estimates , Aug


43 Specialty and Greenhouse Tomatoes Y.E.L.O. Youth, Energy, Life, Om

44 Specialty and Greenhouse Tomatoes

45 Specialty and Greenhouse Tomatoes
46 US Fresh Tomato Trends Foodservice is >50% of tomato volume and relies on mature green tomatoes. Foodservice sales took a hit during the economic downturn, contributing to profit pressure. Mature green tomato industry lost its retail market: only about 7% of tomato quantity sold is mature green.
47 US Retail Fresh Tomato Trends Consumption/purchases via retail channels seems to have maxed out. During the period , for the store universe Nielsen had at the time, the quantity (and $) of tomatoes sold at retail declined in the USA from a peak in due to the economic downturn. 52 wk scanner data ending Sept 27, 2014 shows low growth. Hothouse growing at only.7% in quantity even slower than the total category. Great diversity in tomato types but they cannibalize each other.
48 US Fresh Tomato Retail Market Shares (in $ and pounds) Type, in Key Retailers, 2014 Hothouse 51% Undefined 15% Field 34% Field 49% Undefined 11% Hothouse 40% Dollars Quantity Sources: Village Farms, Perishables Group FreshFacts Powered by Nielsen. *52 weeks ending Sept 27, 2014.
49 Within Hothouse Beefsteaks and TOV declining. Growth is in the snacking category, and specialties, including heirloom. Packaging playing a growing role, with much innovation in both varieties, colors, shapes among leading Canadian and US greenhouse firms. Mexico lagging. All firms focusing on technology improvements, upgrades as competition rises.
50 Within Hothouse In recent years there was little expansion in the US and Canadian greenhouse industries, with most expansion in Mexico. More recently some US producers are expanding, as well as in Ontario (not BC). Some of this growth may be because in the last 2 yrs part of US capacity was not in production due to disease or weather damage. Possibly only ~1200 acres among the major players were shipping.
51 Within Hothouse The impact of this may not be fully taken into account when making expansion decisions. Huge capital requirements for high tech greenhouse construction, >$1 million/acre. Outside investors find industry sexy, and some investments may not be market driven. Recently some large Mexican producers may be slowing investment in PC tomatoes.
52 Big Picture Mature green tomato industry, having lost most of its retail market, is now facing potential competition in the domain it has owned, foodservice. Facing a saturated retail market, hothouse producers have an incentive to get the right varieties for foodservice. Breeders may or may not deliver and relative cost is a factor.
53 Spotlight on Mexican Fresh Tomato Imports: Story of shifts in type of production and growth in yr-rd availability, but growers face market saturation
54 Total US Tomato Imports, by Key Tomato Type, All Countries, (millions of pounds) 4,000 Cherry Grape Hothouse Roma Round Total Pounds (Millions) 3,500 3,000 2,500 2,000 1,500 1, Sources: US Department of Commerce Foreign Trade Statistics.
55 US Hothouse Tomato Imports, by Key Country, (million pounds) Millions 1,800 1,600 1,400 1,200 1, Mexico Canada Other Total Sources: US Department of Commerce Foreign Trade Statistics.
56 US Round Tomato Imports, by Key Country, (million pounds) Millions Mexico Canada Other Total Sources: US Department of Commerce Foreign Trade Statistics.
57 Estimated Area of Protected Culture Tomatoes in Mexico, , Hectares Most of this area is shade house rather than greenhouse, and most is from Sinaloa. Some may not be in production. 15,000 14,000 10,448 4,647 5,466 6, ,259 1,863 2,353 3, Source: Evolucion de la Oferta Horticola en Mexico, , CAADES, Sept. 27, 2010 and various other sources.
58 Canada: Area harvested of Greenhouse Tomatoes, (acres) 1,600 1,400 1, ,417 1, Source: Stat Canada Ontario British Other Canada Columbia
59 US Fresh Tomato Monthly Imports from Mexico, 2013 vs 2004 MT 180, , , , ,000 80,000 60,000 40,000 20, JAN FEB MAR APR MAY JUN JUL AUG SEP OCT NOV DEC Source: USDA GATS online queries.
60 New Tomato Suspension Agreement Too soon to draw conclusions about the impact of the higher minimum prices in effect since March So far volume is stable. May cause producers to be more marketdriven. Restricting supply can lead to higher prices (due to relatively inelastic demand) but these may be difficult to sustain without acreage controls due to supply response dynamics; barriers to entry play a role.
61 Mexican Tomato Industry The development of new PC producers throughout Mexico is bringing new tomato products into the domestic market, competing both with traditional small producers in central Mexico and growers in Sinaloa and Baja in their seasons. PC is a major new force for this dual market crop (export and domestic markets are both important to profitability for some growerexporters), and may become more important with the higher suspension prices.
62 Mexican Protected Culture and Future Product Mix The berry cluster in central Mexico is attracting attention from tomato PC producers there. Will there be synergies between these two commodity sectors? Could there be non-market driven expansion in berries given the allure of PC production?
63 Potential Mexican Concerns Security. Institutional instability. Trade disputes. Partner risk. Intellectual property right risks. Corruption, legal structure, transaction costs. Investment coming from outside the sector which is not market driven. Water. Social issues. Labor. Capital costs
64 Mexico s Farm Workforce Has Declined between 1995 and 2010 No panacea there either Workforce in millions Source: ARE Update May/Apr (4):1-4
65 Conclusions Tomato market focusing more on quality, with emphasis on flavor, aided by seed innovation. Export marketing from Mexico still too fragmented, disrupts market. Consolidation already occurred with US and open field shippers. Consolidation expected among US GH shippers. Higher suspension prices may impose more market orderliness, to the benefit of most, time will tell.
66 Conclusions Future of foodservice tomato market a big unknown. At retail, demand is maturing for tomatoes and cannibalization is rampant, across tomato types and sectors. The Mexican berry export sector is likely to grow, with growing pains expected. Mexico will continue to expand produce exports as long as market demand warrants. Proximity means focus on the USA, but growth elsewhere as market access improves. All producers must think carefully about scaling their operations to meet market demand!
Some Insights on the N. American Fresh Produce Industry in the Context of NAFTA Renegotiation
 Some Insights on the N. American Fresh Produce Industry in the Context of NAFTA Renegotiation DR. ROBERTA COOK Dept. of Ag and Resource Economics Emerita Faculty University of California, Davis for NAFTA,
U.S. Produce Imports from Mexico
 USDA iiiiillllllllll United States Department of Agriculture U.S. Produce Imports from Mexico Linda Calvin and Steven Zahniser U.S. Department of Agriculture Economic Research Service Presentation to the
Fresh Deciduous Fruit (Apples, Grapes, & Pears): World Markets and Trade
: World Markets and Trade") Million MT United States Department of Agriculture Foreign Agricultural Service December 21 Fresh Deciduous Fruit (Apples, Grapes, & Pears): World Markets and Trade 21/11 Forecast: World Apple Trade Declines;
Million MT United States Department of Agriculture Foreign Agricultural Service December 21 Fresh Deciduous Fruit (Apples, Grapes, & Pears): World Markets and Trade 21/11 Forecast: World Apple Trade Declines;
Part 1: California Ag Exports Main Points From 2008 to 2009 California agricultural exports declined about 5 percent.
 The Importance of California Agricultural Exports: Situation, Outlook and Policy Prospects, with emphasis on the Korea Free Trade Agreement California Fresh Carrot Advisory Board 11 Research hsymposium
and the World Market for Wine The Central Valley is a Central Part of the Competitive World of Wine What is happening in the world of wine?
 The Central Valley Winegrape Industry and the World Market for Wine Daniel A. Sumner University it of California i Agricultural l Issues Center January 5, 211 The Central Valley is a Central Part of the
Record exports in coffee year 2017/18
 Record exports in coffee year 2017/18 Total coffee exports increased each year since 2010/11 with a new record reached in 2017/18 at 121.86 million bags, 2% higher than 2016/17. In the twelve months ending
Coffee prices rose slightly in January 2019
 Coffee prices rose slightly in January 2019 In January 2019, the ICO composite indicator rose by 0.9% to 101.56 US cents/lb as prices for all group indicators increased. After starting at a low of 99.16
The Changing Landscape of Dairy: A Regional Outlook. Mark Stephenson Director of Dairy Policy Analysis
 The Changing Landscape of Dairy: A Regional Outlook Mark Stephenson Director of Dairy Policy Analysis Millions of Pounds Let s remember when 32,000 30,000 28,000 Wisconsin Annual Milk Production It s the
Downward correction as funds respond to increasingly positive supply outlook
 Downward correction as funds respond to increasingly positive supply outlook Coffee prices fell sharply at the end of April as institutional investors sold off their positions. The coffee market continues
THIS REPORT CONTAINS ASSESSMENTS OF COMMODITY AND TRADE ISSUES MADE BY USDA STAFF AND NOT NECESSARILY STATEMENTS OF OFFICIAL U.S.
 THIS REPORT CONTAINS ASSESSMENTS OF COMMODITY AND TRADE ISSUES MADE BY USDA STAFF AND NOT NECESSARILY STATEMENTS OF OFFICIAL U.S. GOVERNMENT POLICY Required Report - public distribution Date: GAIN Report
Strawberry Production & Supply
 Trends in North American Strawberry Production & Supply by Tom Sjulin, Consultant Presented at the International Strawberry Congress Antwerp, Belgium 1 September 2010 1 Objectives Review North American
Chile. Tree Nuts Annual. Almonds and Walnuts Annual Report
 THIS REPORT CONTAINS ASSESSMENTS OF COMMODITY AND TRADE ISSUES MADE BY USDA STAFF AND NOT NECESSARILY STATEMENTS OF OFFICIAL U.S. GOVERNMENT POLICY Required Report - public distribution Date: GAIN Report
Mango Retail Performance Report 2017
 Mango Retail Performance Report 2017 1 Table of Contents Pages 3-9 Pages 10-15 Pages 16-34 Pages 35-44 Pages 45-51 Pages 52-54 Executive Summary Fruit and Tropical Fruit Performance Whole Mango Performance
2014 U.S. Dry Bean Outlook
 2014 U.S. Dry Bean Outlook Steven Zahniser and Hodan Farah Wells USDA Economic Research Service Presentation delivered at U.S. Dry Bean Convention Coeur d Alene, ID, August 5, 2014 The views expressed
Market Brief for Asia Fruit Logistica. Hong Kong & Macau, Makret Dynamic Markets for U.S. Exports
 Market Brief for Asia Fruit Logistica Hong Kong & Macau, Makret Dynamic Markets for U.S. Exports September 5, 2017 1 USDA Foreign Agricultural Service (FAS) - ATO Hong Kong - FAS offices are staffed by
Coffee market settles lower amidst strong global exports
 Coffee market settles lower amidst strong global exports The ICO composite indicator price declined by 1.2% in February 2018 to an average of 114.19 US cents/lb. Indicator prices for all three Arabica
Coffee Season 2013/14 Finishes in Balance but Deficit Expected Next Year
 Coffee Season 2013/14 Finishes in Balance but Deficit Expected Next Year Coffee prices were volatile again over the course of September, mostly reacting to weather news from Brazil. Daily prices fell initially
Fresh Deciduous Fruit (Apples, Grapes, & Pears): World Markets and Trade
: World Markets and Trade") United States Department of Agriculture Foreign Agricultural Service Fresh Deciduous Fruit (Apples, Grapes, & Pears): World Markets and Trade 9 1, MT Deciduous Fruit on Seasonal Cycles 6 Northern Hemisphere
United States Department of Agriculture Foreign Agricultural Service Fresh Deciduous Fruit (Apples, Grapes, & Pears): World Markets and Trade 9 1, MT Deciduous Fruit on Seasonal Cycles 6 Northern Hemisphere
MONTHLY COFFEE MARKET REPORT
 E MONTHLY COFFEE MARKET REPORT June 2013 Coffee prices fell sharply in June 2013, as market fundamentals, combined with an uncertain macroeconomic outlook, drove the ICO composite indicator price to its
Coffee market recovers slightly from December slump
 Coffee market recovers slightly from December slump After reaching its lowest level in 22 months in December 2017, the monthly average of the ICO composite indicator price increased by 1.4% to 115.60 US
2018/19 expected to be the second year of surplus
 2018/19 expected to be the second year of surplus Coffee year 2018/19 is expected to be the second consecutive season of surplus, as global output, estimated at 167.47 million bags, exceeds world consumption,
Overview of the Manganese Industry
 39th Annual Conference Istanbul, Turkey 2013 Overview of the Manganese Industry International Manganese Institute Alberto Saavedra Market Research Manager June, 2013 Introduction Global Production Supply,
Global Fresh Berry Trends: Focus on the European Market
 Global Fresh Berry Trends: Focus on the European Market DR. ROBERTA COOK Dept. of Ag and Resource Economics Emerita Faculty University of California, Davis November 16, 2017 for Amsterdam Produce Show
Coffee market ends 2017/18 in surplus
 Coffee market ends 217/18 in surplus World coffee production in coffee year 217/18 is estimated 5.7% higher at 164.81 million bags as output of Arabica increased by 2.2% to 11.82, and Robusta grew 11.7%
Globalization of Agriculture: An Ownership and Market Perspective. Ken Sullivan March 7, 2017
 Globalization of Agriculture: An Ownership and Market Perspective Ken Sullivan March 7, 2017 History and Context 3 $14BN COMPANY THAT OPERATES IN 23 U.S. STATES AND 5 COUNTRIES Smithfield s vertically
An Overview of the U.S. Bell Pepper Industry. Trina Biswas, Zhengfei Guan, 1 Feng Wu University of Florida
 An Overview of the U.S. Bell Pepper Industry Trina Biswas, Zhengfei Guan, 1 Feng Wu University of Florida Bell pepper is one of the most widely cultivated vegetable crops in the world. Characterized by
Outlook for the. ASEAN INTERNATIONAL SEMINAR ON COFFEE June 2012 Kuta, Bali, Indonesia
 Outlook for the World Coffee Market ASEAN INTERNATIONAL SEMINAR ON COFFEE 12 13 June 212 Kuta, Bali, Indonesia José Sette Head of Operations ICO Composite Indicator Price (in current terms) Monthly averages:
Prices for all coffee groups increased in May
 Prices for all coffee groups increased in May In May 2018, the ICO composite indicator increased by 0.7% to an average of 113.34 US cents/lb, following three months of declines. Prices for all coffee groups
For personal use only
 SEPTEMBER 216 GLOBAL DAIRY UPDATE European milk production has decreased for the first time since early 215, with volumes in June down 2 compared to last year. Last week we announced our annual results,
July marks another month of continuous low prices
 July marks another month of continuous low prices In July 2018, the ICO composite indicator price decreased by 2.9% to an average of 107.20 US cents/lb, which is the lowest monthly average for July since
J / A V 9 / N O.
 July/Aug 2003 Volume 9 / NO. 7 See Story on Page 4 Implications for California Walnut Producers By Mechel S. Paggi, Ph.D. Global production of walnuts is forecast to be up 3 percent in 2002/03 reaching
MONTHLY COFFEE MARKET REPORT
 E MONTHLY COFFEE MARKET REPORT February 2014 February 2014 has seen significant developments in the coffee market, with prices shooting upwards at a startling rate. The ICO composite daily price has increased
MANGO PERFORMANCE BENCHMARK REPORT
 MANGO PERFORMANCE BENCHMARK REPORT 2015-2016 TABLE OF CONTENTS Page 3 Page 5 Page 12 Page 15 Page 27 Page 36 Page 46 Approach and Data Set Parameters Overview and Mango Trend-Spotting Fruit and Tropical
DEVELOPMENTS IN STEEL SCRAP IN 2009
 DEVELOPMENTS IN STEEL SCRAP IN 2009 AMERICAN SCRAP COALITION WASHINGTON, DC DEVELOPMENTS IN STEEL SCRAP 2009 The year 2009 demonstrated that the United States continues to experience a crisis with respect
Soft Commodity Markets - Upcoming Milestones, and How the Market Could Be Affected
 Soft Commodity Markets - Upcoming Milestones, and How the Market Could Be Affected September 15, 2014 Judith Ganes President J. Ganes Consulting, LLC Weather & Politics Current Weather Expectations El
GLOBAL DAIRY UPDATE KEY DATES MARCH 2017
 MARCH 2017 GLOBAL DAIRY UPDATE European milk production decreased for the seventh consecutive month, while the US remains strong. The rate of decline in New Zealand production is easing. US exports continue
THE GLOBAL PULSE MARKETS: recent trends and outlook
 THE GLOBAL PULSE MARKETS: recent trends and outlook CICILS/IPTIC 2004 CONVENTION 10-12 12 June 2004 Beijing, China Boubaker BENBELHASSEN Commodities and Trade Division United Nations Food and Agriculture
Global Wine Report SAN JOAQUIN VALLEY WINE GROWERS ASSOCIATION NOVEMBER 29, 2017 DEDICATED BROKERS IN 8 COUNTRIES
 Global Wine Report SAN JOAQUIN VALLEY WINE GROWERS ASSOCIATION NOVEMBER 29, 2017 DEDICATED BROKERS IN 8 COUNTRIES GLOBALLY BASED TO BUILD YOUR BUSINESS WORLDWIDE 1 INTRODUCTION Ciatti Co à 8 Regional Offices
Networkers Business Update. December 2014
 Networkers Business Update December 2014 Agenda Forecast Milk Price Global markets V3 Strategy Growing our share of New Zealand milk Page 2 Forecast Milk Price 110 100 2012/13 2013/14 2014/15 Forecast
Record Exports for Coffee Year 2016/17
 Record Exports for Coffee Year 2016/17 Total exports in September 2017 reached 8.34 million bags, compared to 9.8 million in September 2016. While coffee year 2016/17 registered a decrease in its final
Market Brief for Seafood Expo Asia. Hong Kong & Macau, Makret Dynamic Markets for U.S. Exports
 Market Brief for Seafood Expo Asia Hong Kong & Macau, Makret Dynamic Markets for U.S. Exports September 4, 2017 1 USDA Foreign Agricultural Service (FAS) - ATO Hong Kong - FAS offices are staffed by Foreign
World coffee consumption increases but prices still low
 World coffee consumption increases but prices still low The coffee market stabilised slightly in February, but prices remain at very low levels. A lack of news regarding fundamentals with expectations
Global Grape Report JUI CE P RODU C TS A S SOCI ATION FA L L BU S I N ESS M E E TING N OV E MBER 5,
 Global Grape Report JUICE PRODUCTS ASSOCIATION 2017 FALL BUSINESS MEETING NOVEMBER 5, 2017 DEDICATED BROKERS IN 8 COUNTRIES GLOBALLY BASED TO BUILD YOUR BUSINESS WORLDWIDE INTRODUCTION Ciatti Co 8 Regional
Vegetables and Pulses Outlook
 VGS-351 Sept. 27, 2012 Vegetables and Pulses Outlook Suzanne Thornsbury sthornsbury@ers.usda.gov Andy Jerardo ajerardo@ers.usda.gov Hodan Farah Wells hfarah@ers.usda.gov Mushroom Production Reaches Record
Agricultural Exports, Economic Prospects and Jobs
 Agricultural Exports, Economic Prospects and Jobs West Hills Community College District Essential Elements Harris Ranch Inn and Conference Center November 6, 2014 Daniel A. Sumner University of California
Volatility returns to the coffee market as prices stay low
 Volatility returns to the coffee market as prices stay low Daily coffee prices hit their lowest level in 19 months during August, as commodity markets worldwide were negatively affected by currency movements
Record exports from Brazil weigh heavy on the coffee market
 Record exports from Brazil weigh heavy on the coffee market Coffee exports from Brazil reached a record high of 36.8 million bags in crop year 2014/15 (April to March), fuelled by domestic stocks and encouraged
Citrus: World Markets and Trade
 Department of Agriculture eign Agricultural Service January Citrus: World Markets and Trade Citrus: / ecast Global Orange Production and Trade Expand Global production and trade for is forecast at. million
MARCOS S. JANK. JAPAN BRAZIL Bilateral Dynamics and Partnership in the Agri-Food Sector
 MARCOS S. JANK JAPAN BRAZIL Bilateral Dynamics and Partnership in the Agri-Food Sector JAPAN-BRAZIL BUSINESS COUNCIL Tokyo, Japan 24 th July 2018 Japan and Brazil Competitive Advantages in the Agri-Food
The Potential Role of Latin America Food Trade in Asia Pacific PECC Agricultural and Food Policy Forum Taipei
 The Potential Role of Latin America Food Trade in Asia Pacific 2011 PECC Agricultural and Food Policy Forum Taipei Universidad EAFIT, Colombia December 2, 2011 1 CONTENTS 1. Introduction 2. Food Trade
Milk and Milk Products: Price and Trade Update
 Milk and Milk Products: Price and Trade Update June 217 * International dairy prices The FAO Dairy Price Index averaged 29 points in June, up 16 points (8.3 percent) from January 217 and 71 points (51.5
Export market trends and outlook
 Export market trends and outlook Much better! 28 th July 2017 Tim Hunt General Manager Food & Agribusiness Research Rabobank Food & Agribusiness Research Rabobank s unique global team of 90 analysts supporting
much better than in As may be seen in Table 1, the futures market prices for the next 12 months
 Dairy Outlook December 2009 By Jim Dunn Professor of Agricultural Economics, Penn State University Market Psychology prices are higher than last month, especially Class IV. The outlook for dairy prices
Wines of British Columbia Liberal Party of Canada s Pacific Caucus (July 19, 2016)
") Wines of British Columbia Liberal Party of Canada s Pacific Caucus (July 19, 2016) Wine Region Comparison Region Acres Spain 2,724,700 France 1,966,510 Italy 1,712,607 United States 943,750 Argentina 560,000
Wines of British Columbia Liberal Party of Canada s Pacific Caucus (July 19, 2016) Wine Region Comparison Region Acres Spain 2,724,700 France 1,966,510 Italy 1,712,607 United States 943,750 Argentina 560,000
A Snapshot of the Canadian Fruit Industry, 2009
 A Snapshot of the Canadian Fruit Industry, 2009 Prepared by: Market Analysis and Information Section Horticulture and Special Crops Division Agriculture and Agri-Food Canada December 2010 A Snapshot of
Trade Economics of Olives and Olive Oil: Data and Issues. Sacramento Valley Olive Day. Orland, July 6, 2018
 Trade Economics of Olives and Olive Oil: Data and Issues Sacramento Valley Olive Day Orland, July 6, 2018 Daniel A. Sumner and William A. Matthews University of California Agricultural Issues Center Motivation,
MONTHLY COFFEE MARKET REPORT
 1 E MONTHLY COFFEE MARKET REPORT March 2014 Ongoing uncertainty over the Brazilian coffee crop has caused significant fluctuations in coffee prices during March, with monthly volatility of the International
Coffee prices maintain downward trend as 2015/16 production estimates show slight recovery
 Coffee prices maintain downward trend as 2015/16 production estimates show slight recovery The coffee market fell again in December 2015, reaching its second lowest monthly average of the year. This decrease
Coffee market ends 2016/17 coffee year in deficit for the third consecutive year
 Coffee market ends 2016/17 coffee year in deficit for the third consecutive year The ICO composite indicator continued its downward trend that started at the end of August, averaging 124.46 US cents/lb.
WORLD SPICE CONGRESS 2010 Black & White Pepper Crop Report. Harris Freeman & Co.
 WORLD SPICE CONGRESS 2010 Black & White Pepper Crop Report Harris Freeman & Co. 1 The Past BLACK & WHITE PEPPER CROP REPORT A 5-Year PERSPECTIVE 5 year Supply & Demand statistics Factors Affecting Supply
Coffee market ends 2014 at ten month low
 Coffee market ends 2014 at ten month low Coffee prices continued to slide downwards in December 2014, with the monthly average of the ICO composite indicator at its lowest level since February. Recent
QUARTERLY REVIEW OF THE PERFORMANCE OF THE DAIRY INDUSTRY 1
 QUARTERLY REVIEW OF THE PERFORMANCE OF THE DAIRY INDUSTRY 1 The information in this document is from sources deemed to be correct. Milk SA, the MPO and SAMPRO are not responsible for the results of any
2017 U.S. DISTILLERS GRAINS EXPORTS
 217 U.S. DISTILLERS GRAINS EXPORTS 14, Annual U.S. Distillers Grains Exports 12, 12,695 1, 8, 6, 4, 2, 2,358 4,532 5,651 9,5 7,676 7,421 9,67 11,284 11,314 11,77 U.S. exports of distillers grains (DG)
Although food imports
 Imports Play a Growing Role in the American Diet Linda Scott Kantor and Margaret Malanoski (202) 694-5456 (202) 395-3122 Although food imports account for a relatively small share of the total U.S. diet,
Coffee market continues downward trend
 Coffee market continues downward trend Since August 2017, the ICO composite indicator price has declined in each month except January 2018. The composite indicator decreased by 1.1% in March 2018 to an
January 2015 WORLD GRAPE MARKET SUPPLY, DEMAND AND FORECAST
 January 2015 WORLD GRAPE MARKET SUPPLY, DEMAND AND FORECAST Table of Contents Executive Summary... 4 1. VARIETIES OF GRAPES... 6 1.1. White table grapes... 6 1.2. Red table grapes... 6 2. WORLD DEMAND
Increased U.S. Imports of Fresh Fruit and Vegetables
 United States Department of Agriculture FTS-328-1 September 27 A Report from the Economic Research Service www.ers.usda.gov Increased U.S. Imports of Fresh Fruit and Vegetables Sophia Huang and Kuo Huang
STATE OF THE VITIVINICULTURE WORLD MARKET
 STATE OF THE VITIVINICULTURE WORLD MARKET April 2018 1 Table of contents 1. VITICULTURAL PRODUCTION POTENTIAL 3 2. WINE PRODUCTION 5 3. WINE CONSUMPTION 7 4. INTERNATIONAL TRADE 9 Abbreviations: kha: thousands
Fresh Deciduous Fruit (Apples, Grapes, & Pears): World Markets and Trade
: World Markets and Trade") Fresh Deciduous Fruit (Apples, Grapes, & Pears): World Markets and Trade June 21 APPLES Record Production but Trade Estimate Revised Downward The world production estimate for 29/1 is virtually unchanged
Fresh Deciduous Fruit (Apples, Grapes, & Pears): World Markets and Trade June 21 APPLES Record Production but Trade Estimate Revised Downward The world production estimate for 29/1 is virtually unchanged
Coffee market remains volatile but lacks direction
 Coffee market remains volatile but lacks direction Prices fluctuated significantly during August, with the ICO composite indicator dropping by 10 cents before jumping back up another 12 cents by the end
Corn and Soybean CORN OUTLOOK SOYBEAN OUTLOOK STATISTICS AND ANALYSIS
 Corn and Soybean CORN OUTLOOK SOYBEAN OUTLOOK STATISTICS AND ANALYSIS CLAL (and its officers, employees and auxiliary persons) shall not be liable to clients, web users or anyone else for any loss or injury
World of sugar PAGE 54
 World of sugar More than 1 countries produce sugar, about 8% of which is made from sugar cane grown primarily in the tropical and sub-tropical zones of the southern hemisphere, and the balance from sugar
Outline. Long-term Outlook for Cotton Consumption. World End-Use Consumption of Textile Fibers. World Consumption of Textile Fibers
 World Cotton Supply and Use International Cotton Advisory Committee Secretariat Outline! Long-term Outlook for Consumption! Outlook for /! Developments in World Cotton Trade Fifth Open Session: Cotton
China: The Untapped Freighter Market
 China: The Untapped Freighter Market A China USA perspective Marco Bloemen, YDL Management Consultants E: marco@ydl.nl T:+31-3465-64244 Scope of this presentation Macro-economic figures China - USA Air
Dairy Market. Overview. Commercial Use of Dairy Products
 Dairy Market Dairy Management Inc. R E P O R T Volume 21 No. 6 June 2018 DMI NMPF Overview U.S. dairy markets received a one-two punch during the first weeks of June in the form of collateral damage from
Consistently higher production and more exportable supplies from Thailand are major factors in the decline in world rice prices in 2014 and continued
 Rice Consistently higher production and more exportable supplies from Thailand are major factors in the decline in world rice prices in 2014 and continued lower levels over the next ten years. Part of
Outlook for the World Coffee Market
 Outlook for the World Coffee Market 8 th AFRICAN FINE COFFEE CONFERENCE & EXHIBITION 17 to 19 February 2011 Arusha, Tanzania José Sette Executive Director a.i. 225 ICO composite indicator price Monthly:
China: Opportunities & Challenges for Produce from South America. Mabel Zhuang Director, M.Z. Marketing Communications PMA China Consultant
 China: Opportunities & Challenges for Produce from South America Mabel Zhuang Director, M.Z. Marketing Communications PMA China Consultant Agenda A Little Background: China s Economy Overview Setting the
Export Essentials Pulse Trade Data
 Export Essentials Pulse Trade Data North America and Australia Q1 2013 Introduction There are many ways of telling stories. Words and pictures are the most common and easiest to understand. Our Export
GLOBAL SUPPLY UPDATE GLENN PROCTOR FEBRUARY 7, 2018
 GLOBAL SUPPLY UPDATE GLENN PROCTOR FEBRUARY 7, 2018 21 DEDICATED BROKERS IN 8 COUNTRIES GLOBALLY BASED TO BUILD YOUR BUSINESS WORLDWIDE INTRODUCTION - CIATTI CO 8 REGIONAL OFFICES WORLDWIDE - WINE, GRAPES,
Economic Role of Maize in Thailand
 Economic Role of Maize in Thailand Hnin Ei Win Center for Applied Economics Research Thailand INTRODUCTION Maize is an important agricultural product in Thailand which is being used for both food and feed
April 2015 Newsletter
 April 2015 Newsletter The Potato Storage Holdings report just released for April 2015 (Page 2), shows Canadian holdings to be almost 1% below that of a year ago, with 41.4 million cwt. left to go to market.
Chilean Table Grapes in North America. Presented by Tom Tjerandsen Managing Director - North America Chilean Fresh Fruit Association
 Chilean Table Grapes in North America Presented by Tom Tjerandsen Managing Director - North America Chilean Fresh Fruit Association 1 Chilean Table Grapes in North America Agenda Background on the Table
Taiwan Fishery Trade: Import Demand Market for Shrimps. Bith-Hong Ling
 International Symposium Agribusiness Management towards Strengthening Agricultural Development and Trade III : Agribusiness Research on Marketing and Trade Taiwan Fishery Trade: Import Demand Market for
IN THIS ISSUE FEBRUARY Financial Calendar: Late September 2014 Annual Results Announced. 26 March 2014 Interim Results Announced
 FEBRUARY 2014 Welcome to our latest Global Dairy Update. This update is part of Fonterra s commitment to informing our farmers and wider stakeholders about the global dairy market, trends in New Zealand
Other brands of Organic Blackberries continue with steady supplies out of Mexico.
 Organic outlook March 30 - APRIL 6, 2018 www.fsproduce.com 10 lb O R G A I C G R A P E u p d at e South African grown Organic Red and Green Seedless Grapes and Black Seeded Grapes are in good supply for
MONTHLY COFFEE MARKET REPORT
 E MONTHLY COFFEE MARKET REPORT May 2014 After five consecutive months of rising prices, the coffee market reversed lower in May. From a high of 179 cents/lb in April, the daily price of the ICO composite
Citrus: World Markets and Trade
 United States Department of Agriculture Foreign Agricultural Service Citrus: World Markets and Trade Oranges Global orange production for 2012/13 is forecast to drop over 4 percent from the previous year
Growing divergence between Arabica and Robusta exports
 Growing divergence between Arabica and Robusta exports In April 218, the ICO composite indicator decreased by.4% to an average of 112.56, with the daily price ranging between 11.49 and 114.73. Prices for
Acreage Forecast
 World (John Sandbakken and Larry Kleingartner) The sunflower is native to North America but commercialization of the plant took place in Russia. Sunflower oil is the preferred oil in most of Europe, Mexico
Dairy Outlook. December By Jim Dunn Professor of Agricultural Economics, Penn State University. Market Psychology
 Dairy Outlook December 2015 By Jim Dunn Professor of Agricultural Economics, Penn State University Market Psychology The Class III market has taken a beating lately as cheese prices have drifted down and
UNDERSTANDING CHINA: THE PECAN EXPORT MARKET & TOTAL CONSUMPTION
 UNDERSTANDING CHINA: THE PECAN EXPORT MARKET & TOTAL CONSUMPTION INSHELL PECAN IMPORTS BY CHINA UNITED STATES SOUTH AFRICA MEXICO U.S. INSHELL AND PECAN KERNEL EXPORTS TO CHINA (MT) (12 Month Comparison:
2007 Sonoma Research Associates - All rights reserved.
 2007 Sonoma Research Associates - All rights reserved. Practical Applications of the Price Elasticity of Demand Presented by Dan Karnowsky, President Sonoma Research Associates Presented at Competitive
Cultivation Pattern:
 Introduction: Cumin seed commonly know as Jeera (Cuminum cyminum) belongs to Apiacae family. Though Cumin is a native of Egypt, it now mostly produced in India. India is the largest producer and consumer
KOREA MARKET REPORT: FRUIT AND VEGETABLES
 KOREA MARKET REPORT: FRUIT AND VEGETABLES 주한뉴질랜드대사관 NEW ZEALAND EMBASSY SEOUL DECEMBER 2016 Page 2 of 6 Note for readers This report has been produced by MFAT and NZTE staff of the New Zealand Embassy
UTZ Coffee Statistics Report 2017
 UTZ Coffee Statistics Report 2017 UTZ is the largest certification program in the world for sustainable coffee More than 480,000 coffee farmers and workers benefit from the UTZ program UTZ certified coffee
THIS REPORT CONTAINS ASSESSMENTS OF COMMODITY AND TRADE ISSUES MADE BY USDA STAFF AND NOT NECESSARILY STATEMENTS OF OFFICIAL U.S.
 THIS REPORT CONTAINS ASSESSMENTS OF COMMODITY AND TRADE ISSUES MADE BY USDA STAFF AND NOT NECESSARILY STATEMENTS OF OFFICIAL U.S. GOVERNMENT POLICY Required Report - public distribution Date: GAIN Report
Welcome to our May 2014 Global Dairy Update
 Welcome to our May 2014 Global Dairy Update IN THIS EDITION New Zealand milk volumes 8% higher and Australia 3% lower to 30 April 2014 Business Update: NZ Milk Products third quarter update Regulatory
SOUTH AFRICAN FRUIT TRADE FLOW
 SOUTH AFRICAN FRUIT TRADE FLOW Issue No. 24: December 216 Compiled by Thandeka Ntshangase and Lucius Phaleng and Yolanda Potelwa Table of Contents Contents 1. Background... 3 2. Overview of pome fruit
Imports Contribute to Year-Round Fresh Fruit Availability
 United States Department of Agriculture A Report from the Economic Research Service www.ers.usda.gov FTS-356-1 December 213 Imports Contribute to Year-Round Fresh Fruit Availability Sophia Wu Huang Abstract