MMO Economic Board. Milk Market Observatory. Meeting of 28 November 2017
|
|
|
- Augustine Holland
- 5 years ago
- Views:
Transcription
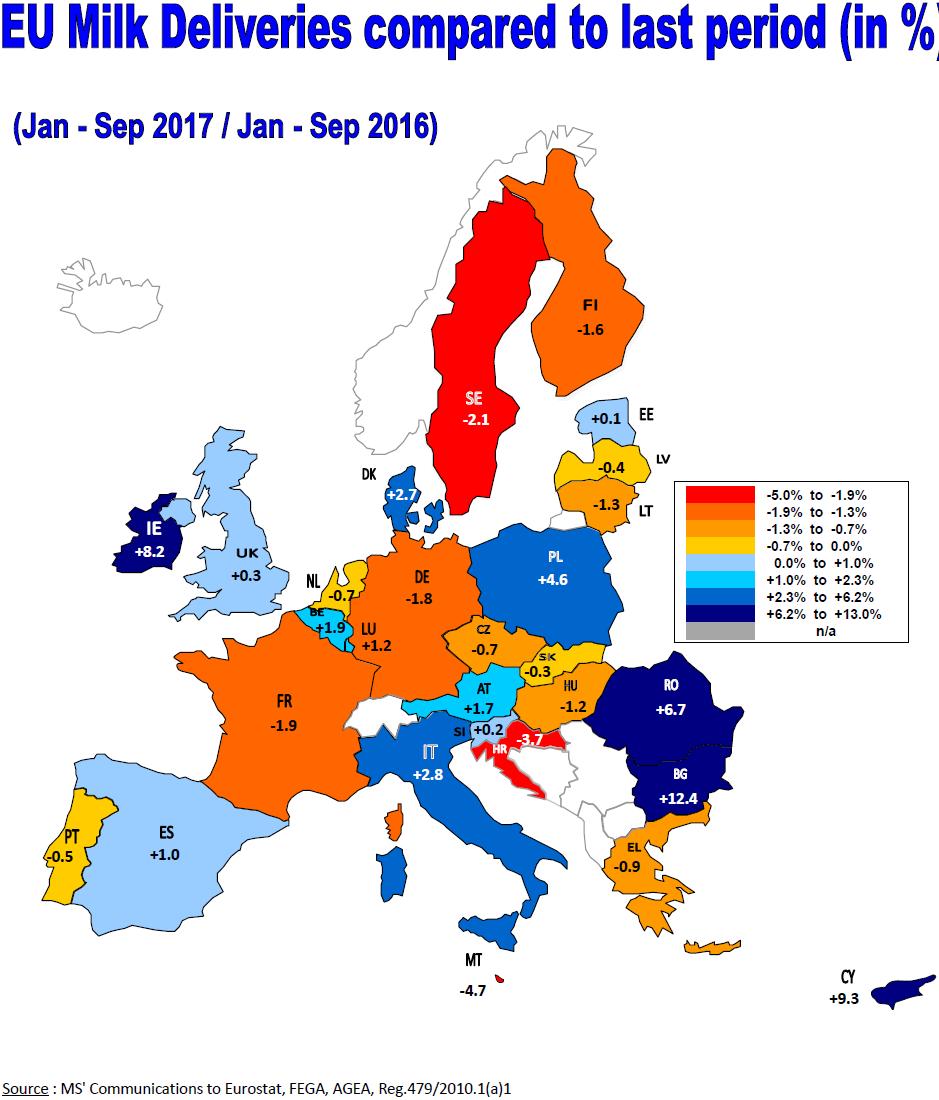
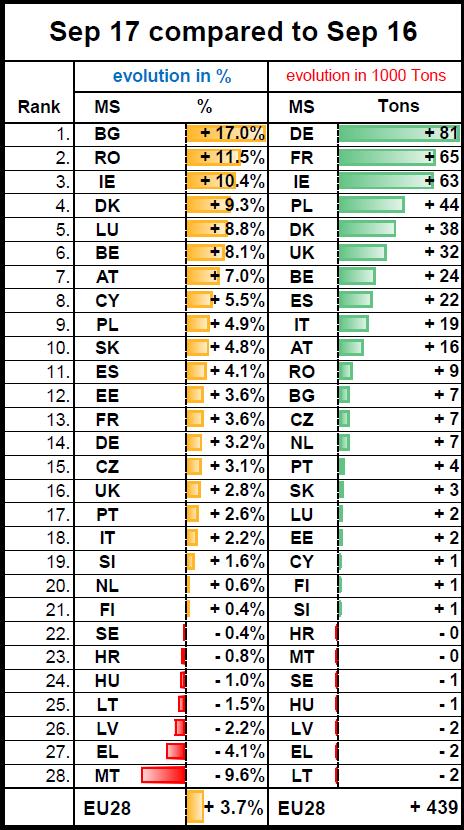
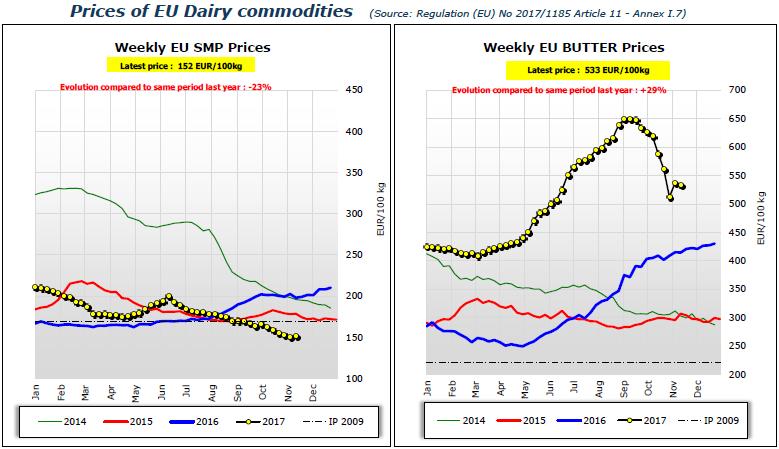
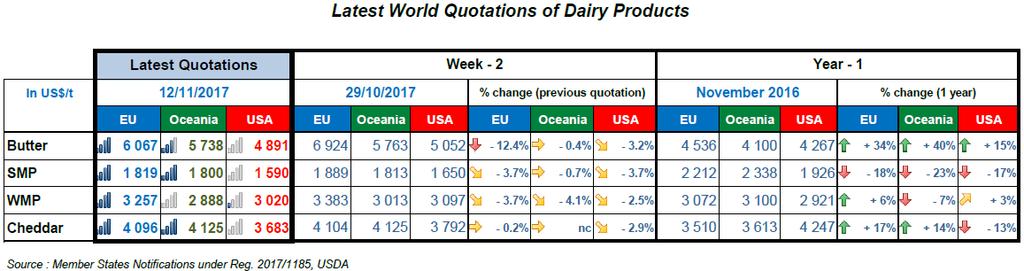
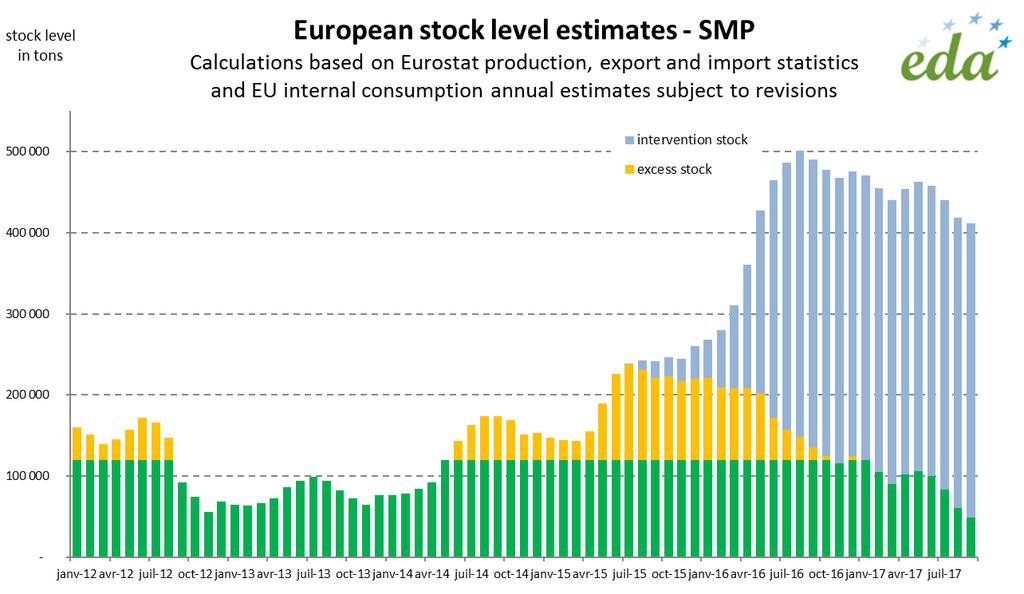
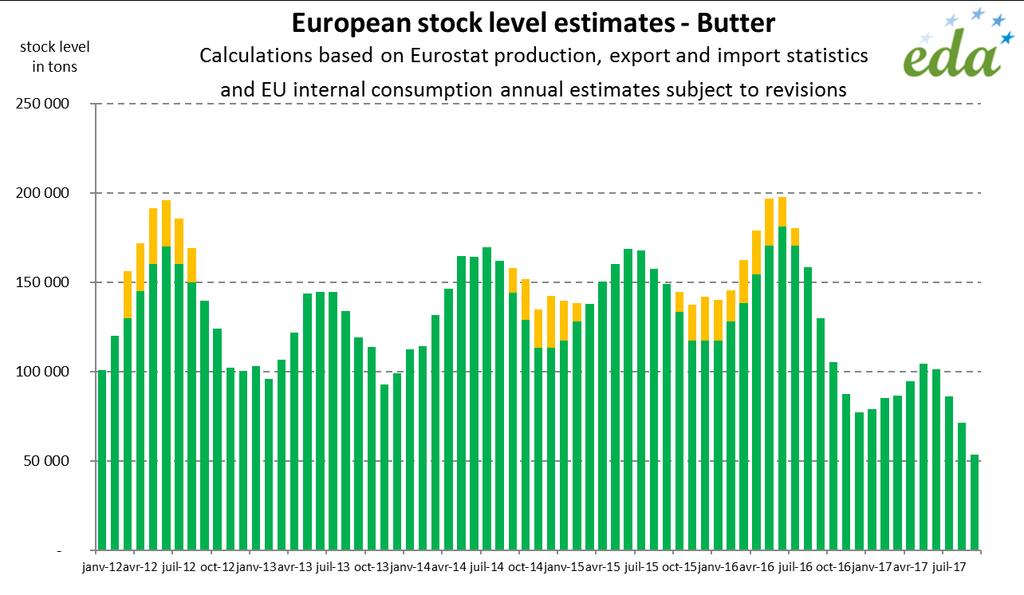
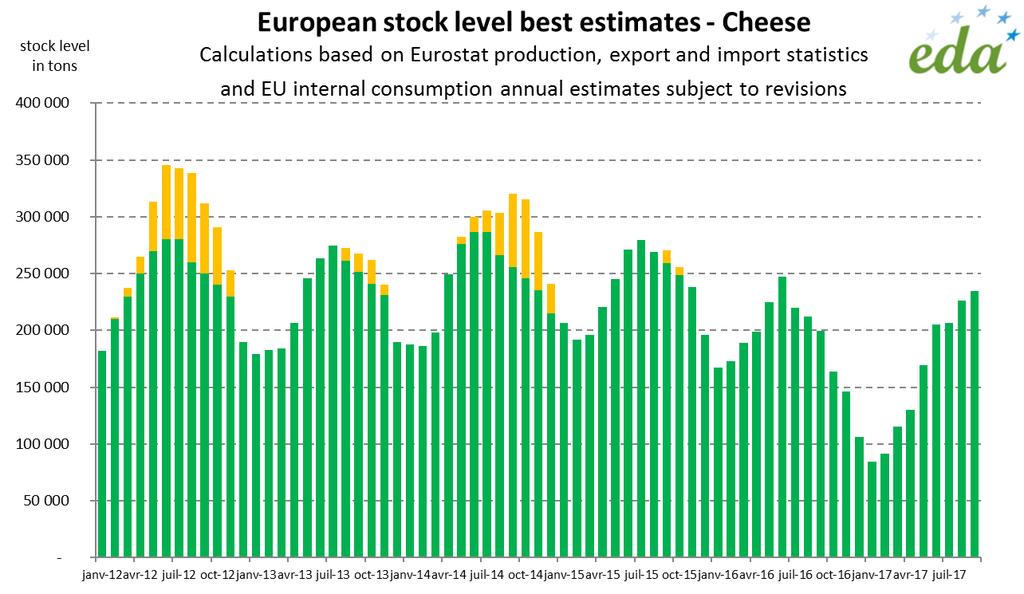
1 Milk Market Observatory Last update : MMO Economic Board Meeting of 28 November 2017 o The 24th meeting of the MMO Economic Board took place on 28/11/2017, with the participation of experts from the various steps in the milk supply chain: CEJA (young farmers), COPA- COGECA (producers and cooperatives), ECVC (Via Campesina), EDA (dairy industry), Eucolait (dairy trade) and Eurocommerce (retail). The EMB (European Milk Board) was not present. Presentations and information exchanged during the meeting showed the following. o EU milk deliveries increased in September 2017 by t while cumulated collection increased in Jan-Sep by a mere 0.4%. Recent growth has been particularly notable in DE, FR and IE. Only 7 Member States notified production drops in September, and those concerned modest amounts. SMP and butter production decreased by 6.1% and 3.5% respectively. EU cheese production increased by t in o Average EU farm gate milk prices rose to 36.7 c/kg in September 2017, which is 11% higher than the last 5 years' average, and the second best price for September (after year 2013) in the MMO records. Estimates point to a price stabilisation in October. The index on gross margins for milk production shows a sharp recovery since Q thanks to improved milk prices and lower operating costs. o With the exception of protein based products (SMP and whey powder), EU dairy product prices are well above medium term references. Butter prices have abruptly corrected from their record levels and have somewhat stabilised at around 530 /100 kg. EU SMP prices are below public intervention levels (152 /100 kg) but still some 14% higher than US prices. With short term fluctuations, the /$ ratio has remained stable on average in the last months, keeping a 12% /$ appreciation in o Public intervention stocks of SMP total t. This volume should increase following the t bought in in September. o The assessment of EU stock levels based on a residual approach (production + imports consumption - exports) shows atypical tight levels of SMP private stocks. Given supportive export demand there should be room for releasing public intervention stocks. Butter stocks remain short. Cheese stocks are normal in relation to demand levels. o Combined world milk production grew by 1.6% in Jan-Sep and by some 2% since May. The EU is leading the growth since Sep. The US maintains a steady increase though lower in autumn. NZ collection bounced back in October, peak month of the season. With an average demand growth of 1.5% the situation is becoming increasingly unbalanced. o Global exports have expanded this year (+6% in milk equivalent) but are below 2016 and 2015 since August. Asia remains as the main growth region. Demand in China has been higher than expected; increased domestic production has not prevented bigger imports. Food services are the main driver for cheese and butter consumption and imports in the US. The availability of public intervention might have impacted EU SMP exports in September, but they are expected to develop through the rest of the year. High prices have conditioned EU cheese exports in the last two months. Butter trade slows down due to high prices and low availability; still the EU has increased shipments to the US, China, Iran and UAE. o Retail consumption of liquid milk continues its structural decline. Volumes and prices for retail butter corroborate some scarcity this year but claims of shortage seem rather overstated. Cheese has performed better than most of other dairy categories this year. o The Commission presented annual milk production figures for Out of 168 million t milk production, 163 million t correspond to cow's milk. Deducting on-farm consumption, direct sales, feed use and losses, total deliveries amount to 153 million t. EU-N13 MS increased collection while diminished production. o Growing global milk production is causing some bearish market sentiment. Demand remains strong but is being outpaced by supply. A correction is therefore needed to address current imbalance and avoid stock build-up.
2 ANNEX 1 Milk Market Situation European Commission


3 Milk Market Situation Brussels, 28 November 2017
4 EU Milk deliveries Jan -2,0% Feb -4,8% Mar 0,3% Apr 0,7% May 0,4% Jun 1,7% Jul 1,7% Aug 2,1% Sep 3,7% Oct Nov Dec 28/11/2017
5 EU Productions 28/11/2017
6 EU Productions 28/11/2017!!! Data from some Member States are confidential and are NOT included in this table!!!
7 EU Productions 28/11/2017!!! Data from some Member States are confidential and are NOT included in this table!!!
8 EU Productions 28/11/2017!!! Data from some Member States are confidential and are NOT included in this table!!!
9 EU Productions 28/11/2017!!! Data from some Member States are confidential and are NOT included in this table!!!

10 EU Productions 28/11/2017

11 EU Productions 28/11/2017
12 28/11/2017
13 28/11/2017
14 28/11/2017
15 28/11/2017
16 28/11/2017
17 ANNEX 2 EU dairy products monthly stock estimates at the end of September 2017 EDA
18 EU dairy products monthly stock estimates at the end of September 2017 Milk Market Observatory Economic Board November 28 th, 2017
19 Methodology For each dairy product and each month, the stock estimates are based on the equation: Stock variation = EU production + EU import EU internal consumption EU exports ZMB balance sheets and forecasts have been used as references for : End of year stock levels Yearly consumption levels Monthly production statistics are based on ZMB Dairy World publications. Exports and imports figures are based on MMO website figures. The initial stocks entered in the model at the beginning of 2012 are : SMP: t Butter: t Cheese: t (arbitrary basis) The green parts in each graph mean that this stock level can be considered as normal for the month. The orange part means that this stock level can be considered as too high for the month These qualifications are based on the EDA analysts personal views and past market observations.
20
21
22
23 ANNEX 3 Perspectives from the Dairy Trade Eucolait
24 Perspectives from the Dairy Trade MMO Economic Board 28 November 2017
25 Outline Global Supply Global exports & demand Developments in key import markets Conclusions

26 Milk production in key export regions

27 Milk production in key export regions
28 Production outlook EU milk production is firmly back in growth mode (+3,9% in September; +0,6% Jan-Sept) led by PL, IE and now also DE, FR, encouraged by high milk prices & favourable weather. Outlook for 2017: +0,7%, Outlook 2018: +1% NZ milk collection bounced back in October with +2,7%; season to date (Jun- Oct) +0,9%. Moderate increase expected for the 2017/18 season Australia s milk production up in October by +6,7%, season to date (Jul-Oct): +2,7%, Outlook for current season: between +2% and +3% (Dairy Australia) US milk collections only +1,4% in October with strong regional differences (Outlook for 2017: +1,6%, 2018: lowered to +1,8% (USDA) Recovering milk production in South America in 2017 due to improved climatic conditions and rising milk prices in most areas Global milk production expected to increase by 1,5% in However the current rate of (monthly) growth is about + 2%

29 Dairy exports of main market players in ME


30 Main EU export markets for all dairy products (in value - ) Jan-Sep 2015 Jan-Sep 2016 Jan-Sep 2017
31 Cheese trade EU cheese exports: Growth rate Jan-Sep 17/16: +5,0% Combined cheese exports: Growth rate Jan-Sep 17/16: +2,5%


32 Butter trade EU butter exports: Growth rate Jan-Sep 17/16: -17,3% Combined butter exports: Growth rate Jan-Sep 17/16: -16,2%

33 SMP trade EU SMP exports: Growth rate Jan-Sep 17/16: +40,4% Combined SMP exports: Growth rate Jan-Sep 17/16: +10,4%

34 WMP trade EU WMP exports: Growth rate Jan-Sep 17/16: +4,0% Combined WMP exports: Growth rate Jan-Sep 17/16: -9,4%

35 Whey powder trade EU whey powder exports: Growth rate Jan-Sep 17/16: +0,6% Combined whey powder exports: Growth rate Jan-Sep 17/16: -2,6%

36 Trade of milk EU milk exports: Growth rate Jan-Sep 17/16: -2,8% Combined milk exports: Growth rate Jan-Sep 17/16: -19,8%
37 Trade of cream EU cream exports: Growth rate Jan-Sep 17/16: +21,7% Combined cream exports: Growth rate Jan-Sep 17/16: +17,6%

38 Infant formula trade EU infant formula exports: Growth rate Jan-Sep 17/16: +13,5% Combined infant formula exports: Growth rate Jan-Sep 17/16: +7,5%

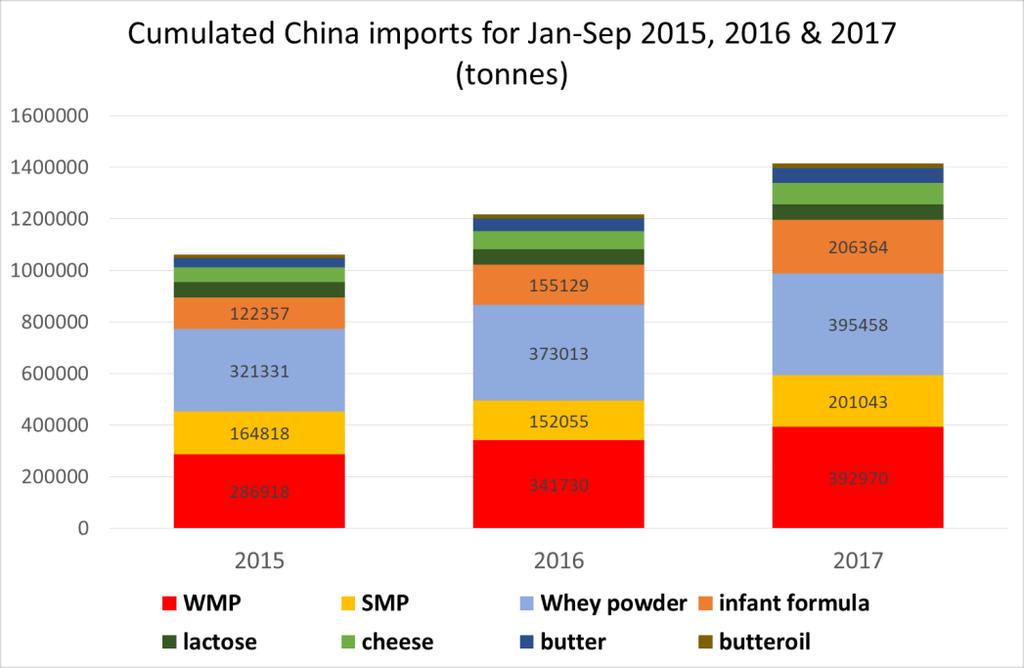
39 China imports

40 USA imports

41 Japan imports

42 Mexico imports

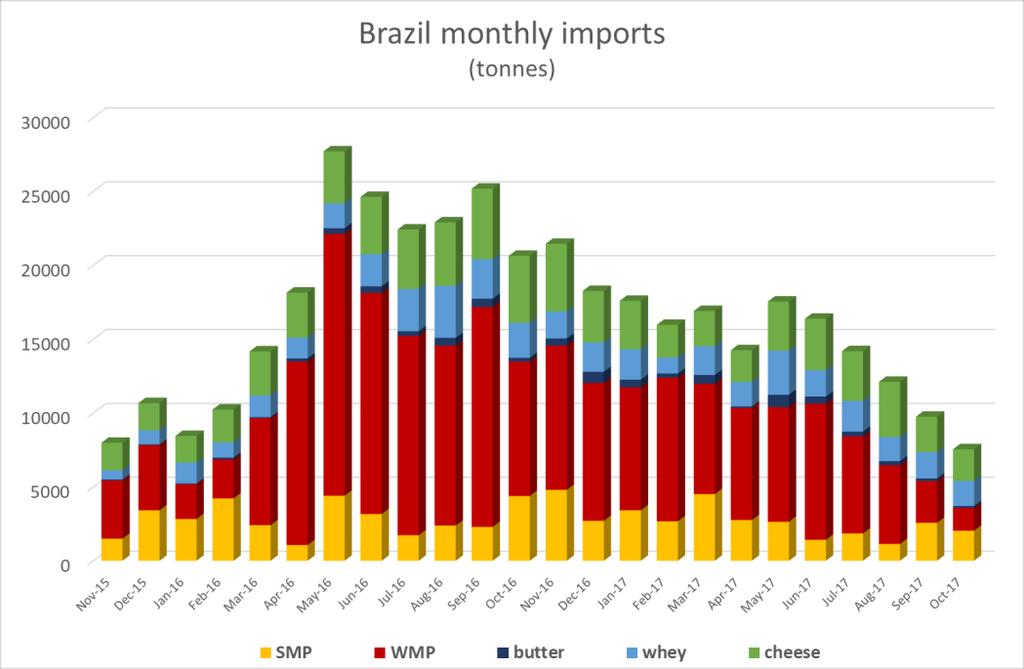
43 Brazil imports

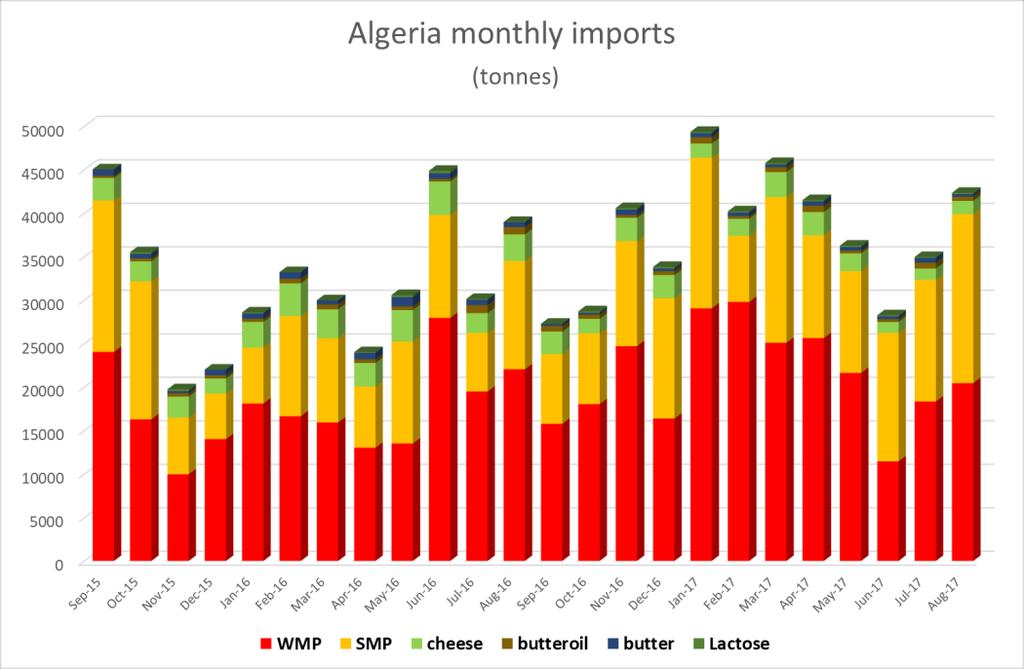
44 Algeria imports

45 Egypt imports
46 Conclusions Growing global milk production is causing increasingly bearish market sentiment Global trade has expanded further in 2017 and demand remains supportive overall, with Asia being the main growth region Exceptionally strong SMP exports at very low prices. Market direction will depend on the management of intervention stocks which limit any significant upward potential Butter prices corrected and have stabilised at historically high levels. Buyers are still holding off at current prices. EU cheese exports and domestic demand have kept the market reasonably well in balance but the ever increasing production has put considerable pressure on prices. The lower prices could again stimulate export demand. WMP demand remains sluggish despite strong Chinese & Algerian imports Growing pressure to further increase exports which are however challenged by increased competition (mainly from the US) and a still strong Euro Supply side correction needed to address current imbalance between supply & demand and to avoid stock build
47 - Thank you for your attention -
48 ANNEX 4 Trends in sales of Milk & Dairy products a retail perspective EuroCommerce


49 TRENDS IN SALES OF MILK & DAIRY PRODUCTS A RETAIL PERSPECTIVE Milk Market Observatory 28 November 2017
50 Belgium Consumer price index Product Oct 17 vs Oct 16 Total 2017 vs total 2016 Whole milk 1.8% -6.4% Semi-skimmed milk 5.7% -3.8% Concentrated milk, powdered milk 4.7% 4.5% Yogurt 3.6% 0.5% Butter 28.6% 18.6% Source: SPF Economie (2017) 2
51 Belgium Total FMCG Oct 2017 Total YTD 2017 Volume % change Value % change Price % change Volume % change Value % change Price % change Dairy Source: Nielsen ScanTrack 3
52 France Period ending 29 October 2017 Product category Volume (% change) 4 weeks period (P11 16/P11 17) Volume (% change) Year on year (P11 15-P11 16 / P11 16 P11 17) Price (% change) 4 weeks period (P11 16/P11 17) Price (% change) Year on year (P11 15-P11 16 / P11 16 P11 17) Total liquid milk +1,6% -3,8% +1,6% +1,4% Of which UHT semi-skimmed milk Yoghurt & fresh cheese -3,8% -6,4% +0,7% +0,7% -1,5% -1,8% +1,3% -0,1% Butter +14,0% -0,8% +15,9% +5,3% Cream +0,1% -1,5% +5,4% +1,1% Cheese -1,6% +0,3% +2,5% +0,8% Source: Kantar World Panel via FranceAgriMer (Min. de l Agriculture) 4

53 France Sales of organic versus conventional milk & dairy products Organic milk & dairy products Organic dairy products sales have continued to increase. The increase is recorded for every product, except for liquid milk. This decrease is due to the supply shortage in France. 40% Consumption of organic versus conventional milk & dairy products % in volume, year to year 52 weeks 29/10/2017 Organic Conventional Organic market shares (% vol. 29/10/2017) 20% 16.8% 21.8% 25.0% Liquid milk 7.1% 9.7% 7.1% Yogurts 3.9% 0.2% Butter Cream Fresh cheese 1.2% 1.8% 3.7% 0% -8.6% -3.4% -2.7% -4.3% -1.1% -2.1% Cheese 0.6% 0% 2% 4% 6% 8% -20% Liquid milk Yoghurt Fresh cheese Butter Cream Cheese Source: Kantar World Panel via FranceAgriMer (Min. de l Agriculture) 5
54 France Butter market The shortage in France has been complemented by a panicking rush by consumers to stock up in the past few weeks. The situation is expected to improve considerably and return to normality over the next few weeks. 6
55 Italy Period: 2016 vs Product category VOLUME (2016 vs % change) VOLUME Q vs Q VALUE (2016 vs % change) VALUE Q vs Q Fresh milk -3,5% -0,4% -4,4% -1,7% UHT milk -3,1% -3,2% -6,8% -6,1% Yoghurt +0,7% 0,0% -1,0% -1,8% Fresh cheese (1) +1,0% +0,9% -1,7% -1,6% Fresh dessert +4,2% +7,2% +3,2% +4,5% Cheese (1) +2,2% +2,7% +0,03% +1,1% Source: Market Track Nielsen (1) Peso imposto 7
56 Italy Period: YTD Sept17 e Q Product category VOLUME (YTD Sept17 vs. YTD Sept16 % change) VOLUME (Q vs Q % change) VALUE (YTD Sept17 vs. YTD Sept16 % change) VALUE (Q vs Q % change) Fresh milk -4,4-3,3-1,2 0,7 UHT milk -1,5-0,4 0,3 4,0 Fresh cheese (1) 1,0 1,3 1,9 3,4 Cheese (1) 1,7 1,3 3,3 4,4 Fresh dessert 1,8-0,6 3,0 2,7 Dessert -2,1-4,0-5,6-6,1 Butter -6,4-4,7 7,1 19,3 Béchamel / Cream -1,7-1,0-1,0 2,4 Yoghurt -0,7 0,9-1,2 1,3 Source: Market Track Nielsen (1) Peso imposto 8
57 Italy Period: YTD Sept17 vs. YTD Sept16 Source: Market Track Nielsen * Peso imposto 9
58 Italy Period: Q vs. Q Source: Market Track Nielsen * Peso imposto 10
59 Portugal Period ending 8 October 2017 Product category Volume (% change, year-to-date) Volume (% change, year-on-year) Value (% change, year-to-date) Value (% change, year-on-year) Fresh milk -10,3-10,8-10,4-11,0 UHT milk -3,0-3,9 0,5-0,2 Yoghurt -3,8-4,3-3,5-3,1 Fresh cheese -0,5-0,9 0,6-0,1 Butter -2,0-1,7 4,5 3,6 UHT cream 0,0 0,9 2,2 2,4 Fresh dessert 2,0 3,2-1,4 1,9 Cheese 2,1 2,7 4,1 3,9 Source: Nielsen 11
60 Spain Period ending September 2017 Product category Volumes (% change Sept 2017 vs Sept 2016) Volumes (% change YTD Sept 2017) Value (% change Sept 2017 vs Sept 2016) Value (% change YTD Sept 2017) Price (% change Sept 2017 vs Sept 2016) Price (% change YTD Sept 2017) Standard liquid milk Other types of milk Milkshakes Yoghurts and fermented milk -2.5% -4.1% -2.2% -..1% +0.3% -0.5% +5.9% +5.8% +3.4% +1.2% -2.4% -4.3 % -1.6% +0.5% +0.3% +3.6% +2.0% +3.1% +0.6% 0.7% -1.0% -1.7% -1.6% -2.3% Fresh desserts +0.6% -3.0% +1.0% -2.1% +0.4% +0.9% Fresh cheese Local, traditional cheese 12 Processed cheese -1.5% -2.0% 1.3% -1.3% +2.9 % +0.7% +3.6% +2.4% +6.9% +4.0% +3.2% +1.5% +1.5% +0.3% +1.7% +1.5% +0.2% +1.1%
61 Spain Period ending September 2017 Product category Volumes (% change Sept 2017 vs Sept 2016) Volumes (% change YTD Sept 2017) Value (% change Sept 2017 vs Sept 2016) Value (% change YTD Sept 2017) Price (% change Sept 2017 vs Sept 2016) Price (% change YTD Sept 2017) Grated cheese +8.6% +4.7% +11.1% +6.8% +2,3% +2.0% Other types of cheese +7.9% +6.2% +9.3% +6.6% +1.3% +0.4% Cream +3.0% 1.0% +8.1% +3.6% +5.0% Butter +15.3% +12.7% +29.9% +17.7% +12.6% +4.5% +2.6 % Desserts and long-term conservation yoghurt Non-liquid milk Total dairy products +6.7% +3.2% +6.0% +13.2% +6,1% +9.7% +0.5% -1.8 % -2,6% -6.0% -3.1% -4.3% +0.1% -1.0 % +2.1% 0.2% +2.0% +1.1% 13
62 Spain Source: Nielsen and FeNIL 14
63 Spain Source: Nielsen and FeNIL 15
64 Spain Total liquid milk Dairy products Cheese Volume (000s l) 2016 Variation 2016 vs 2015 Value ( 000s) 2016 Variation 2016 vs 2015 Consumption per capita 2016 Variation 2016 vs , , , ,2% -0,6% +1,4% 2,261, ,762,868,60 2,597, % -0.6% +0.1% % 1.0% +3.1% 16 Source: Magrama
65 ANNEX 5 EU milk production and collection 2016 European Commission


66 EU milk production and collection 2016 Milk market observatory Andrea Čapkovičová DG Agriculture and Rural Development European Commission
67 Foreword Final 2016 milk production figures Obligation of MS to send data to Eurostat = end of September (IE still missing) In 2016, for the EU-28: whole milk production = Mt cow milk production = Mt cow milk collection = Mt EU-28 milk use (2016) Farm use, incl. losses = 4.1 Mt Feed use = 3.5 Mt Direct sales = 2.1 Mt Deliveries = Mt Production vs collection figures All the milk produced on farms is not collected: - Consumption on farm, direct sales, feed use, losses Not all the milk produced in country X is delivered to a dairy in country X - With the end of the quota system, direct cross-border milk collection increased (no use any more of sister companies) Only production figures give an accurate picture on the amount of milk produced by MS 2
68 Cow milk production by MS (Mt) Source: Eurostat 3
69 Production goes down in the EU-N13, while deliveries go up 12% 10% Annual change in cow milk production and collection, 2016/2015 8% 6% 4% 2% 0% -2% -4% -6% -8% Cow milk production Collection Source: Eurostat 4
70 The share of the milk produced which is collected in the EU-N13 is growing steadily 100 Collection/cow milk production (%) EU-28 EU-15 EU-N13 Source: Eurostat 5
71 110 but differences between MS still noticeable Collection/cow milk production (%, 2016) Source: Eurostat 6


72 Thank you Short-term outlook Medium-term outlook EU agricultural outlook conference EU Milk Market Observatory 7
TRENDS IN SALES OF MILK & DAIRY PRODUCTS A RETAIL PERSPECTIVE. Milk Market Observatory 26 September 2017
 TRENDS IN SALES OF MILK & DAIRY PRODUCTS A RETAIL PERSPECTIVE Milk Market Observatory 26 September 2017 Belgium Product August 2017 vs. August 2016 Consumer Price Index Total 2016 vs. 2015 Consumer Price
TRENDS IN SALES OF MILK & DAIRY PRODUCTS A RETAIL PERSPECTIVE. Milk Market Observatory 25 January 2017
 TRENDS IN SALES OF MILK & DAIRY PRODUCTS A RETAIL PERSPECTIVE Milk Market Observatory 25 January 2017 France Period ending 25 December 2016 Product category ) 4 weeks period (P13 15/P13 16) ) Year on year
World Dairy Situation. IDF SC DPE, Paris April 11, 2013
 World Dairy Situation IDF SC DPE, Paris April 11, Current dairy situation Dairy production progressed in 2012 in supplying regions but is now stabilizing, even declining in some countries Export demand
For personal use only
 SEPTEMBER 216 GLOBAL DAIRY UPDATE European milk production has decreased for the first time since early 215, with volumes in June down 2 compared to last year. Last week we announced our annual results,
GLOBAL DAIRY UPDATE KEY DATES MARCH 2017
 MARCH 2017 GLOBAL DAIRY UPDATE European milk production decreased for the seventh consecutive month, while the US remains strong. The rate of decline in New Zealand production is easing. US exports continue
QUARTERLY REVIEW OF THE PERFORMANCE OF THE DAIRY INDUSTRY 1
 QUARTERLY REVIEW OF THE PERFORMANCE OF THE DAIRY INDUSTRY 1 The information in this document is from sources deemed to be correct. Milk SA, the MPO and SAMPRO are not responsible for the results of any
GPS Leaders Conference: Global Dairy & Milk Protein Opportunities November 2016
 GPS Leaders Conference: Global Dairy & Milk Protein Opportunities November 2016 2 If this can happen..anything can happen! 3 Topics covered + Hoogwegt Organization + US Dairy Export Update + Global Trends
TRENDS IN SALES OF MILK & DAIRY PRODUCTS A RETAIL PERSPECTIVE. Milk Market Observatory 28 March 2017
 TRENDS IN SALES OF MILK & DAIRY PRODUCTS A RETAIL PERSPECTIVE Milk Market Observatory 28 March 2017 Belgium Product February 2017 vs. February 2016 Consumer Price Index Whole milk -9,15% Semi-skimmed milk
Record exports in coffee year 2017/18
 Record exports in coffee year 2017/18 Total coffee exports increased each year since 2010/11 with a new record reached in 2017/18 at 121.86 million bags, 2% higher than 2016/17. In the twelve months ending
Coffee market ends 2016/17 coffee year in deficit for the third consecutive year
 Coffee market ends 2016/17 coffee year in deficit for the third consecutive year The ICO composite indicator continued its downward trend that started at the end of August, averaging 124.46 US cents/lb.
Overview of the Manganese Industry
 39th Annual Conference Istanbul, Turkey 2013 Overview of the Manganese Industry International Manganese Institute Alberto Saavedra Market Research Manager June, 2013 Introduction Global Production Supply,
Record exports from Brazil weigh heavy on the coffee market
 Record exports from Brazil weigh heavy on the coffee market Coffee exports from Brazil reached a record high of 36.8 million bags in crop year 2014/15 (April to March), fuelled by domestic stocks and encouraged
Global Considerations
 What Does Being a Global Player Mean to the U.S. Dairy Sector? Global Considerations 2 1 A Decade of Change $8, 4,5 $7, 4, (Million $) $6, $5, $4, $3, $2, $1, 3,5 3, 2,5 2, 1,5 1, 5 (Million Lbs.) $ 23
Milk and Milk Products: Price and Trade Update
 Milk and Milk Products: Price and Trade Update June 217 * International dairy prices The FAO Dairy Price Index averaged 29 points in June, up 16 points (8.3 percent) from January 217 and 71 points (51.5
World coffee consumption increases but prices still low
 World coffee consumption increases but prices still low The coffee market stabilised slightly in February, but prices remain at very low levels. A lack of news regarding fundamentals with expectations
Record Exports for Coffee Year 2016/17
 Record Exports for Coffee Year 2016/17 Total exports in September 2017 reached 8.34 million bags, compared to 9.8 million in September 2016. While coffee year 2016/17 registered a decrease in its final
July marks another month of continuous low prices
 July marks another month of continuous low prices In July 2018, the ICO composite indicator price decreased by 2.9% to an average of 107.20 US cents/lb, which is the lowest monthly average for July since
Dairy Market R E P O R T
 Volume 18 No. 12 Dairy Market R E P O R T D e c e m b e r 2 0 1 5 DMI NMPF Overview The U.S. average all-milk price, which spent seven months of 2015 hovering around $16.70 per hundredweight, has moved
Coffee market settles lower amidst strong global exports
 Coffee market settles lower amidst strong global exports The ICO composite indicator price declined by 1.2% in February 2018 to an average of 114.19 US cents/lb. Indicator prices for all three Arabica
Coffee prices rose slightly in January 2019
 Coffee prices rose slightly in January 2019 In January 2019, the ICO composite indicator rose by 0.9% to 101.56 US cents/lb as prices for all group indicators increased. After starting at a low of 99.16
much better than in As may be seen in Table 1, the futures market prices for the next 12 months
 Dairy Outlook December 2009 By Jim Dunn Professor of Agricultural Economics, Penn State University Market Psychology prices are higher than last month, especially Class IV. The outlook for dairy prices
Dairy Market. November 2017
 Dairy Market Dairy Management Inc. R E P O R T Volume 20 No. 10 November 2017 DMI NMPF Overview U.S. Cheddar cheese prices hit a 10-month high in October, while butter prices softened but remained well
Coffee market ends 2017/18 in surplus
 Coffee market ends 217/18 in surplus World coffee production in coffee year 217/18 is estimated 5.7% higher at 164.81 million bags as output of Arabica increased by 2.2% to 11.82, and Robusta grew 11.7%
Downward correction as funds respond to increasingly positive supply outlook
 Downward correction as funds respond to increasingly positive supply outlook Coffee prices fell sharply at the end of April as institutional investors sold off their positions. The coffee market continues
Dairy Outlook. December By Jim Dunn Professor of Agricultural Economics, Penn State University. Market Psychology
 Dairy Outlook December 2015 By Jim Dunn Professor of Agricultural Economics, Penn State University Market Psychology The Class III market has taken a beating lately as cheese prices have drifted down and
What Does Being a Global Player Mean to the U.S. Dairy Sector?
 What Does Being a Global Player Mean to the U.S. Dairy Sector? Global Considerations Copyright of Daily Dairy Report, Inc. 2 A Decade of Change $8,000 4,500 $7,000 4,000 (Million $) $6,000 $5,000 $4,000
2018/19 expected to be the second year of surplus
 2018/19 expected to be the second year of surplus Coffee year 2018/19 is expected to be the second consecutive season of surplus, as global output, estimated at 167.47 million bags, exceeds world consumption,
Outline. o Global Dairy Overview o U.S Milk Production o Dairy Product Production, Stocks, Trade o Outlook 12/7/2016
 Outline o Global Dairy Overview o U.S Milk Production o Dairy Product Production, Stocks, Trade o Outlook 2 1 A View From Abroad Germany 1983 2 Germany 1983 Japan 1984 3 Japan 1984 Kobe Cow Calf Show 4
Prices for all coffee groups increased in May
 Prices for all coffee groups increased in May In May 2018, the ICO composite indicator increased by 0.7% to an average of 113.34 US cents/lb, following three months of declines. Prices for all coffee groups
Coffee market remains volatile but lacks direction
 Coffee market remains volatile but lacks direction Prices fluctuated significantly during August, with the ICO composite indicator dropping by 10 cents before jumping back up another 12 cents by the end
MONTHLY COFFEE MARKET REPORT
 E MONTHLY COFFEE MARKET REPORT February 2014 February 2014 has seen significant developments in the coffee market, with prices shooting upwards at a startling rate. The ICO composite daily price has increased
Coffee prices maintain downward trend as 2015/16 production estimates show slight recovery
 Coffee prices maintain downward trend as 2015/16 production estimates show slight recovery The coffee market fell again in December 2015, reaching its second lowest monthly average of the year. This decrease
U.S. exported 16.6% of its milk production (TSB) in September YTD volumes +15% vs. prior year: PAGE 5. MIDDLE EAST/ NO. AFRICA $581 m, +65%
 in September YTD volumes +15% vs. prior year: PAGE 5. MIDDLE EAST/ NO. AFRICA $581 m, +65%") U.S. exported 16.6% of its milk production (TSB) in September YTD volumes +15% vs. prior year: PAGE 5 U.S. Exports NDM/SMP...2 Cheese...2 Butterfat...2 Whey Products...3 Lactose...4 WMP...4 Food Preps
U.S. exported 16.6% of its milk production (TSB) in September YTD volumes +15% vs. prior year: PAGE 5 U.S. Exports NDM/SMP...2 Cheese...2 Butterfat...2 Whey Products...3 Lactose...4 WMP...4 Food Preps
Networkers Business Update. December 2014
 Networkers Business Update December 2014 Agenda Forecast Milk Price Global markets V3 Strategy Growing our share of New Zealand milk Page 2 Forecast Milk Price 110 100 2012/13 2013/14 2014/15 Forecast
Dairy Market. Overview. Commercial Use of Dairy Products. U.S. Dairy Trade
 Dairy Market Dairy Management Inc. R E P O R T Volume 21 No. 5 May 2018 DMI NMPF Overview Many of the key dairy market statistics reported for March and April indicated that milk prices for U.S. dairy
MONTHLY COFFEE MARKET REPORT
 E MONTHLY COFFEE MARKET REPORT June 2013 Coffee prices fell sharply in June 2013, as market fundamentals, combined with an uncertain macroeconomic outlook, drove the ICO composite indicator price to its
Price monitoring of key food items in Donetsk and Luhansk Oblasts
 Market update Issue (October ) UKRAINE Price monitoring of key food items in Donetsk and Luhansk Oblasts Fighting hunger worldwide Highlight Cost of food basket remained higher at national level throughout
STATE OF THE VITIVINICULTURE WORLD MARKET
 STATE OF THE VITIVINICULTURE WORLD MARKET April 2018 1 Table of contents 1. VITICULTURAL PRODUCTION POTENTIAL 3 2. WINE PRODUCTION 5 3. WINE CONSUMPTION 7 4. INTERNATIONAL TRADE 9 Abbreviations: kha: thousands
MONTHLY COFFEE MARKET REPORT
 1 E MONTHLY COFFEE MARKET REPORT March 2014 Ongoing uncertainty over the Brazilian coffee crop has caused significant fluctuations in coffee prices during March, with monthly volatility of the International
GLOBAL DAIRY UPDATE KEY DATES FEBRUARY Continued strong import demand for dairy in China. Latin America and Asia imports decrease.
 FEBRUARY 2018 GLOBAL DAIRY UPDATE Continued strong import demand for dairy in China. Latin America and Asia imports decrease. Fonterra and The a2 Milk Company form comprehensive strategic relationship.
Coffee Season 2013/14 Finishes in Balance but Deficit Expected Next Year
 Coffee Season 2013/14 Finishes in Balance but Deficit Expected Next Year Coffee prices were volatile again over the course of September, mostly reacting to weather news from Brazil. Daily prices fell initially
Coffee market ends 2014 at ten month low
 Coffee market ends 2014 at ten month low Coffee prices continued to slide downwards in December 2014, with the monthly average of the ICO composite indicator at its lowest level since February. Recent
Dairy Market. May 2017
 Dairy Market Dairy Management Inc. R E P O R T Volume 20 No. 4 May 2017 DMI NMPF Overview The rate of milk production growth began to moderate during the first quarter, but additional milk production continues
MONTHLY COFFEE MARKET REPORT
 E MONTHLY COFFEE MARKET REPORT May 2014 After five consecutive months of rising prices, the coffee market reversed lower in May. From a high of 179 cents/lb in April, the daily price of the ICO composite
MARKET NEWSLETTER No 93 April 2015
 Focus on OLIVE OIL IMPORT TRENDS IN RUSSIA Russian imports of olive oil and olive pomace oil grew at a constant rate between 2/1 and 213/14 when they rose from 3 62 t to 34 814 t (Chart 1). The only exceptions
Growing divergence between Arabica and Robusta exports
 Growing divergence between Arabica and Robusta exports In April 218, the ICO composite indicator decreased by.4% to an average of 112.56, with the daily price ranging between 11.49 and 114.73. Prices for
LETTER FROM THE EXECUTIVE DIRECTOR
 E LETTER FROM THE EXECUTIVE DIRECTOR COFFEE MARKET REPORT December 2008 Price levels in December confirmed the downward trend recorded in the coffee market since September 2008. The monthly average of
Dairy Market. Overview. Commercial Use of Dairy Products
 Dairy Market Dairy Management Inc. R E P O R T Volume 19 No. 2 February 2016 DMI NMPF Overview U.S. milk production continues to grow at an annual rate of less than 1 percent, and domestic commercial use
Dairy sector: production and exports to Russia
 Dairy sector: production and exports to Russia Summary In 2013, the EU produced close to 153 million tonnes of milk, i.e. around 20% of the world production. Close to 40% of the production takes place
Coffee market continues downward trend
 Coffee market continues downward trend Since August 2017, the ICO composite indicator price has declined in each month except January 2018. The composite indicator decreased by 1.1% in March 2018 to an
Dairy Market R E P O R T
 Volume 18 No. 8 Dairy Market R E P O R T August 2015 DMI NMPF Overview Milk prices in many major milk-producing countries have plummeted to levels that are producing severe financial stress for their farmers.
Dairy Market. October 2016
 Dairy Market Dairy Management Inc. R E P O R T Volume 19 No. 10 October 2016 DMI NMPF Overview Milk prices continued a generally solid recovery from their late-spring low through August, when the U.S.
Outline. o Global Dairy Overview o U.S Milk Production o Dairy Product Production, Stocks, Trade o Outlook. Copyright 2017 Daily Dairy Report, Inc.
 Outline o Global Dairy Overview o U.S Milk Production o Dairy Product Production, Stocks, Trade o Outlook 2 Global Milk Production: Select Countries (in billion pounds) In Billion Pounds 21 67 216 333
Milk and Milk Products. Price and Trade Update. Weekly Newsletter. Milk and Milk Products. Price and Trade Update: April
 April Milk and Milk Products Price and Trade Update Weekly Newsletter Milk and Milk Products Price and Trade Update: April 1 PRICES: Remain depressed International dairy product prices began the year at
Dairy Market. Overview. Commercial Use of Dairy Products
 Dairy Market Dairy Management Inc. R E P O R T Volume 21 No. 6 June 2018 DMI NMPF Overview U.S. dairy markets received a one-two punch during the first weeks of June in the form of collateral damage from
STATE OF THE VITIVINICULTURE WORLD MARKET
 STATE OF THE VITIVINICULTURE WORLD MARKET April 2015 1 Table of contents 1. 2014 VITIVINICULTURAL PRODUCTION POTENTIAL 3 2. WINE PRODUCTION 5 3. WINE CONSUMPTION 7 4. INTERNATIONAL TRADE 9 Abbreviations:
THE GLOBAL PULSE MARKETS: recent trends and outlook
 THE GLOBAL PULSE MARKETS: recent trends and outlook CICILS/IPTIC 2004 CONVENTION 10-12 12 June 2004 Beijing, China Boubaker BENBELHASSEN Commodities and Trade Division United Nations Food and Agriculture
Cereals, Oilseeds and Protein Crops. Market Situation. CROPS Market Observatory 12 th April 2018
 Cereals, Oilseeds and Protein Crops Market Situation CROPS Market Observatory 12 th April 2018 CONTENTS EU market situation Cereals Oilseeds Protein crops Cereals EU Soft Wheat Exports and Imports (July-December)
China s Export of Key Products of Pharmaceutical Raw Materials
 China s Export of Key Products of Pharmaceutical Raw Materials During the period of the 62nd API China& INTERPHEX CHINA, China Pharmaceutical Industry Association released its annual Report on Analysis
Dairy Market. Overview. Commercial Use of Dairy Products. U.S. Dairy Trade
 Dairy Market Dairy Management Inc. R E P O R T Volume 19 No. 11 November 2016 DMI NMPF Overview Four straight months of rising milk prices and three straight months of falling feed costs have brought some
Dairy Market R E P O R T
 Volume 17 No. 5 Dairy Market R E P O R T May 2014 DMI NMPF Overview Many key milk and dairy product prices continued to set records in April. And while the dairy futures markets indicate that prices will
Export market trends and outlook
 Export market trends and outlook Much better! 28 th July 2017 Tim Hunt General Manager Food & Agribusiness Research Rabobank Food & Agribusiness Research Rabobank s unique global team of 90 analysts supporting
Dairy Market. July The U.S. average all-milk price rose by $0.20 per hundredweight in May from a
 Dairy Market Dairy Management Inc. R E P O R T Volume 20 No. 6 July 2017 DMI NMPF Overview The U.S. average all-milk price rose by $0.20 per hundredweight in May from a month earlier, and the June federal
GLOBAL DAIRY UPDATE. Welcome to our March 2015 Global Dairy Update IN THIS EDITION Financial Calendar
 GLOBAL DAIRY UPDATE Welcome to our ch 2015 Global Dairy Update IN THIS EDITION Fonterra milk collection New Zealand 7% lower in ruary 2015 and 1.5% higher for the season to date Australia 4% higher in
Dairy Market. May 2016
 Dairy Market R E P O R T Volume 19 No. 5 May 2016 DMI NMPF Overview Increased production per cow and expectations for additional milk production growth is dampening the outlook for milk prices for the
Dairy Market. April 2016
 Dairy Market Dairy Management Inc. R E P O R T Volume 19 No. 4 April 2016 DMI NMPF Overview Dairy market developments during the first part of April brought slight improvements in the outlook for milk
Volatility returns to the coffee market as prices stay low
 Volatility returns to the coffee market as prices stay low Daily coffee prices hit their lowest level in 19 months during August, as commodity markets worldwide were negatively affected by currency movements
Coffee market recovers slightly from December slump
 Coffee market recovers slightly from December slump After reaching its lowest level in 22 months in December 2017, the monthly average of the ICO composite indicator price increased by 1.4% to 115.60 US
Corn and Soybean CORN OUTLOOK SOYBEAN OUTLOOK STATISTICS AND ANALYSIS
 Corn and Soybean CORN OUTLOOK SOYBEAN OUTLOOK STATISTICS AND ANALYSIS CLAL (and its officers, employees and auxiliary persons) shall not be liable to clients, web users or anyone else for any loss or injury
GLOBAL DAIRY UPDATE KEY DATES DECEMBER 2017
 DECEMBER 2017 GLOBAL DAIRY UPDATE Demand for dairy remains strong in China and Asia. Middle East and Africa and Latin America imports decline. Dairy exports from New Zealand and the USA continue to decline.
Monthly Economic Letter
 Monthly Economic Letter Cotton Market Fundamentals & Price Outlook RECENT PRICE MOVEMENT After falling in the days surrounding the release of last month s USDA report, NY futures and the A Index were mostly
Fresh Deciduous Fruit (Apples, Grapes, & Pears): World Markets and Trade
: World Markets and Trade") Million MT United States Department of Agriculture Foreign Agricultural Service December 21 Fresh Deciduous Fruit (Apples, Grapes, & Pears): World Markets and Trade 21/11 Forecast: World Apple Trade Declines;
Million MT United States Department of Agriculture Foreign Agricultural Service December 21 Fresh Deciduous Fruit (Apples, Grapes, & Pears): World Markets and Trade 21/11 Forecast: World Apple Trade Declines;
Market Outlook GLOBAL DAIRY. WMP prices up since June U.S. WPC exports (p. 5) Milk production lower (p. 8)
 Milk production lower (p. 8)") U.S. exports (MT, Jan-Sep): NDM/SMP 349,686 6% CHEESE 201,552 21% WHEY 358,424 8% BUTTERFAT 36,145-31% DETAILS, PAGE 3 November 26, 2012 Volume 16 No.6 GLOBAL DAIRY Market Outlook U.S. Dairy Export Council
U.S. exports (MT, Jan-Sep): NDM/SMP 349,686 6% CHEESE 201,552 21% WHEY 358,424 8% BUTTERFAT 36,145-31% DETAILS, PAGE 3 November 26, 2012 Volume 16 No.6 GLOBAL DAIRY Market Outlook U.S. Dairy Export Council
Welcome to our June 2014 Global Dairy Update
 Welcome to our June 2014 Global Dairy Update IN THIS EDITION Fonterra Milk Collection: New Zealand 8% higher and Australia 2% lower to 31 May 2014 Business Update: Minimum Shareholding requirements for
Market Outlook GLOBAL DAIRY. Whey prices supported U.S. NDM/SMP exports (p. 4) Milk production flat (p. 8)
 Milk production flat (p. 8)") U.S. exports (MT, Jan-Aug): NDM/SMP 316,059 9% CHEESE 183,189 21% WHEY 319,733 8% BUTTERFAT 34,531-31% DETAILS, PAGE 3 October 16, 2012 Volume 16 No.5 GLOBAL DAIRY Market Outlook U.S. Dairy Export Council
U.S. exports (MT, Jan-Aug): NDM/SMP 316,059 9% CHEESE 183,189 21% WHEY 319,733 8% BUTTERFAT 34,531-31% DETAILS, PAGE 3 October 16, 2012 Volume 16 No.5 GLOBAL DAIRY Market Outlook U.S. Dairy Export Council
Milk and Milk Products. Price and Trade Update: October
 October Milk and Milk Products Price and Trade Update Weekly Newsletter Milk and Milk Products Price and Trade Update: October 1 INTERNATIONAL PRICES: Weak import demand causes prices to fall International
Brazil Milk Cow Numbers and Milk Production per Cow,
 TABLE OF CONTENTS 1. Brazil 1.1. Brazil Milk Market Introduction 1.1.1. Brazil Cow Milk Market Production and Fluid Milk Consumption by Volume, 1.1.2. Brazil Milk Cow Numbers and Milk Production per Cow,
OUR POTENTIAL. Business Update MAY 2017
 OUR POTENTIAL Business Update MAY 2017 Disclaimer This presentation may contain forward-looking statements and projections. There can be no certainty of outcome in relation to the matters to which the
EMBARGO TO ON FRIDAY 16 SEPTEMBER. Scotch Whisky Association. Exports of Scotch Whisky; Year to end of June 2016 (2016 H1)
") EMBARGO TO 00.01 ON FRIDAY 16 SEPTEMBER Scotch Whisky Association Exports of Scotch Whisky; Year to end of June 2016 (2016 H1) VOLUME UP 3.1% to 531 MILLION bottles VALUE DOWN SLIGHTLY BY 1.0% TO 1.70
EMBARGO TO 00.01 ON FRIDAY 16 SEPTEMBER Scotch Whisky Association Exports of Scotch Whisky; Year to end of June 2016 (2016 H1) VOLUME UP 3.1% to 531 MILLION bottles VALUE DOWN SLIGHTLY BY 1.0% TO 1.70
Dairy Market. June 2016
 Dairy Market Dairy Management Inc. R E P O R T Volume 19 No. 6 June 2016 DMI NMPF Overview U.S. milk production was 1.2 percent higher in April than a year earlier, interrupting the pattern of the three
Soybean Oil and Palm Oil Account For An Increasing Share of World Vegetable Oil Consumption
 United States Department of Agriculture Foreign Agricultural Service Circular Series FOP 01-03 January 2003 Soybean Oil and Palm Oil Account For An Increasing Share of World Vegetable Oil Consumption Percent
STANDARDIZED MILK PRICE CALCULATIONS for October 2018 deliveries 1,000,000 kg/yr.
 STANDARDIZED MILK PRICE CALCULATIONS for October 2018 deliveries 1,000,000 kg/yr. Prices in euro per 100 kg milk with 4.2% fat, 3.4% protein, 1,000,000 kg per year, tbc 24,999 and scc 249,999 per ml adjustments
Mango Retail Performance Report 2017
 Mango Retail Performance Report 2017 1 Table of Contents Pages 3-9 Pages 10-15 Pages 16-34 Pages 35-44 Pages 45-51 Pages 52-54 Executive Summary Fruit and Tropical Fruit Performance Whole Mango Performance
2017 U.S. DISTILLERS GRAINS EXPORTS
 217 U.S. DISTILLERS GRAINS EXPORTS 14, Annual U.S. Distillers Grains Exports 12, 12,695 1, 8, 6, 4, 2, 2,358 4,532 5,651 9,5 7,676 7,421 9,67 11,284 11,314 11,77 U.S. exports of distillers grains (DG)
% of Reference Price 190% Jan Feb Mar Apr May Jun Jul Aug Sep Oct Nov Dec Beef & Veal Production (E28 Slaughtering) - Tonnes
 - Tonnes") Trade Prices Production Production & Stocks DG AGRI DASHBOARD: BEEF AND VEAL Last update: 23.11217 Carcasse Live Animals 2.2% 9.3% -6.3% -4.% -1.9% -6.2% 5.2% /1 kg Tonnes cw /head /kg 14.2% 1.1% -1.7%
Trade Prices Production Production & Stocks DG AGRI DASHBOARD: BEEF AND VEAL Last update: 23.11217 Carcasse Live Animals 2.2% 9.3% -6.3% -4.% -1.9% -6.2% 5.2% /1 kg Tonnes cw /head /kg 14.2% 1.1% -1.7%
STANDARDIZED MILK PRICE CALCULATIONS for December 2016 deliveries
 STANDARDIZED MILK PRICE CALCULATIONS for December 2016 deliveries Prices in euro per 100 kg milk with 4.2% fat, 3.4% protein, 500,000 kg per year, tbc 24,999 and scc 249,999 per ml adjustments Company
GLOBAL DAIRY UPDATE KEY DATES MAY New Zealand production for the 2016/17 season (from 1 June 2016) is down 2% to the end of March.
 is down 2% to the end of March.") MAY 2017 GLOBAL DAIRY UPDATE New Zealand production for the 2016/17 season (from 1 June 2016) is down 2 to the end of March. US exports rate of growth is declining. New Zealand and Australia exports up
MAY 2017 GLOBAL DAIRY UPDATE New Zealand production for the 2016/17 season (from 1 June 2016) is down 2 to the end of March. US exports rate of growth is declining. New Zealand and Australia exports up
Monitoring EU Agri-Food Trade: Development until September 2018
 Monitoring EU Agri-Food Trade: Development until September 2018 September 2018: Slowdown in EU export performance; imports from Brazil and US still on the rise The monthly value of EU agri-food trade in
THIS REPORT CONTAINS ASSESSMENTS OF COMMODITY AND TRADE ISSUES MADE BY USDA STAFF AND NOT NECESSARILY STATEMENTS OF OFFICIAL U.S.
 THIS REPORT CONTAINS ASSESSMENTS OF COMMODITY AND TRADE ISSUES MADE BY USDA STAFF AND NOT NECESSARILY STATEMENTS OF OFFICIAL U.S. GOVERNMENT POLICY Required Report - public distribution Date: GAIN Report
Outline. Long-term Outlook for Cotton Consumption. World End-Use Consumption of Textile Fibers. World Consumption of Textile Fibers
 World Cotton Supply and Use International Cotton Advisory Committee Secretariat Outline! Long-term Outlook for Consumption! Outlook for /! Developments in World Cotton Trade Fifth Open Session: Cotton
The Changing Landscape of Dairy: A Regional Outlook. Mark Stephenson Director of Dairy Policy Analysis
 The Changing Landscape of Dairy: A Regional Outlook Mark Stephenson Director of Dairy Policy Analysis Millions of Pounds Let s remember when 32,000 30,000 28,000 Wisconsin Annual Milk Production It s the
Cultivation Pattern:
 Introduction: Cumin seed commonly know as Jeera (Cuminum cyminum) belongs to Apiacae family. Though Cumin is a native of Egypt, it now mostly produced in India. India is the largest producer and consumer
For personal use only
 DECEMBER 2016 GLOBAL DAIRY UPDATE New Zealand, Australia and Europe continue to see decreased milk production while United States growth is maintained. Solid growth in exports for the month across all
Monthly Economic Letter U.S. and Global Market Fundamentals
 Monthly Economic Letter U.S. and Global Market Fundamentals August 2012 www.cottoninc.com After trading within relatively narrow bands throughout July, New York futures moved higher in early August, with
Welcome to our May 2014 Global Dairy Update
 Welcome to our May 2014 Global Dairy Update IN THIS EDITION New Zealand milk volumes 8% higher and Australia 3% lower to 30 April 2014 Business Update: NZ Milk Products third quarter update Regulatory
SFR Condo Residential Lot Sales Inventory Sales Inventory Sales Inventory. Month YTD Month Month YTD Month Month YTD Month
 Grand Strand Market Report 2017 Grand Strand market activity took a slight step back in after 3 months of steady growth. SFR sales volume dropped 5.7% for the month but is still up 7.2% year-to-date. The
U.S. exported 15.5% of its milk production (TSB) in November YTD volumes +17% vs. prior year: PAGE 5. MIDDLE EAST/ NO. AFRICA $721 m, +78%
 in November YTD volumes +17% vs. prior year: PAGE 5. MIDDLE EAST/ NO. AFRICA $721 m, +78%") U.S. exported 15.5% of its milk production (TSB) in November YTD volumes +17% vs. prior year: PAGE 5 U.S. Exports NDM/SMP...2 Cheese...2 Butterfat...2 Whey Products...3 Lactose...4 WMP...4 Food Preps (Blends)...4
U.S. exported 15.5% of its milk production (TSB) in November YTD volumes +17% vs. prior year: PAGE 5 U.S. Exports NDM/SMP...2 Cheese...2 Butterfat...2 Whey Products...3 Lactose...4 WMP...4 Food Preps (Blends)...4
Monitoring EU Agri-Food Trade: Development until March 2018
 Monitoring EU Agri-Food Trade: Development until March 2018 14.000 EU28: Export to Extra-EU of Agri-Food Products 13.000 12.000 11.000 10.000 2018 2017 2015 2016 2014 9.000 8.000 7.000 6.000 Jan Feb Mar
World vitiviniculture situation
 World vitiviniculture situation Surface area Grape Wine Global grape production Production Consumption Trade 2016 FAO-OIV Focus: Table and Dried Grapes 2 Global area under vines Area under vines in the
ICC September 2018 Original: English. Emerging coffee markets: South and East Asia
 ICC 122-6 7 September 2018 Original: English E International Coffee Council 122 st Session 17 21 September 2018 London, UK Emerging coffee markets: South and East Asia Background 1. In accordance with