Situation Report on Selected Vegetables and Root Crops January-December 2008
|
|
|
- Betty Perkins
- 5 years ago
- Views:
Transcription


1 Republic of the Philippines Department of Agriculture BUREAU OF AGRICULTURAL STATISTICS Situation Report on Selected Vegetables and Root Crops uary-ember 2008 VOLUME 1 NO. 1 ch 2009
2 EXPLANATORY NOTES This situation report is based on the data on production, area harvested, prices and trade for the period uary to ember Nine (9) major vegetables and root crops namely mongo, peanut, cabbage, eggplant, tomato, garlic, onion, camote and cassava are covered in this report. These commodities are highlighted in the BAS quarterly report on the Performance of Agriculture. This issue also features malunggay. Production data are based on the results of the quarterly Crop Production Survey of BAS. Data on prices are sourced from the BAS Farm Price Survey (FPS) and the Integrated Agricultural keting Information System-Agricultural keting News Service (AGMARIS-AMNEWSS). Foreign trade statistics were obtained from the National Statistics Office (NSO) and organized by the Agricultural keting Statistics Analysis Division (AMSAD) of the BAS.
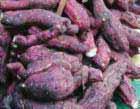
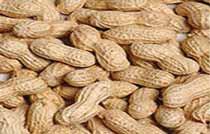
3 PRODUCTION Mongo. Production in uary to ember 2008 was estimated at 29,617 MT. There was a 1.89 percent increase from the 2007 production of 29,067 MT, despite the output declines of the major mongo producing regions by 3.61 percent in Ilocos and by percent in Western Visayas. The increase was attributed to the expansion in area planted in Cagayan Valley due to the availability of good seeds and early rainfall which prompted farmers to plant in rainfed areas during the third quarter. The use of seed inoculants by farmers in Central Luzon also contributed to the output growth. Peanut. Annual production went down by 3.07 percent from 31,205 MT in 2007 to 30,247 MT in The decrease was due to the decline in area in Ilocos, the country s leading peanut producer, as farmers shifted to yellow corn and stringbeans. Moreover, farmers in Cagayan Valley shifted to corn. The frequent heavy rainfall adversely affected area planted in the rest of the peanut producing regions. Metric Tons Figure 1a. Production of Major Vegetables and Root Crops, Philippines, uary-ember , , ,000 80,000 60,000 40,000 20,000 0 Mongo Peanut Cabbage 2006 Cabbage. Annual production for 2008 reached 128,863 MT. This exceeded the previous year s output of 123,443 MT by 4.39 percent. This increment was the result of additional harvests from the newly opened areas planted to cabbage in CAR. There were also reported expansion in area harvested in Central Visayas, Northern Mindanao and Davao regions. Lower incidence of pests and diseases and good rainfall pattern favored production in these regions. 1
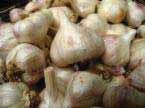
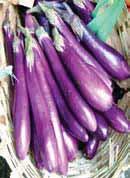
4 Eggplant. In 2008, total output of eggplant farms in the country was recorded at 199,579 MT. This was lower by 5.03 percent compared to the 2007 output of 210,156 MT. Production in Ilocos region which accounted for percent of the total production, recorded a percent decrease from its 2007 level. The reduction can be traced to cutback in area planted because farmers opted to plant corn. The effect of heavy rains brought about by typhoon Cosme during the 2 nd quarter also affected eggplant production in the other regions. Tomato. The 2008 production at 195,810 MT was higher by 3.73 percent compared to the 2007 output. The output gain was due to the significant growth by 21.0 percent in Northern Mindanao which was the result of increased harvested areas in Bukidnon, Misamis Oriental and Misamis Occidental, in addition to good buying prices by traders. The sustained use of high yielding varieties such as Maguillas, Ilocos Red and Apollo improved production in Ilocos, as well. Metric Tons Figure 1b. Production of Major Vegetables and Root Crops, Philippines, uary-ember , , , ,000 50,000 0 Eggplant Tomato Garlic 2006 Farmers in CALABARZON were encouraged to grow tomato during 2008 because of the continued technical support from the Sentrong Pamilihan ng Producktong Agrikultural ng Quezon Foundation Incorporated (SPPQFI) in Quezon. Garlic. There was a 0.56 percent increase in garlic production, from 11,285 MT in 2007 to 11,348 MT in This was largely due to the 7.16 percent increase in MIMAROPA production. There were reports in the region of shifting from onion to garlic. 2
5 Onion. Total onion output from uary to ember 2008 at 128,923 MT was lower by percent compared to the 2007 level of 146,108 MT. Of the total production, Bermuda or Red Creole variety contributed 71.0 percent or 91,527 MT. Native variety contributed 29.0 percent or 37,396 MT. Both Bermuda and native onion production declined by 14.0 percent and 4.0 percent, respectively, from their levels in reases in outputs in the majority of producing regions were due to decline in area planted. This was brought about by shifting to other crops such as yellow corn and ampalaya in Ilocos. The early onset of rainfall in Central Luzon was another contributing factor. Camote. From 573,734 MT in 2007, camote or sweet potato production went down to 572,655 MT in Eastern Visayas, the top producer, experienced a 1.0 percent drop in 2008 output compared with the previous year due to excessive water 31 from frequent heavy rainfall. Lower production was also observed in other camote major producing areas of CALABARZON, Western and Central Visayas regions. Metric Tons Figure 1c. Production of Major Vegetables and Root Crops, Philippines, uary-ember, ,500,000 2,000,000 1,500,000 1,000, ,000 0 Onion Camote Cassava 2006 Cassava. In 2008, cassava production was 1,941,537 MT, up by 3.76 percent from 1,871,138 MT. The increment in output was attributed to the continued expansion in area planted to cassava in Northern Mindanao and ARMM. The other contributing factors were the availability of better quality and ample planting materials of cassava in Bicol; lower production costs and expansion of contract growing scheme in Northern Mindanao; and shifting from other cash crops such as mongo, peanut and ginger in ARMM. 3
6 AREA HARVESTED Area harvested with onion was reduced by 8.19 percent in 2008 compared with the 2007 level. Of the total area harvested of 14,579 hectares for onion, 70.0 percent were for Red Creole and 30.0 percent, for Native variety. Area harvested with peanut shrank by 5.63 percent, while areas harvested with camote and eggplant each decreased by about 3.0 percent. On the other hand, area harvested with mongo expanded by 1.5 percent and that for cabbage by 0.7 percent. Hectare Figure 2b. Area Harvested with Major Vegetables and Root Crops, Philippines, uary-ember ,000 15,000 10,000 5,000 0 Eggplant Tomato Garlic 2006 Figure 2c. Area Harvested with Major Vegetables and Root Crops, Philippines, uary-ember, Hectare Figure 2a. Area Harvested with Major Vegetables and Root Crops, Philippines, uary-ember , ,000 35,000 30,000 25,000 20,000 15,000 10,000 5,000 0 Mongo Peanut Cabbage 2006 Hectare 200, , ,000 50,000 0 Onion Camote Cassava
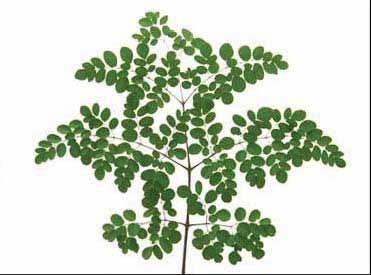
7 SPECIAL FEATURE Malunggay Known scientifically as Moringa Oleifera Lamk, malunggay is one of the world's most useful plants. ( It is called Malunggay in the Philippines, Sajina in the Indian Subcontinent, and Moringa or Horseradish in English. Malunggay is grown throughout the country. It is usually planted as a backyard vegetable and as a perimeter plant. It is a fast-growing plant and thrives in well-drained soils. This plant is characterized as low maintenance because it requires little care. Furthermore, it is resistant to drought. Seeds and stem cuttings are used for propagation. Many Asians use the leaves and fruits which are both very nutritious. They contain Vitamin C, minerals and other vitamins. For centuries, people in India, Philippines, Malaysia, and Thailand have been using the leaves and fruits as a part of their foods. In the Philippines, malunggay is also known as a miracle vegetable because of its medicinal value and other therapeutic functions. As food, malunggay is usually cooked with chicken as tinola, or with fish and other vegetables, mongo soup dishes, and blanched as salads. As medicine, malunggay promotes good eyesight, digestion, facilitates bowel movement, and is a cure for stomach ache. It is also used to cleanse wounds and ulcers. It helps alleviate scurvy, asthma, earache, and headaches. For its high calcium content, lactating mothers are advised to eat malunggay leaves to produce more milk. ( /frames/julytosept04/pg41.htm) Malunggay is now being eyed by the Department of Agriculture (DA) in the mitigation of malnutrition and poverty in the country. Also, under its biotechnology program, DA urged the planting of malunggay as a revenuegenerating industry. Moreover, it is now being looked into as a potential export product as a natural ingredient for cosmetics and pharmaceutical applications. 5
8 The data on production for malunggay are collected and reported separately as a fruit and as a leafy vegetable. In 2008, malunggay leaves production was estimated at 38,501.1 MT, higher by 2.4 percent from the 2007 level of 37,602.6 MT. The top three (3) producing regions and their contributions to the national total were: Western Visayas (18.6%), Northern Mindanao (15.1%), and Central Visayas (12.1%). On the other hand, the volume of malunggay fruit production reached 4, MT in 2008 from 4,878.9 MT in Ilocos region was the major producer of malunggay fruit because Ilocanos consider the fruit as a vegetable in their native dishes such as pinakbet. Production from the region was 4,519.7 MT, or 91.3 percent to the total output. Area harvested for malunggay fruit was estimated at hectares. This was 12.8 percent above the hectares in About 60.0 percent of this total area were from Ilocos region. Metric Tons Hectare 45,000 40,000 35,000 30,000 25,000 20,000 15,000 10,000 5,000 1, Figure 1d. Production of Malunggay, Philippines, uary-ember, Fruit Leaves 2006 Figure 2d. Area Harvested with Malunggay, Philippines, uary-ember, Malunggay
9 PRICES Farmgate. In 2008, the annual farmgate price of Native onion variety increased significantly by percent or from P18.77 per kilogram in 2007 to P44.18 per kilogram. A sudden price surge was noted in and this was sustained until ember. Prices went up to as high as P64.47 per kilogram in tember 2008 or percent higher from last year s price of the same month. There was a tight supply of Native onion in the last three quarters of 2008 brought about by lower volume of harvests because of frequent rainfall. Likewise, Red Creole and Yellow Granex had relatively high price gains in 2008 at percent and percent, respectively. Prices increases ranged from 10.0 percent to 37.8 percent for dry peanut without shell, cabbage, eggplant, tomato, camote and cassava. Farm prices of mongo, fresh and dry peanuts with shell each grew by 6 to 7 percent. Garlic was the only crop which exhibited downward movement in farmgate price, it registered an 18.9 percent cut from last year s P23.53 per kilogram Figure 3b. Average Monthly Farmgate Prices, Philippines, Red Creole (Bermuda Red) White (Yellow Granex) Native (Red Shallot), Multiplier Figure 3c. Average Monthly Farmgate Prices, Philippines, Garlic Mongo Eggplant Figure 3d. Average Monthly Farmgate Prices, Philippines, Cabbage Tomato Figure 3a. Average M onthly Farmgate Prices, Philippines, Peanut w ith shell, dry Peanut w ith shell, fresh Peanut w ithout shell, dry Figure 3e. Average Monthly Farmgate Prices, Philippines, Sw eet Potato Cassava 7
10 Wholesale. Annual wholesale prices were up for most of the major vegetables and root crops in 2008 compared to their prices in the previous year. The big price gainers were Red Creole and Native onion varieties. The average annual wholesale price of Red Creole in 2008 went up by 77.9 percent and that of Native onion, by 95.6 percent. Other vegetables which posted increases in their annual average wholesale prices were dry peanut with shell, cabbage, eggplant, tomato, Yellow Granex onion, camote and cassava. In the case of garlic, the average 2008 wholesale price for the year was lower by 7.24 percent from the 2007 price of P per kilogram. Figure 4a. Average Monthly Wholesale Prices, Philippines, Peanut w ith shell, dry Peanut w ithout shell, dry Figure 4b. Average Monthly Wholesale Prices, Philippines, Red Creole (Bermuda Red) White (Yellow Granex) Figure 4c. Average Monthly Wholesale Prices, Philippines, Garlic Mongo Eggplant Figure 4d. Average Monthly Wholesale Prices, Philippines, Cabbage Tomato Figure 4e. Average Monthly Wholesale Prices, Philippines, Sw eet Potato Cassava 8
11 Retail. The average retail prices for 2008 followed the movement of wholesale prices. Red Creole and Yellow Granex onions recorded prices higher by P33.53 per kilogram and P17.69 per kilogram compared to their respective average annual retail prices in On the other hand, annual retail price of garlic was quoted at P per kilogram in This was P14.16 per kilogram less than the 2007 price Figure 5a. Average Monthly Retail Prices, Philippines, Figure 5b. Average Monthly Retail Prices, Philippines, Red Creole (Bermuda Red) White (Yellow Granex) Native (Red Shallot), Multiplier Figure 5c. Average Monthly Retail Prices, Philippines, Garlic Mongo Eggplant Peanut w ith shell, dry Peanut w ithout shell, dry Figure 5d. Average Monthly Retail Prices, Philippines, Cabbage Tomato Sw eet Potato 9
12 TRADE Exports In 2008, the total volume of onion exports was 6,874.9 MT valued at US$ 1,796.9 thousand. Exportation of onion declined by 42.0 percent from 11,844.9 MT in Total revenues went down by 43.3 percent from the 2007 level of US$ 3,168.6 thousand. Fresh or chilled onion accounted for 99.5 percent of the total volume of onion exports. Exports of mongo in 2008 were 12.3 MT, 90.6 percent lower compared to the MT in Total receipts decreased by 64.7 percent, from US$ 39.2 thousand in 2007 to US$ 13.8 thousand in The country exported 66.0 MT of peanuts in This was higher by 8.1 percent compared to the 61.0 MT in Value of exports amounted to US$ thousand in 2008, up by 14.5 percent from US$ thousand in Exports of eggplant or aubergines reached 0.57 MT in This was 30.2 percent lower than the 2007 level. From US$ 0.58 thousand in 2007, export revenues went up to US$ 0.61 thousand. 10 Exports of processed tomato in 2008 was MT, 31.3 percent higher compared to the MT in Total income from exports was US$ thousand, or 43.8 percent more than the US$ thousand registered in Processed tomato exports were ketchup, paste, juices and other tomato sauces. Exports of processed camote recorded a 39.7 percent cut from 3.8 MT in 2007 to 2.3 MT in Export receipts, however, increased by 62.1 percent from US$ 1.52 thousand in 2007 to US$ 2.46 thousand in The volume of cassava exports was estimated at MT in 2008 with corresponding value of US$ 1, thousand. The volume exported was lower by 2.83 percent from the 2007 level of MT. The value of exports was 5.57 percent above US$ 1,180.9 thousand in 2007.
13 Imports Most of the major vegetables and root crops recorded higher volumes of imports in 2008 compared to the 2007 levels. Cabbage recorded the same level of imports. Onion imports in 2008 figured to 66.6 thousand MT. This was 1,621.9 percent higher than the previous year s 3.9 thousand MT. Imports were valued at US$ 9.5 million, or percent more than the previous year s level. There was a sharp increase by 2,075.2 percent in fresh onion imports. From 3.0 thousand MT in 2007, the quantity rose to 65.7 thousand MT in Fresh onions comprised 99.0 percent of the total volume of imported onions. The bulk of imported fresh onions were sourced from India. The volume of tomato imports in 2008 was 32.0 thousand MT. This was up by 67.9 percent from the 2007 level of 19.1 thousand MT. The value of imports was US$ 32.1 million which signified a percent increase from the value in Tomato imports were in fresh and processed forms. Processed tomatoes were in paste, juice, ketchup, puree, prepared/preserved other than by vinegar/acetic acid, whole/in pieces, and prepared/preserved otherwise than by vinegar/acetic acid product forms. In 2008, importation of peanut and cassava increased from their respective 2007 levels. The value of peanut imports was 1.2 thousand MT and indicated an increase of 12.5 percent from Total value of peanut imports was estimated at 2.3 thousand MT or 27.5 percent more than the 2007 level. On the other hand, imports of cassava went up to 81.0 thousand MT or by 40.5 percent from the previous year s imports. Import expenditures amounted to US$ 25.0 million, 80.8 percent higher compared to US$ 13.8 million in Vietnam supplied US$ 16.6 million worth of processed cassava to the country. Annual imports of mongo and garlic in 2008 reached 35.8 MT and 56.8 MT, respectively. This was more than 8 percent each for these commodities compared to their volume of importation in Import values were recorded at US$ 6.1 million for mongo and US$ 11.2 million for garlic. Imports of garlic in fresh and processed forms were mainly sourced from the People s Republic of China. The volume of total cabbage imports in 2008 was 2.0 thousand MT. This was the same volume of shipment into the country in Total value of imports was US$ 6.8 thousand which was 1.0 percent higher than the 2007 import value of US$ 6.7 thousand. 11
14 APPENDIX Table 1. Volume of Production of Major Vegetables and Root Crops, Philippines, uary-ember, (in Metric Tons) Crop uary-ember Percent Change 2006 P 2007/ P/2007 Major 2,926,042 3,184,898 3,238, Mongo 25,952 29,067 29, Peanut 29,151 31,205 30, (3.07) Cabbage 91, , , Eggplant 191, , , (5.03) Tomato 175, , , Garlic 12,581 11,285 11,348 (10.30) 0.56 Onion 75, , , (11.76) Bermuda 38, ,011 91, (14.47) Native 37,145 39,097 37, (4.35) Camote 566, , , (0.19) Cassava 1,756,856 1,871,138 1,941, Malunggay Fruit 4,708 4,879 4, Leaves 42,178 37,603 38,501 (10.85) Table 2a. Volume of Production of Mongo by Region, Philippines, uary-ember, (in Metric Tons) Crop uary - ember % Change % Share 2006 P (08/07) PHILIPPINES 25, , , CAR (0.59) 0.48 Ilocos Region 11, , , (3.61) Cagayan Valley 1, , , Central Luzon 2, , , CALABARZON (10.95) 0.58 MIMAROPA Bicol Region Western Visayas 3, , , (16.49) Central Visayas Eastern Visayas Zamboanga Peninsula Northern Mindanao (0.60) 1.17 Davao Region 1, , , (2.15) 3.49 SOCCSKSARGEN (4.51) 1.72 ARMM 3, , , CARAGA
15 Table 2b. Volume of Production of Peanut by Region, Philippines, uary-ember, (in Metric Tons) Crop uary - ember % Change % Share 2006 P (08/07) PHILIPPINES 29, , , (3.07) CAR (4.94) 0.43 Ilocos Region 12, , , (9.54) Cagayan Valley 3, , , (0.40) Central Luzon 1, , , (1.34) 6.14 CALABARZON (0.69) 2.48 MIMAROPA , Bicol Region (0.90) 3.13 Western Visayas 1, , , Central Visayas 1, , , (4.77) 4.05 Eastern Visayas Zamboanga Peninsula Northern Mindanao 2, , , (2.02) 9.54 Davao Region SOCCSKSARGEN ARMM CARAGA (8.05) 0.50 Table 2c. Volume of Production of Cabbage by Region, Philippines, uary-ember, (in Metric Tons) Crop uary - ember % Change % Share 2006 P (08/07) PHILIPPINES 91, , , CAR 68, , , Ilocos Region 2, , , Cagayan Valley 1, , , (0.33) 1.11 Central Luzon (100.00) - CALABARZON , , (5.93) 0.80 MIMAROPA Bicol Region (0.38) 0.26 Western Visayas (1.86) 0.42 Central Visayas 5, , , Eastern Visayas Zamboanga Peninsula Northern Mindanao 3, , , Davao Region 5, , , SOCCSKSARGEN 1, , , ARMM (5.34) 0.52 CARAGA (5.69)
16 Table 2d. Volume of Production of Eggplant by Region, Philippines, uary-ember, (in Metric Tons) Crop uary - ember % Change % Share 2006 P (08/07) PHILIPPINES 191, , , (5.03) CAR Ilocos Region 77, , , (16.03) Cagayan Valley 15, , , Central Luzon 18, , , (0.36) 9.57 CALABARZON 28, , , MIMAROPA 2, , , Bicol Region 5, , , Western Visayas 13, , , (6.25) 6.76 Central Visayas 5, , , Eastern Visayas 2, , , (1.49) 1.11 Zamboanga Peninsula 1, , , Northern Mindanao 3, , , Davao Region 6, , , (2.42) 3.22 SOCCSKSARGEN 6, , , (2.64) 3.32 ARMM CARAGA 3, , , Table 2e. Volume of Production of Tomato by Region, Philippines, uary-ember, (in Metric Tons) Crop uary - ember % Change % Share 2006 P (08/07) PHILIPPINES 175, , , CAR 3, , , (1.70) 2.03 Ilocos Region 54, , , Cagayan Valley 12, , , (8.53) 6.31 Central Luzon 18, , , (2.42) CALABARZON 15, , , MIMAROPA , Bicol Region 3, , , (4.10) 1.79 Western Visayas 10, , , (8.99) 4.96 Central Visayas 3, , , (2.58) 1.72 Eastern Visayas (0.98) 0.38 Zamboanga Peninsula 1, , , Northern Mindanao 40, , , Davao Region 4, , , SOCCSKSARGEN 4, , , (0.40) 2.56 ARMM CARAGA
17 Table 2f. Volume of Production of Garlic by Region, Philippines, uary-ember, (in Metric Tons) Crop uary - ember % Change % Share 2006 P (08/07) PHILIPPINES 12, , , CAR (16.35) 0.15 Ilocos Region 9, , , (0.38) Cagayan Valley (1.29) 1.92 Central Luzon CALABARZON (5.64) 3.87 MIMAROPA 2, , , Bicol Region (3.01) 0.02 Western Visayas (26.54) 0.52 Central Visayas Eastern Visayas Zamboanga Peninsula Northern Mindanao Davao Region SOCCSKSARGEN ARMM CARAGA Table 2g. Volume of Production of Onion by Region, Philippines, uary-ember, (in Metric Tons) Crop uary - ember % Change % Share 2006 P (08/07) PHILIPPINES 75, , , (11.76) CAR Ilocos Region 44, , , (6.95) Cagayan Valley , , (57.60) 1.59 Central Luzon 30, , , (9.72) CALABARZON (0.08) 0.15 MIMAROPA , , (20.90) Bicol Region Western Visayas (40.86) 0.17 Central Visayas Eastern Visayas Zamboanga Peninsula (0.70) 0.01 Northern Mindanao Davao Region SOCCSKSARGEN (30.47) 0.02 ARMM CARAGA
18 Table 2h. Volume of Production of Bermuda Onion by Region, Philippines, uary-ember, (in Metric Tons) Crop uary - ember % Change % Share 2006 P (08/07) PHILIPPINES 38, , , (14.47) CAR Ilocos Region 10, , , (13.61) Cagayan Valley , , (60.14) 2.01 Central Luzon 26, , , (10.22) CALABARZON MIMAROPA , , (20.90) Bicol Region Western Visayas (40.98) 0.23 Central Visayas Eastern Visayas Zamboanga Peninsula Northern Mindanao Davao Region SOCCSKSARGEN (78.26) 0.00 ARMM CARAGA Table 2i. Volume of Production of Native Onion by Region, Philippines, uary-ember, (in Metric Tons) Crop uary - ember % Change % Share 2006 P (08/07) PHILIPPINES 37, , , (4.35) CAR Ilocos Region 33, , , (4.82) Cagayan Valley Central Luzon 3, , , CALABARZON (16.31) 0.07 MIMAROPA (10.01) 0.02 Bicol Region Western Visayas (38.46) 0.03 Central Visayas Eastern Visayas Zamboanga Peninsula (0.70) 0.04 Northern Mindanao Davao Region SOCCSKSARGEN (28.90) 0.07 ARMM CARAGA
19 Table 2j. Volume of Production of Camote by Region, Philippines, uary-ember, (in Metric Tons) Crop uary - ember % Change % Share 2006 P (08/07) PHILIPPINES 566, , , (0.19) CAR 17, , , Ilocos Region 16, , , (6.38) 2.68 Cagayan Valley 17, , , (4.16) 2.77 Central Luzon 30, , , (0.01) 5.51 CALABARZON 40, , , (7.42) 6.49 MIMAROPA 12, , , Bicol Region 87, , , Western Visayas 47, , , (3.67) 7.79 Central Visayas 53, , , (0.73) 8.30 Eastern Visayas 116, , , (1.28) Zamboanga Peninsula 10, , , (5.35) 1.78 Northern Mindanao 26, , , Davao Region 19, , , SOCCSKSARGEN 9, , , ARMM 6, , , CARAGA 55, , , Table 2k. Volume of Production of Cassava by Region, Philippines, uary-ember, (in Metric Tons) Crop uary - ember % Change % Share 2006 P (08/07) PHILIPPINES 1,756, ,871, ,941, CAR 1, , , Ilocos Region 16, , , (0.25) 0.86 Cagayan Valley 31, , , Central Luzon 9, , , CALABARZON 65, , , (5.98) 3.10 MIMAROPA 8, , , Bicol Region 109, , , Western Visayas 57, , , (3.00) 3.08 Central Visayas 69, , , Eastern Visayas 71, , , (0.10) 3.75 Zamboanga Peninsula 27, , , Northern Mindanao 228, , , Davao Region 17, , , (1.00) 0.80 SOCCSKSARGEN 29, , , (2.65) 1.64 ARMM 965, , ,003, CARAGA 48, , ,
20 Table 2l. Volume of Production of Malunggay Leaves by Region, Philippines, uary-ember, (in Metric Tons) Crop uary - ember % Change % Share 2006 P (08/07) PHILIPPINES 42, , , CAR Ilocos Region 3, , , (3.65) 8.41 Cagayan Valley 2, , , (17.77) 5.48 Central Luzon CALABARZON MIMAROPA Bicol Region 2, , , Western Visayas 6, , , Central Visayas 9, , , Eastern Visayas Zamboanga Peninsula 2, , , Northern Mindanao 5, , , Davao Region 3, , , SOCCSKSARGEN 4, , , ARMM CARAGA 1, , , (11.26) 3.66 Table 2m. Volume of Production of Malunggay Fruit by Region, Philippines, uary-ember, (in Metric Tons) Crop uary - ember % Change % Share 2006 P (08/07) PHILIPPINES 4, , , CAR Ilocos Region 4, , , Cagayan Valley (5.11) 3.56 Central Luzon CALABARZON (11.68) 0.45 MIMAROPA Bicol Region Western Visayas Central Visayas Eastern Visayas Zamboanga Peninsula Northern Mindanao Davao Region SOCCSKSARGEN ARMM CARAGA P F p s P k i D P 2 o s q v r G 2 r P t s a a t w f c 18
21 Table 3. Area Harvested of Major Vegetables and Root Crops, Philippines, uary-ember, (Hectares) Crop uary-ember Percent Change 2006 P 2007/ P/2007 Major 445, , , (1.74) Mongo 35,732 39,011 39, Peanut 27,642 28,316 26, (5.63) Cabbage 7,323 8,502 8, Eggplant 20,901 21,613 20, (3.60) Tomato 17,128 17,544 17, (0.92) Garlic 4,448 3,863 3,850 (13.16) (0.33) Onion 8,442 15,879 14, (8.19) Bermuda 4,057 11,432 10, (10.62) Native 4,385 4,447 4, (1.92) Camote 118, , ,507 (1.05) (3.47) Cassava 204, , , (0.35) Malunggay Fruit (0.86) Note: Area harvested of Malunggay fruit and leaves are the same as both are sourced from one tree planted on the same area. 19
22 Table 4a. Average Farmgate Prices of Major Vegetables and Root Crops, Philippines, uary-ember, (Peso per Kilogram) Crop 20 uary-ember % Change P (08/07) Mongo Peanut with shell, dry without shell, dry with shell, fresh Cabbage Eggplant Tomato Garlic (18.86) Onion Bermuda Native Yellow Granex Camote Cassava Source: BAS-AMSAD Table 4b. Average Wholesale Prices of Major Vegetables and Root Crops, Philippines, uary-ember, (Peso per Kilogram) Crop uary-ember % Change P (08/07) Mongo Peanut with shell, dry without shell, dry Cabbage Eggplant Tomato Garlic (7.24) Onion Bermuda Native Yellow Granex Camote Cassava Source: BAS-AMSAD 20
23 Table 4c. Average Retail Prices of Major Vegetables and Root Crops, Philippines, uary-ember, (Peso per Kilogram) Crop uary-ember % Change P (08/07) Mongo Peanut with shell, dry without shell, dry Cabbage Eggplant Tomato Garlic (8.66) Onion Bermuda Yellow Granex Camote Source: BAS-AMSAD 21
24 Table 5. Quantity and Value of Major Vegetable and Root Crops Exports, Philippines, uary-ember, Commodity Quantity (MT) % Change FOB Value ('000 US$) % Change (08/07) (08/07) Mongo (90.57) (64.71) Processed (90.57) (64.71) Peanut Processed Cabbage (100.00) (100.00) Fresh 6.38 (100.00) 1.81 (100.00) Eggplant (30.18) Fresh (30.18) Tomato Processed Garlic (38.35) (59.00) Fresh Processed (38.35) (59.00) Onions 11, , (41.96) 3, , (43.29) Fresh 11, , (42.22) 3, , (46.51) Processed Camote (39.74) Processed (39.74) Cassava (2.83) 1, , Processed (2.83) 1, , Source: BAS-AMSAD 22
25 Table 6. Quantity and Value of Major Vegetable and Root Crops Imports, Philippines, uary-ember, Commodity Quantity (MT) % Change CIF Value ('000 US$) % Change (08/07) (08/07) Mongo 32, , , , Processed 32, , , , Peanut 1, , , , Processed 1, , , , Cabbage Processed Tomato 19, , , , Fresh (6.00) Processed 19, , , , Garlic 52, , , , (2.73) Fresh 50, , , , Processed 1, , , , (19.66) Onions 3, , , , , Fresh 3, , , , , Processed , , Camote Processed Cassava 57, , , , Processed 57, , , , Source: BAS-AMSAD 23
26 Table 7. Quantity and Value of Major Vegetable and Root Crops Exports and Imports, by Top ket, Philippines, uary-ember, 2008 Commodity Country of Destination Exports Imports Quantity FOB Value Country of Quantity CIF Value (MT) ('000 US$) Origin (MT) ('000 US$) MONGO , , Processed , , Guam Indonesia 12, , Others Others 23, , PEANUT , , Processed , , USA China , Others Others EGGPLANT Fresh Kuwait Others CABBAGE Processed China Others TOMATO , , Fresh Singapore Processed , , UAE China 19, , Others Others 12, , GARLIC , , Fresh 54, , China 46, , Others 8, Processed , , Thailand China 1, , Others Others ONIONS 6, , , , Fresh 6, , , , Indonesia 6, , India 34, , Others Others 30, , Processed , China USA Others Others , CAMOTE Processed Hong Kong Japan Others Others CASSAVA , , , Processed , , , USA Vietnam 51, , Others Others 29, , Source: BAS-AMSAD 24
27 Department of Agriculture BUREAU OF AGRICULTURAL STATISTICS 1184 Ben-Lor Building, Quezon Avenue, Quezon City CROPS STATISTICS DIVISION Tel No
Situation Report on Major Non-Food and Industrial Crops
 Republic of the Philippines Department of Agriculture Bureau of Agricultural Statistics Situation Report on Major Non-Food and Industrial Crops January-March 2008 Vol. 1 No. 1 June 2008 Explanatory Notes
Peaches & Nectarines and Cherry Annual Reports
 THIS REPORT CONTAINS ASSESSMENTS OF COMMODITY AND TRADE ISSUES MADE BY USDA STAFF AND NOT NECESSARILY STATEMENTS OF OFFICIAL U.S. GOVERNMENT POLICY Required Report - public distribution Date: GAIN Report
PHILIPPINES. 1. Market Trends: Import Items Change in % Major Sources in %
 PHILIPPINES A. MARKET OF FRESH FRUITS & VEGETABLES 1. Market Trends: Import Items 2003 2007 Change in % Major Sources in % Value Quantity Value Quantity Value Quantity USD '000 Tons USD '000 Tons Grapes
Fresh Deciduous Fruit (Apples, Grapes, & Pears): World Markets and Trade
: World Markets and Trade") United States Department of Agriculture Foreign Agricultural Service Fresh Deciduous Fruit (Apples, Grapes, & Pears): World Markets and Trade 9 1, MT Deciduous Fruit on Seasonal Cycles 6 Northern Hemisphere
United States Department of Agriculture Foreign Agricultural Service Fresh Deciduous Fruit (Apples, Grapes, & Pears): World Markets and Trade 9 1, MT Deciduous Fruit on Seasonal Cycles 6 Northern Hemisphere
International Table Grape Symposium November 2014 Australian Table Grapes Jeff Scott Chief Executive Officer
 International Table Grape Symposium November 2014 Australian Table Grapes Jeff Scott Chief Executive Officer Australian Table Grape Industry - Snapshot There are approximately 900 table grape growers throughout
Economic Role of Maize in Thailand
 Economic Role of Maize in Thailand Hnin Ei Win Center for Applied Economics Research Thailand INTRODUCTION Maize is an important agricultural product in Thailand which is being used for both food and feed
China s Export of Key Products of Pharmaceutical Raw Materials
 China s Export of Key Products of Pharmaceutical Raw Materials During the period of the 62nd API China& INTERPHEX CHINA, China Pharmaceutical Industry Association released its annual Report on Analysis
Fresh Deciduous Fruit (Apples, Grapes, & Pears): World Markets and Trade
: World Markets and Trade") Million MT United States Department of Agriculture Foreign Agricultural Service December 21 Fresh Deciduous Fruit (Apples, Grapes, & Pears): World Markets and Trade 21/11 Forecast: World Apple Trade Declines;
Million MT United States Department of Agriculture Foreign Agricultural Service December 21 Fresh Deciduous Fruit (Apples, Grapes, & Pears): World Markets and Trade 21/11 Forecast: World Apple Trade Declines;
GAIN Report Global Agriculture Information Network
 Foreign Agricultural Service GAIN Report Global Agriculture Information Network Voluntary Report - public distribution Date: 5/26/2000 China, Peoples Republic of GAIN Report #CH0612 Trade data - Multiple
Record Exports for Coffee Year 2016/17
 Record Exports for Coffee Year 2016/17 Total exports in September 2017 reached 8.34 million bags, compared to 9.8 million in September 2016. While coffee year 2016/17 registered a decrease in its final
WORLD OILSEEDS AND PRODUCTS
 WORLD OILSEEDS AND PRODUCTS 218 / World Oilseeds and Products: FAPRI 2004 Agricultural Outlook World Soybean and Soybean Products The world soybean price climbed strongly in 2003/04, driven by robust demand
Chile. Tree Nuts Annual. Almonds and Walnuts Annual Report
 THIS REPORT CONTAINS ASSESSMENTS OF COMMODITY AND TRADE ISSUES MADE BY USDA STAFF AND NOT NECESSARILY STATEMENTS OF OFFICIAL U.S. GOVERNMENT POLICY Required Report - public distribution Date: GAIN Report
Taiwan Fishery Trade: Import Demand Market for Shrimps. Bith-Hong Ling
 International Symposium Agribusiness Management towards Strengthening Agricultural Development and Trade III : Agribusiness Research on Marketing and Trade Taiwan Fishery Trade: Import Demand Market for
KUWAIT. Similarly there is a decreasing trend for other fresh fruits products like grapes and lychee. India shared 37.6% of import market in Kuwait.
 KUWAIT A. MARKET FOR FRESH FRUITS AND FRESH VEGETABLES 1. Market Trend and Opportunities: Fresh Fruits The market for fresh fruits in Kuwait has a downward trend. Bananas import volume decreased by 34%
Update on ASEAN Steel Industry Development Scenario
 2017 ASEAN Iron and Steel Sustainability Forum Update on ASEAN Steel Industry Development Scenario Presented by: TAN AH YONG Secretary General South East Asia Iron and Steel Institute (SEAISI) CONTENTS:
Table grape. Horticulture trade intelligence. Quarter 1: January to March 2017
 Horticulture trade intelligence A custom report compiled for Hort Innovation by Euromonitor International Table grape Quarter 1: January to March 217 Horticulture trade intelligence: Table grape: 217:
Prices for all coffee groups increased in May
 Prices for all coffee groups increased in May In May 2018, the ICO composite indicator increased by 0.7% to an average of 113.34 US cents/lb, following three months of declines. Prices for all coffee groups
SINGAPORE. Summary Table: Import of Fresh fruits and Vegetables in Fresh fruit and Vegetables Market Value $000 Qty in Tons
 SINGAPORE A. MARKET FOR FRESH FRUIT AND VEGETABLES 1. Market Trend and Opportunities Summary Table: Import of Fresh fruits and Vegetables in Fresh fruit and Vegetables Market Products/ Other Info. Product
Vegetable Spotlight Broccoli
 Vegetable Spotlight Broccoli Summary Broccoli is Australia s 10 th largest vegetable crop in terms of value, accounting for 3.4% of total vegetable production with a gross value of $101.2 million in 2008/09.
THIS REPORT CONTAINS ASSESSMENTS OF COMMODITY AND TRADE ISSUES MADE BY USDA STAFF AND NOT NECESSARILY STATEMENTS OF OFFICIAL U.S.
 THIS REPORT CONTAINS ASSESSMENTS OF COMMODITY AND TRADE ISSUES MADE BY USDA STAFF AND NOT NECESSARILY STATEMENTS OF OFFICIAL U.S. GOVERNMENT POLICY Required Report - public distribution Date: GAIN Report
ANALYSIS OF THE EVOLUTION AND DISTRIBUTION OF MAIZE CULTIVATED AREA AND PRODUCTION IN ROMANIA
 ANALYSIS OF THE EVOLUTION AND DISTRIBUTION OF MAIZE CULTIVATED AREA AND PRODUCTION IN ROMANIA Agatha POPESCU University of Agricultural Sciences and Veterinary Medicine, Bucharest, 59 Marasti, District
The supply and demand for oilseeds in South Africa
 THIS REPORT CONTAINS ASSESSMENTS OF COMMODITY AND TRADE ISSUES MADE BY USDA STAFF AND NOT NECESSARILY STATEMENTS OF OFFICIAL U.S. GOVERNMENT POLICY Required Report - public distribution Date: GAIN Report
Monitoring EU Agri-Food Trade: Development until June 2017
 Monitoring EU Agri-Food Trade: Development until June 2017 June 2017: Agri-food exports again above previous years level After a rebound in May, the monthly value of EU agri-food exports went down to EUR
Monthly Economic Letter U.S. and Global Market Fundamentals
 Monthly Economic Letter U.S. and Global Market Fundamentals August 2012 www.cottoninc.com After trading within relatively narrow bands throughout July, New York futures moved higher in early August, with
Monitoring EU Agri-Food Trade: Development until September 2018
 Monitoring EU Agri-Food Trade: Development until September 2018 September 2018: Slowdown in EU export performance; imports from Brazil and US still on the rise The monthly value of EU agri-food trade in
Record exports in coffee year 2017/18
 Record exports in coffee year 2017/18 Total coffee exports increased each year since 2010/11 with a new record reached in 2017/18 at 121.86 million bags, 2% higher than 2016/17. In the twelve months ending
Coffee prices rose slightly in January 2019
 Coffee prices rose slightly in January 2019 In January 2019, the ICO composite indicator rose by 0.9% to 101.56 US cents/lb as prices for all group indicators increased. After starting at a low of 99.16
The Potential Role of Latin America Food Trade in Asia Pacific PECC Agricultural and Food Policy Forum Taipei
 The Potential Role of Latin America Food Trade in Asia Pacific 2011 PECC Agricultural and Food Policy Forum Taipei Universidad EAFIT, Colombia December 2, 2011 1 CONTENTS 1. Introduction 2. Food Trade
Milk and Milk Products. Price and Trade Update: October
 October Milk and Milk Products Price and Trade Update Weekly Newsletter Milk and Milk Products Price and Trade Update: October 1 INTERNATIONAL PRICES: Weak import demand causes prices to fall International
India. Oilseeds and Products Update. August 2012
 THIS REPORT CONTAINS ASSESSMENTS OF COMMODITY AND TRADE ISSUES MADE BY STAFF AND NOT NECESSARILY STATEMENTS OF OFFICIAL U.S. GOVERNMENT POLICY Required Report - public distribution Oilseeds and Products
Soybean Oil and Palm Oil Account For An Increasing Share of World Vegetable Oil Consumption
 United States Department of Agriculture Foreign Agricultural Service Circular Series FOP 01-03 January 2003 Soybean Oil and Palm Oil Account For An Increasing Share of World Vegetable Oil Consumption Percent
Growing divergence between Arabica and Robusta exports
 Growing divergence between Arabica and Robusta exports In April 218, the ICO composite indicator decreased by.4% to an average of 112.56, with the daily price ranging between 11.49 and 114.73. Prices for
ANALYSIS ON THE STRUCTURE OF HONEY PRODUCTION AND TRADE IN THE WORLD
 ANALYSIS ON THE STRUCTURE OF HONEY PRODUCTION AND TRADE IN THE WORLD GU G., ZHANG Ch., HU F.* Department of Sericulture and Apiculture, College of Animal Science Zhejiang University, Hangzhou 310029, CHINA
Tea Statistics Report 2015
 Tea Statistics Report 215 Introduction This report presents the scope and scale of the UTZ tea program in 215. Throughout this report tea also includes rooibos unless otherwise specified. The statistics
Citrus: World Markets and Trade
 United States Department of Agriculture Foreign Agricultural Service Citrus: World Markets and Trade Oranges Global orange production for 2012/13 is forecast to drop over 4 percent from the previous year
Volatility returns to the coffee market as prices stay low
 Volatility returns to the coffee market as prices stay low Daily coffee prices hit their lowest level in 19 months during August, as commodity markets worldwide were negatively affected by currency movements
Monitoring EU Agri-Food Trade: Development until August 2018
 Monitoring EU Agri-Food Trade: Development until August 2018 August 2018: Export performance remains stable; imports from US continue to increase The value of EU agri-food trade in the month of August
Update on ASEAN Steel Industry Development Scenario
 2016 ASEAN Iron and Steel Sustainability Forum Update on ASEAN Steel Industry Development Scenario Presented by: TAN AH YONG Secretary General South East Asia Iron and Steel Institute (SEAISI) CONTENTS:
Downward correction as funds respond to increasingly positive supply outlook
 Downward correction as funds respond to increasingly positive supply outlook Coffee prices fell sharply at the end of April as institutional investors sold off their positions. The coffee market continues
MONTHLY COFFEE MARKET REPORT
 E MONTHLY COFFEE MARKET REPORT May 2014 After five consecutive months of rising prices, the coffee market reversed lower in May. From a high of 179 cents/lb in April, the daily price of the ICO composite
THIS REPORT CONTAINS ASSESSMENTS OF COMMODITY AND TRADE ISSUES MADE BY USDA STAFF AND NOT NECESSARILY STATEMENTS OF OFFICIAL U.S.
 THIS REPORT CONTAINS ASSESSMENTS OF COMMODITY AND TRADE ISSUES MADE BY USDA STAFF AND NOT NECESSARILY STATEMENTS OF OFFICIAL U.S. GOVERNMENT POLICY Required Report - public distribution Date: GAIN Report
Consistently higher production and more exportable supplies from Thailand are major factors in the decline in world rice prices in 2014 and continued
 Rice Consistently higher production and more exportable supplies from Thailand are major factors in the decline in world rice prices in 2014 and continued lower levels over the next ten years. Part of
Coffee market settles lower amidst strong global exports
 Coffee market settles lower amidst strong global exports The ICO composite indicator price declined by 1.2% in February 2018 to an average of 114.19 US cents/lb. Indicator prices for all three Arabica
Monitoring EU Agri-Food Trade: Development until August 2017
 Monitoring EU Agri-Food Trade: Development until August 2017 August 2017: Agri-food exports continue strong The monthly value of EU agri-food exports rose slightly to EUR 11.5 billion in August 2017, a
QUARTELY MAIZE MARKET ANALYSIS & OUTLOOK BULLETIN 1 OF 2015
 QUARTELY MAIZE MARKET ANALYSIS & OUTLOOK BULLETIN 1 OF 2015 INTRODUCTION The following discussion is a review of the maize market environment. The analysis is updated on a quarterly 1 basis and the interval
Cultivation Pattern:
 Introduction: Cumin seed commonly know as Jeera (Cuminum cyminum) belongs to Apiacae family. Though Cumin is a native of Egypt, it now mostly produced in India. India is the largest producer and consumer
Coffee market continues downward trend
 Coffee market continues downward trend Since August 2017, the ICO composite indicator price has declined in each month except January 2018. The composite indicator decreased by 1.1% in March 2018 to an
Coffee market recovers slightly from December slump
 Coffee market recovers slightly from December slump After reaching its lowest level in 22 months in December 2017, the monthly average of the ICO composite indicator price increased by 1.4% to 115.60 US
July marks another month of continuous low prices
 July marks another month of continuous low prices In July 2018, the ICO composite indicator price decreased by 2.9% to an average of 107.20 US cents/lb, which is the lowest monthly average for July since
STATE OF THE VITIVINICULTURE WORLD MARKET
 STATE OF THE VITIVINICULTURE WORLD MARKET April 2018 1 Table of contents 1. VITICULTURAL PRODUCTION POTENTIAL 3 2. WINE PRODUCTION 5 3. WINE CONSUMPTION 7 4. INTERNATIONAL TRADE 9 Abbreviations: kha: thousands
Coffee market ends 2017/18 in surplus
 Coffee market ends 217/18 in surplus World coffee production in coffee year 217/18 is estimated 5.7% higher at 164.81 million bags as output of Arabica increased by 2.2% to 11.82, and Robusta grew 11.7%
Soft Commodity Markets - Upcoming Milestones, and How the Market Could Be Affected
 Soft Commodity Markets - Upcoming Milestones, and How the Market Could Be Affected September 15, 2014 Judith Ganes President J. Ganes Consulting, LLC Weather & Politics Current Weather Expectations El
Asia Pacific Tuna Trade. Shirlene Maria Anthonysamy INFOFISH Pacific Tuna Forum 2017 Papua New Guinea
 Asia Pacific Tuna Trade Shirlene Maria Anthonysamy INFOFISH Pacific Tuna Forum 217 Papua New Guinea JAPANESE MARKET Demand for sashimi tuna remains highly seasonal strengthening during the spring festivals
Coffee: World Markets and Trade
 United States Department of Agriculture Foreign Agricultural Service June 2016 Coffee: World Markets and Trade 2016/17 Forecast Overview World coffee production for 2016/17 is forecast to rise 2.4 million
STATE OF THE VITIVINICULTURE WORLD MARKET
 STATE OF THE VITIVINICULTURE WORLD MARKET April 2015 1 Table of contents 1. 2014 VITIVINICULTURAL PRODUCTION POTENTIAL 3 2. WINE PRODUCTION 5 3. WINE CONSUMPTION 7 4. INTERNATIONAL TRADE 9 Abbreviations:
Performance of the ASEAN Iron and Steel Industry in 2017 and Outlook
 Performance of the ASEAN Iron and Steel Industry in 2017 and Outlook Presented by: Tan Ah Yong Secretary General South East Asia Iron and Steel Institute (SEAISI) 1 CONTENTS: Macroeconomic Scenario Steel
Milk and Milk Products. Price and Trade Update. Weekly Newsletter. Milk and Milk Products. Price and Trade Update: April
 April Milk and Milk Products Price and Trade Update Weekly Newsletter Milk and Milk Products Price and Trade Update: April 1 PRICES: Remain depressed International dairy product prices began the year at
Coffee market ends 2015/16 in deficit for the second consecutive year
 Coffee market ends 2015/16 in deficit for the second consecutive year The coffee market settled up by 5.5% in September, mostly driven by a steady increase in Robusta prices supported by concerns over
Monitoring EU Agri-Food Trade: Development until October 2016
 Monitoring EU Agri-Food Trade: Development until October 2016 October 2016 EU agri-food exports stabilise at high level The monthly value of EU agri-food exports in October 2016 stabilised at EUR 11.4
VIETNAMESE COFFEE REPORT
 VIETNAMESE COFFEE REPORT Hanoi, November 2016 Coffee is one of Vietnam's most important agricultural exports, second only to rice about export turnover. Vietnam still remains the world s biggest exporter
ICC September 2018 Original: English. Emerging coffee markets: South and East Asia
 ICC 122-6 7 September 2018 Original: English E International Coffee Council 122 st Session 17 21 September 2018 London, UK Emerging coffee markets: South and East Asia Background 1. In accordance with
Monitoring EU Agri-Food Trade: Development until April 2017
 Monitoring EU Agri-Food Trade: Development until April 2017 April 2017: Agri-food exports back to average values The monthly value of EU agri-food exports in April 2017 reached a value of EUR 10.6 billion,
January 2015 WORLD GRAPE MARKET SUPPLY, DEMAND AND FORECAST
 January 2015 WORLD GRAPE MARKET SUPPLY, DEMAND AND FORECAST Table of Contents Executive Summary... 4 1. VARIETIES OF GRAPES... 6 1.1. White table grapes... 6 1.2. Red table grapes... 6 2. WORLD DEMAND
MONTHLY COFFEE MARKET REPORT
 1 E MONTHLY COFFEE MARKET REPORT March 2014 Ongoing uncertainty over the Brazilian coffee crop has caused significant fluctuations in coffee prices during March, with monthly volatility of the International
INTERNATIONAL DAIRY PRODUCTS COUNCIL. Reply to Questionnaire 4. Australia (1988/89) I. Milk. A. Production and Utilization of Milk
 I. Milk. A. Production and Utilization of Milk") GENERAL AGREEMENT ON TARIFFS AND TRADE ACCORD GENERAL SUR LES TARIFS DOUANIERS ET LE COMMERCE ACUERDO GENERAL SOBRE ARANCELES ADUANEROS Y COMERCIO RESTRICTED DPC/STAT/12/Add.20 29 September 198 9 International
GENERAL AGREEMENT ON TARIFFS AND TRADE ACCORD GENERAL SUR LES TARIFS DOUANIERS ET LE COMMERCE ACUERDO GENERAL SOBRE ARANCELES ADUANEROS Y COMERCIO RESTRICTED DPC/STAT/12/Add.20 29 September 198 9 International
Coffee market ends 2016/17 coffee year in deficit for the third consecutive year
 Coffee market ends 2016/17 coffee year in deficit for the third consecutive year The ICO composite indicator continued its downward trend that started at the end of August, averaging 124.46 US cents/lb.
Tanzania. Coffee Annual. Tanzania Coffee Annual Report
 THIS REPORT CONTAINS ASSESSMENTS OF COMMODITY AND TRADE ISSUES MADE BY USDA STAFF AND NOT NECESSARILY STATEMENTS OF OFFICIAL U.S. GOVERNMENT POLICY Required Report - public distribution Date: GAIN Report
Vegetable Imports Approaching 20% of Total
 Vegetable Imports Approaching 20% of Total Domestic Supply The taste of imported vegetables has become more familiar to the palates of Japanese consumers in recent years. According to the Ministry of Finance,
2018/19 expected to be the second year of surplus
 2018/19 expected to be the second year of surplus Coffee year 2018/19 is expected to be the second consecutive season of surplus, as global output, estimated at 167.47 million bags, exceeds world consumption,
UTZ Coffee Statistics Report 2017
 UTZ Coffee Statistics Report 2017 UTZ is the largest certification program in the world for sustainable coffee More than 480,000 coffee farmers and workers benefit from the UTZ program UTZ certified coffee
Philippines. Sugar Annual. Situation and Outlook
 THIS REPORT CONTAINS ASSESSMENTS OF COMMODITY AND TRADE ISSUES MADE BY USDA STAFF AND NOT NECESSARILY STATEMENTS OF OFFICIAL U.S. GOVERNMENT POLICY Required Report - public distribution Date: GAIN Report
THIS REPORT CONTAINS ASSESSMENTS OF COMMODITY AND TRADE ISSUES MADE BY USDA STAFF AND NOT NECESSARILY STATEMENTS OF OFFICIAL U.S.
 THIS REPORT CONTAINS ASSESSMENTS OF COMMODITY AND TRADE ISSUES MADE BY USDA STAFF AND NOT NECESSARILY STATEMENTS OF OFFICIAL U.S. GOVERNMENT POLICY Required Report - public distribution Date: GAIN Report
Quarterly AGRI-FOOD TRADE HIGHLIGHTS
 Quarterly AGRI-FOOD TRADE HIGHLIGHTS First Quarter 1998 Agriculture and Agri-Food Canada Agriculture et Agroalimentaire Canada QUARTERLY AGRI-FOOD TRADE HIGHLIGHTS FIRST QUARTER 1998 NO. 98:1 JULY 1998
Monthly Economic Letter
 Monthly Economic Letter Cotton Market Fundamentals & Price Outlook RECENT PRICE MOVEMENT After falling in the days surrounding the release of last month s USDA report, NY futures and the A Index were mostly
GLOBAL DAIRY UPDATE. Welcome to our March 2015 Global Dairy Update IN THIS EDITION Financial Calendar
 GLOBAL DAIRY UPDATE Welcome to our ch 2015 Global Dairy Update IN THIS EDITION Fonterra milk collection New Zealand 7% lower in ruary 2015 and 1.5% higher for the season to date Australia 4% higher in
Monitoring EU Agri-Food Trade: Development until October 2018
 Monitoring EU Agri-Food Trade: Development until October 2018 October 2018: best EU agri-food export performance ever The monthly value of EU agri-food trade in October 2018 was second biggest ever recorded
World of sugar PAGE 54
 World of sugar More than 1 countries produce sugar, about 8% of which is made from sugar cane grown primarily in the tropical and sub-tropical zones of the southern hemisphere, and the balance from sugar
Import Volume of coffee into Japan (metric tons) Total Green Beans equivalent. Soluble Coffee
 Total Green Beans equivalent. Soluble Coffee") Market in Japan -111- History 1. A limited amount of coffee was drunk by Dutch residents of Nagasaki at the end of the eighteenth century. However, coffee was not generally sold until the last quarter
Market in Japan -111- History 1. A limited amount of coffee was drunk by Dutch residents of Nagasaki at the end of the eighteenth century. However, coffee was not generally sold until the last quarter
QUARTERLY REVIEW OF THE PERFORMANCE OF THE DAIRY INDUSTRY 1
 QUARTERLY REVIEW OF THE PERFORMANCE OF THE DAIRY INDUSTRY 1 The information in this document is from sources deemed to be correct. Milk SA, the MPO and SAMPRO are not responsible for the results of any
Acreage Forecast
 World (John Sandbakken and Larry Kleingartner) The sunflower is native to North America but commercialization of the plant took place in Russia. Sunflower oil is the preferred oil in most of Europe, Mexico
Statistics & Agric.Economics Deptt., Tocklai Experimental Station, Tea Research Association, Jorhat , Assam. ABSTRACT
 Two and a Bud 59(2):152-156, 2012 RESEARCH PAPER Global tea production and export trend with special reference to India Prasanna Kumar Bordoloi Statistics & Agric.Economics Deptt., Tocklai Experimental
THIS REPORT CONTAINS ASSESSMENTS OF COMMODITY AND TRADE ISSUES MADE BY USDA STAFF AND NOT NECESSARILY STATEMENTS OF OFFICIAL U.S.
 THIS REPORT CONTAINS ASSESSMENTS OF COMMODITY AND TRADE ISSUES MADE BY USDA STAFF AND NOT NECESSARILY STATEMENTS OF OFFICIAL U.S. GOVERNMENT POLICY Voluntary - Public Date: 4/24/2013 GAIN Report Number:
Record exports from Brazil weigh heavy on the coffee market
 Record exports from Brazil weigh heavy on the coffee market Coffee exports from Brazil reached a record high of 36.8 million bags in crop year 2014/15 (April to March), fuelled by domestic stocks and encouraged
UK Leather Industry in 2017
 UK Leather Industry in 2017 The UK leather industry is comprised of specialist, high end producers of automotive, upholstery, shoe upper and sole, gloving, chamois, equestrian leather and wet blue leather.
MONTHLY COFFEE MARKET REPORT
 E MONTHLY COFFEE MARKET REPORT June 2013 Coffee prices fell sharply in June 2013, as market fundamentals, combined with an uncertain macroeconomic outlook, drove the ICO composite indicator price to its
2017 U.S. DISTILLERS GRAINS EXPORTS
 217 U.S. DISTILLERS GRAINS EXPORTS 14, Annual U.S. Distillers Grains Exports 12, 12,695 1, 8, 6, 4, 2, 2,358 4,532 5,651 9,5 7,676 7,421 9,67 11,284 11,314 11,77 U.S. exports of distillers grains (DG)
An Overview of the U.S. Bell Pepper Industry. Trina Biswas, Zhengfei Guan, 1 Feng Wu University of Florida
 An Overview of the U.S. Bell Pepper Industry Trina Biswas, Zhengfei Guan, 1 Feng Wu University of Florida Bell pepper is one of the most widely cultivated vegetable crops in the world. Characterized by
Citrus: World Markets and Trade
 Department of Agriculture eign Agricultural Service January Citrus: World Markets and Trade Citrus: / ecast Global Orange Production and Trade Expand Global production and trade for is forecast at. million
Deliveries to dairies 198/86 GENERAL AGREEMENT ON TARIFFS AND TRADE. Consurption of fresh milk (including exports) 1985/86. Industrial uses 1985/86
 1985/86. Industrial uses 1985/86") GENERAL AGREEMENT ON TARIFFS AND TRADE RESTRICTED DPC/STAT/12/Add. 14 23 September 1986 International Dairy Arrangement INTERNATIONAL DAIRY PRODUCTS Reply to Questionnaire 4 AUSTRALIA COUNCIL (Financial
GENERAL AGREEMENT ON TARIFFS AND TRADE RESTRICTED DPC/STAT/12/Add. 14 23 September 1986 International Dairy Arrangement INTERNATIONAL DAIRY PRODUCTS Reply to Questionnaire 4 AUSTRALIA COUNCIL (Financial
World coffee consumption increases but prices still low
 World coffee consumption increases but prices still low The coffee market stabilised slightly in February, but prices remain at very low levels. A lack of news regarding fundamentals with expectations
Coffee prices maintain downward trend as 2015/16 production estimates show slight recovery
 Coffee prices maintain downward trend as 2015/16 production estimates show slight recovery The coffee market fell again in December 2015, reaching its second lowest monthly average of the year. This decrease
P E C A N R E P O R T
 P E C A N R E P O R T Agricultural Marketing Service 16 Forest Parkway Specialty Crops Programs Building 1-218 Market News Division Forest Park, Georgia 30297 Phone (404) 361-1376 FAX (404) 363-2523 Pecan
VIETNAM VEGETABLE AND FRUITS
 UNNExT Workshop on Promoting Cross-border Agricultural Trade for Sustainable Development 1 VIETNAM VEGETABLE AND FRUITS MBs. Cao Thi Minh Hue Department of Agro Processing and Salt Production - MARD Bangkok,
THIS REPORT CONTAINS ASSESSMENTS OF COMMODITY AND TRADE ISSUES MADE BY USDA STAFF AND NOT NECESSARILY STATEMENTS OF OFFICIAL U.S.
 THIS REPORT CONTAINS ASSESSMENTS OF COMMODITY AND TRADE ISSUES MADE BY USDA STAFF AND NOT NECESSARILY STATEMENTS OF OFFICIAL U.S. GOVERNMENT POLICY Required Report - public distribution Date: GAIN Report
MONTHLY COFFEE MARKET REPORT
 E MONTHLY COFFEE MARKET REPORT February 2014 February 2014 has seen significant developments in the coffee market, with prices shooting upwards at a startling rate. The ICO composite daily price has increased
AMAZONIA (BRAZIL) NUTS MACADAMIAS HAZELNUTS PISTACHIOS WALNUTS PINE NUTS PECANS
 NUTS MACADAMIAS HAZELNUTS PISTACHIOS WALNUTS PINE NUTS PECANS") HAZELNUTS MACADAMIAS PECANS PINE NUTS INTRODUCTION WORLD PRODUCTION PRODUCTION AND CONSUMPTION TRENDS SUPPLY VALUE ALMONDS AMAZONIA (BRAZIL) NUTS CASHEWS PISTACHIOS WALNUTS PEANUTS DATES 05 06 09 13 14
HAZELNUTS MACADAMIAS PECANS PINE NUTS INTRODUCTION WORLD PRODUCTION PRODUCTION AND CONSUMPTION TRENDS SUPPLY VALUE ALMONDS AMAZONIA (BRAZIL) NUTS CASHEWS PISTACHIOS WALNUTS PEANUTS DATES 05 06 09 13 14
MONTHLY COFFEE MARKET REPORT
 E MONTHLY COFFEE MARKET REPORT July 2012 Coffee prices rebounded in July 2012, with the ICO composite indicator increasing by 9.5% compared to June, following nine consecutive months of price falls. The
Chapter 3 PERFORMANCE OF SPICES TRADE IN INDIA AND KERALA
 Chapter 3 PERFORMANCE OF SPICES TRADE IN INDIA AND KERALA India occupies a prominent position in the world spice trade. In the estimated world trade of species of 8,50,000 tonnes valued at US$ 2,200 millions,
Coffee: World Markets and Trade
 United States Department of Agriculture Foreign Agricultural Service Circular Series December 213 Coffee: World Markets and Trade 4 in Producing Countries to Continue Rising Million 6 Kilogram Bags 3 2
THIS REPORT CONTAINS ASSESSMENTS OF COMMODITY AND TRADE ISSUES MADE BY USDA STAFF AND NOT NECESSARILY STATEMENTS OF OFFICIAL U.S.
 THIS REPORT CONTAINS ASSESSMENTS OF COMMODITY AND TRADE ISSUES MADE BY USDA STAFF AND NOT NECESSARILY STATEMENTS OF OFFICIAL U.S. GOVERNMENT POLICY Required Report - public distribution Date: GAIN Report