SINGAPORE. Summary Table: Import of Fresh fruits and Vegetables in Fresh fruit and Vegetables Market Value $000 Qty in Tons
|
|
|
- Caroline Walton
- 5 years ago
- Views:
Transcription
1 SINGAPORE A. MARKET FOR FRESH FRUIT AND VEGETABLES 1. Market Trend and Opportunities Summary Table: Import of Fresh fruits and Vegetables in Fresh fruit and Vegetables Market Products/ Other Info. Product 2002 Value $000 Qty in Tons Import Growth in Average Yearly Unit Price 2006 Value $000 Qty in Tons 93 Value Change % in 2006 Value Qty Value Qty Value Qty Major Sources and Share in % and other information Chilli 7,455 11,379 12,232 13,255 64% 17% Malaysia (59%), Vietnam (23%), Thailand (7%) 2002 $ 655/ton 2003 $ 695/ton 2004 $ 716/ton 2005 $ 868 /ton 2006 $ 922/ton Grapes 21,468 12,503 27,875 12,166 29% -3% USA (39%), Australia (35%), Import Growth in Average Yearly Unit Price South Africa (13%) 2002 $ 731 /ton 2003 $ 1900/ ton 2004 $ 2002 Per ton 2005 $ 2128 Per ton 2006 $2291 Per ton Mango 13,263 29,730 14,110 16,027 6% -46% Thailand (45%), Malaysia Import Growth in Average Yearly Unit Price (15%), Australia (10%) 2002 US $ 446 per ton 2003 US $ 744 per ton 2004 US $ 709 per ton 2005 US $ 760 per ton 2006 US $ 880 per ton Onions 10,398 44,141 14,790 43,887 42% -1% India (30%), Malaysia (22%), Import Growth in Average Yearly Unit Price Import Growth in China ( 10%) 2002 US $ 235 per ton 2003 US $ 296 per ton 2004 US $ 300 per ton 2005 US $ 316 per ton 2006 US $ 337 per ton Tomato 12,139 19,554 13,605 24,007 12% 22% Malaysia (85%), Thailand (6.2%), Australia (4%) Average Yearly Unit Price 2002US $ 620 per ton 2003 US $ 573 per ton 2004 US $ 567 per ton 2005 US $ 693 per ton 2006 US $ 566 per ton The summary table shows that for major fresh fruits and vegetables the imports market is in decreasing trend. Unit price of all products has increased in 5 years. The market for Chilli is growing slowly and the import value of Chilli has increased by 64% in 5 yrs time. The import market for Grapes decreased by 3 % in quantity but the price of the grapes has increased by
2 29%. Similarly for mango the import quantity decreased by 46% in 5 years and value is increased by 6%. Onion import value is increased by 42% whereas the import quantity has decreased by 1%. And for tomato market has increased in terms of value by 12% and in quantity by 22%. 2. Import Analysis Chillies In 2006 Singapore imported 13,255 tons of chili amounting to US$ 12.2 million, representing an increase by 15 % over the year The import of chili into Singapore has been increasing trend i.e.7139 in the year 2002 to in Singapore imports chili from around 10 different countries and among them Malaysia is one of the major exporter and trading partners of Singapore in chili. In 2006 Malaysia alone exported 7177 thousands of chilli to Singapore which is 58.7% of the total value imported. India has also been exporting chili to Singapore from the year 2002 i.e. 1 thousand to 29 thousand tons in The other top exporters of Chillies to Singapore are Vietnam accounting for 22.7% (of the total imported value), Thailand (7.3%), China (5%), and Indonesia (5%). The annual import growths of chili over the period of 5 yrs in Singapore are 14% and 5% in terms of value and quantity respectively. The average unit price for the imported chili in 2006 was US$923. There has been an increase in the quantity imports of chili i.e tons in 2002 to tons in The monthly data import of chili for Singapore indicates that Malaysia has been the major exporter. December 2007 is the month which has the highest imports over the whole year i.e1442 thousands and 1271 tons. Average monthly unit price is presented in Chart below: Grapes In 2006 Singapore imported 2166 tons of grapes amounting to US$ 27.9 million, representing an increased in value by 8% over the year The import of grapes in Singapore has been increasing trend i.e in the year 2002 to in Singapore imports grapes from 94
3 around 18 different countries and among them India is also one of the trading partners. In 2006 India alone exported 81 thousands of grapes to Singapore which is quite minimal as compared to other nations. India has been exporting grapes to Singapore from the year 2002 the highest value stand in the year 2004 i.e.106 thousand. The other top exporters of grapes to Singapore are: United States of America stands as the largest source of import accounting for 38.3% (of the total imported value) followed by Australia (34.8 % ), South Africa (12.9%), and Chile (5.5%). The annual import growth of grapes over the period of 5 yrs in Singapore is 7% and 0 % in terms of value and quantity respectively. The average unit price for the imported grapes in 2006 was US$2291. There has been an increase in the quantity imports of grapes i.e tons in 2002 to tons in The monthly data import of grapes for Singapore indicates that South Africa has been the major exporter. November 2007 is the month which has the highest imports over the whole year i.e thousands (in value) and 1,423 tons. Average monthly import prices of Grapes are presented below: Unit Price Calculation Unit Price 'World 'Australia 'South Africa 2007-M M M M M M M M M M M M03 Month Mango In 2006 Singapore imported 16,027 thousand tons of mangoes amounting to US$ thousands. This represents the value imported by 14.33% over the year The import of mangoes in Singapore has been increasing minimally i.e in the year 2002 to14110 in Singapore imports mangoes from around 15 different countries and among them India is also one of the trading partners. In 2006 India alone exported 604 thousands of mangoes to Singapore. The export trend has been in the steady rate. The other top exporters of mangoes to Singapore are: Thailand stands as the largest source of import accounting for 45 % both in terms of value and volume. The other major exporters of mango to the country are Malaysia (14.6%), Australia (10.5%) Philippines (10%) Taiwan (4.8%) 95
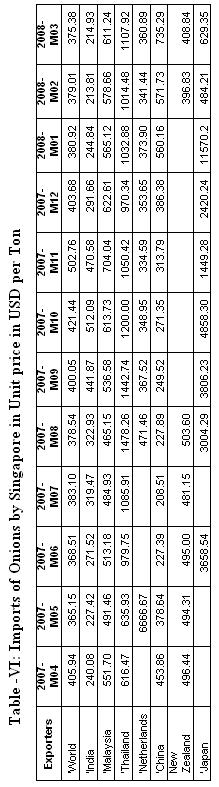
4 The annual import growth of mangoes over the period of 5 yrs in Singapore is 1% and -12% in terms of value and quantity respectively. The average unit price for the imported mangoes is US$ 880. There has been a decrease in the quantity imports of mangoes i.e tons in 2002 to tons in The monthly import data of mangoes in Singapore indicates that Thailand has been the major exporter. July 2007 is the month which has the highest imports over the whole year i.e thousands and 600 tons. Average monthly prices are presented in graph below. Unit Price 6000 Unit Price M M M M M M02 'World 'Thailand 'Malaysia 'Philippines Month Onions In 2006 Singapore imported tons of onion amounting to US$ thousands. This represents an increase in import value 10% over the year 2005.The import of onion in Singapore has been increasing trend i.e in the year 2002 to in Singapore imports onions from around 15 different countries and among them India is one of the major exporter and trading partners of Singapore in onions.. In 2006 India alone exported 4417 thousands of onions to Singapore which is 29.9% of the total value imported. India has been exporting commercial quantities of onions to Singapore from the year 2002 i.e that increased to 22942in The other top exporters of onions to Singapore are Malaysia accounting for 22.3 % of the total imported value, followed by China 9.8 %,Indonesia (9.6%), and Thailand (8.6%) The annual import growth of onions over the period of 5 yrs in Singapore is 8% and 0 % in terms of value and quantity respectively. The average unit price for the imported onions in 2006 was US$ 337. There has been an increase in the quantity imports of onions i.e tons in 2002 to tons in The monthly data import of onions for Singapore indicates that India has been the major exporter. December 2007 is the month which has the highest imports over the whole year i.e tons. But November has the highest value i.e thousand of onions. 96
5 Unit Price in USD per Ton Unit Price 'World 'India 'Malaysia 'Thailand Month Tomato In 2006 Singapore imported 24,007 thousand tons of tomatoes amounting to US$ thousands. This represents the value imported by 4% over the year The import of tomatoes in Singapore has been increasing minimally i.e in the year 2002 to in Singapore imports tomatoes from around 13 different countries and among them India is also one of the trading partners. In 2006 India alone exported 1 thousands of mangoes to Singapore which is quite minimal. India has been exporting tomatoes to Singapore from the year 2002 itself which stood 12 thousand. The other top exporters of tomatoes to Singapore are: Malaysia stands as the largest source of import accounting for 84.4 % (of the total imported value). The other major exporters of tomatoes to the country are Thailand (6.2% of the total import value.), Australia (4%), and Netherlands (3.2%), New Zealand (0.6%) The annual import growth of tomatoes over the period of 5 yrs in Singapore is 4% in terms of value as well as quantity. The average unit price for the imported tomatoes in 2006 was US$ 567. There has been an increase in the quantity imports of tomatoes i.e tons in 2002 to tons in The monthly data import of tomatoes for Singapore indicates that Malaysia has been the major exporter. August 2007 is the month which has the highest imports over the whole year i.e thousands (in value) and tons. Monthly unit prices are presented in the Chart below: 97
6 Unit Price Calculation Unit Price M M M M M M M M M M M M03 'World 'Malaysia 'Australia 'Thailand Month 98
7 Detailed tables a. Chillies Table -I: Import of Chilli by Singapore in Value in USD thousands Exporters 'World 7,139 7,455 7,398 8,136 10,630 12,232 'Malaysia 5,785 5,788 5,327 5,377 7,141 7,177 'Viet Nam ,149 1,679 2,775 'Thailand 1, , 'China 'Indonesia 'Japan 'Australia 'India 'United States of America 'Netherlands 'Bangladesh 'Sri Lanka Table -II: Import of Chilli by Singapore in Quantity in Tons Exporters 'World 11,815 11,379 10,634 11,352 12,245 13,255 'Malaysia 10,286 9,508 8,248 7,901 8,411 8,516 'Viet Nam ,548 1,776 2,522 'Thailand 1,263 1,020 1,245 1,504 1,410 1,169 'China 'Indonesia 'India 'Australia 'Japan
8 100
9 101
10 b. Grapes Table -I: Import of Grapes by Singapore in Value in USD thousands Exporters 'World 21,648 22,027 24,911 25,827 27,875 'United States of America 9,678 10,137 11,328 11,958 10,682 'Australia 8,950 7,871 7,544 8,246 9,703 'South Africa 1,989 1,985 3,229 3,411 3,591 'Chile , ,544 'Peru 'China 'Israel 'Saudi Arabia 'Egypt 'Japan 'Republic of Korea 'Taiwan, Province of China 'India 'Argentina Table- II: Import of Grapes by Singapore in Quantity in Tons Exporters 'World 12,503 11,593 12,443 12,136 12,166 'USA 5,341 5,163 5,294 5,693 4,484 'Australia 5,249 4,101 3,937 3,794 4,073 'South Africa 1,171 1,051 1,533 1,496 1,666 'Chile 'Peru 'China 'Israel 'Saudi Arabia 'Egypt 'Argentina 'India 'Taiwan, ' Korea R
11 103
12 104
13 c. Mangoes Table -I: Import of Mangoes by Singapore in Value in USD thousands Exporters 'World 13,263 13,230 13,008 12,341 14,110 'Thailand 4,193 3,203 4,861 5,229 6,355 'Malaysia 3,591 2,836 2,855 2,538 2,064 'Australia 2,117 1,640 1,226 1,428 1,478 'Philippines ,097 1,408 'Taiwan 1,528 2,922 1, 'India 'Indonesia 'China 'Pakistan 'Peru 'Israel 'South Africa Table -II: Imports of Mangoes by Singapore in Quantity in Tons Exporters 'World 29,730 17,768 18,323 16,217 16,027 'Thailand 17,858 4,566 7,203 7,466 7,882 'Malaysia 7,728 6,390 7,268 6,309 4,863 'Taiwan 1,769 4,032 1, 'Australia 1, 'Philippines 'Indonesia 'India 'China 'Pakistan 'Peru 'Israel 'South Africa
14 106
15 107
16 d. Onions Table -I: Import of Onions by Singapore in Value in USD thousands Exporters 'World 10,398 12,350 12,264 13,449 14,790 'India 3,434 3,754 4,185 3,895 4,417 'Malaysia 2,461 2,564 2,808 3,186 3,294 'China 611 1, ,275 1,456 'Indonesia 0 1,392 1,259 1,312 1,420 'Thailand ,269 'New Zealand , 'Netherlands 732 1, 'United States of America 'Philippines Table -II: Import of Onions by Singapore in Quantity in Tons Exporters 'World 44,141 41,586 40,778 42,535 43,887 'India 19,617 20,075 20,450 18,276 22,942 'Malaysia 8,335 5,956 6,419 6,715 6,565 'China 2,349 4,653 1,744 5,254 4,046 'Netherlands 3,248 3,704 3,274 4,326 2,240 'New Zealand 3,243 2,127 4,074 1,333 1,914 'Indonesia 0 1,886 1,775 1,318 1,401 'United States of America ,318 'Thailand 1, ,086 1,304 'Australia 1, 'Pakistan , 'Philippines 536 1,
17 109
18 110
19 111
20 e. Tomatoes Table -I: Import of Tomatoes by Singapore in Value in USD thousands Exporters Imported value in 2002 Imported value in 2003 Imported value in 2004 Imported value in 2005 Imported value in 2006 'World 12,139 11,937 11,963 14,656 13,605 'Malaysia 9,626 9,968 10,292 12,821 11,476 'Thailand 'Australia 'Netherlands 'New Zealand 'China 'Japan 'Indonesia 'Italy 'United States of America 'France 'Viet Nam Table- II: Import of Tomatoes by Singapore in Quantity in Tons Exporters Imported Imported Imported Imported Imported quantity, quantity, quantity, quantity, quantity, Tons Tons Tons Tons Tons 'World 19,554 20,819 21,068 21,121 24,007 'Malaysia 16,224 18,577 19,217 19,369 22,575 'Thailand 1,448 1,025 1, 'Australia 'Netherlands 'China 'Indonesia 'New Zealand 'Japan 'Viet Nam 'Italy 'United States of America 'Belgium
21 113
22 114
KUWAIT. Similarly there is a decreasing trend for other fresh fruits products like grapes and lychee. India shared 37.6% of import market in Kuwait.
 KUWAIT A. MARKET FOR FRESH FRUITS AND FRESH VEGETABLES 1. Market Trend and Opportunities: Fresh Fruits The market for fresh fruits in Kuwait has a downward trend. Bananas import volume decreased by 34%
PHILIPPINES. 1. Market Trends: Import Items Change in % Major Sources in %
 PHILIPPINES A. MARKET OF FRESH FRUITS & VEGETABLES 1. Market Trends: Import Items 2003 2007 Change in % Major Sources in % Value Quantity Value Quantity Value Quantity USD '000 Tons USD '000 Tons Grapes
Fresh Deciduous Fruit (Apples, Grapes, & Pears): World Markets and Trade
: World Markets and Trade") Fresh Deciduous Fruit (Apples, Grapes, & Pears): World Markets and Trade June 21 APPLES Record Production but Trade Estimate Revised Downward The world production estimate for 29/1 is virtually unchanged
Fresh Deciduous Fruit (Apples, Grapes, & Pears): World Markets and Trade June 21 APPLES Record Production but Trade Estimate Revised Downward The world production estimate for 29/1 is virtually unchanged
Food Additive Produced by IAR Team Focus Technology Co., Ltd
 Food Additive 2012.03 Produced by IAR Team Focus Technology Co., Ltd Contents 1. 2009-2011 Chinese Citric Acid Export Data Analysis... 3 2009-2011 Major Importers of Chinese Citric Acid...4 2. 2009-2011
Tuna Trade. Fatima Ferdouse
 Tuna Trade Fatima Ferdouse HIGHLIGHTS East Asia is the world s largest processing and exporting region for canned tuna. Producing countries in the region also depend on imported raw materials The fluctuating
FRANCE A. MARKETS FOR FRESH FRUITS AND VEGETABLES. 1.Market Trends and Opportunities. 1.1 Market Opportunities
 FRANCE A. MARKETS FOR FRESH FRUITS AND VEGETABLES 1.Market Trends and Opportunities 1.1 Market Opportunities France is the third largest importer and the large consumer market of fresh fruits and vegetables
Monitoring EU Agri-Food Trade: Development until October 2018
 Monitoring EU Agri-Food Trade: Development until October 2018 October 2018: best EU agri-food export performance ever The monthly value of EU agri-food trade in October 2018 was second biggest ever recorded
Monitoring EU Agri-Food Trade: Development until March 2018
 Monitoring EU Agri-Food Trade: Development until March 2018 14.000 EU28: Export to Extra-EU of Agri-Food Products 13.000 12.000 11.000 10.000 2018 2017 2015 2016 2014 9.000 8.000 7.000 6.000 Jan Feb Mar
Blow Molding Machine Produced by IAR Team Focus Technology Co., Ltd
 Blow Molding Machine 2012.08 Produced by IAR Team Focus Technology Co., Ltd Contents 1. 2009-2011 Chinese Blow Molding Machines Export Trend Analysis...3 2009-2011 Chinese Blow Molding Machines Export
Monitoring EU Agri-Food Trade: Development until April 2017
 Monitoring EU Agri-Food Trade: Development until April 2017 April 2017: Agri-food exports back to average values The monthly value of EU agri-food exports in April 2017 reached a value of EUR 10.6 billion,
Monitoring EU Agri-Food Trade: Development until March 2017
 Monitoring EU Agri-Food Trade: Development until March 2017 March 2017: record value in monthly agri-food exports at EUR 12.7 billion The monthly value of EU agri-food exports in March 2017 reached a value
Fresh Deciduous Fruit (Apples, Grapes, & Pears): World Markets and Trade
: World Markets and Trade") Million MT United States Department of Agriculture Foreign Agricultural Service December 21 Fresh Deciduous Fruit (Apples, Grapes, & Pears): World Markets and Trade 21/11 Forecast: World Apple Trade Declines;
Million MT United States Department of Agriculture Foreign Agricultural Service December 21 Fresh Deciduous Fruit (Apples, Grapes, & Pears): World Markets and Trade 21/11 Forecast: World Apple Trade Declines;
Asia Pacific Tuna Trade. Shirlene Maria Anthonysamy INFOFISH Pacific Tuna Forum 2017 Papua New Guinea
 Asia Pacific Tuna Trade Shirlene Maria Anthonysamy INFOFISH Pacific Tuna Forum 217 Papua New Guinea JAPANESE MARKET Demand for sashimi tuna remains highly seasonal strengthening during the spring festivals
Monitoring EU Agri-Food Trade: Development until November 2016
 Monitoring EU Agri-Food Trade: Development until November 2016 November 2016 EU agri-food exports again at record level The monthly value of EU agri-food exports in November 2016 reached a new record level
Monitoring EU Agri-Food Trade: Development until June 2017
 Monitoring EU Agri-Food Trade: Development until June 2017 June 2017: Agri-food exports again above previous years level After a rebound in May, the monthly value of EU agri-food exports went down to EUR
GERMANY A. MARKETS FOR FRESH FRUITS AND VEGETABLES. 1. Market Trends and Opportunities. 1.1 Market Opportunities
 GERMANY A. MARKETS FOR FRESH FRUITS AND VEGETABLES 1. Market Trends and Opportunities 1.1 Market Opportunities Major items produced in Germany are apples, grapes (mostly used for wine making), plums, pears,
AMERICAN PECAN COUNCIL. Shipments and Inventory on Hand. For the One Month Ended November 30, 2018
 Shipments and Inventory on Hand Shipments: Total Shelled Meats 15,791,127 Inshell 3,035,663 Total Shipments (Inshell Basis) 34,617,917 Total Pecans in Inventory: Shelled Meats 43,994,659 Inshell 48,911,798
Monitoring EU Agri-Food Trade: Development until August 2017
 Monitoring EU Agri-Food Trade: Development until August 2017 August 2017: Agri-food exports continue strong The monthly value of EU agri-food exports rose slightly to EUR 11.5 billion in August 2017, a
Ceramic Sanitary Ware Produced by IAR Team Focus Technology Co., Ltd.
 Ceramic Sanitary Ware 2013.04 Produced by IAR Team Focus Technology Co., Ltd. Contents 1. Chinese Ceramic Sanitary Ware Industry Exports Analysis...4 1.1. 2010-2012 Chinese Ceramic Sanitary Ware Export
Monitoring EU Agri-Food Trade: Development until December 2015
 Monitoring EU Agri-Food Trade: Development until December 2015 December 2015 - EU agri-food exports again higher than in previous years EU agri-food exports in December 2015 achieved a value of EUR 11.2
Monitoring EU Agri-Food Trade: Development until September 2018
 Monitoring EU Agri-Food Trade: Development until September 2018 September 2018: Slowdown in EU export performance; imports from Brazil and US still on the rise The monthly value of EU agri-food trade in
Plastic Machinery Produced by IAR Team Focus Technology Co., Ltd.
 2010-2013 Plastic Machinery 2014.02 Produced by IAR Team Focus Technology Co., Ltd. Contents 1. 2010-2012 Chinese Plastic Machinery Export Trend Analysis...3 1.1. 2010-2012 Chinese Plastic Machinery Export
Monitoring EU Agri-Food Trade: Development until December 2016
 Monitoring EU Agri-Food Trade: Development until December 2016 EU agri-food exports at highest annual level ever: EUR 130.7 billion The annual value of EU agri-food exports in 2016 reached a new record
Monitoring EU Agri-Food Trade: Development until October 2016
 Monitoring EU Agri-Food Trade: Development until October 2016 October 2016 EU agri-food exports stabilise at high level The monthly value of EU agri-food exports in October 2016 stabilised at EUR 11.4
Monitoring EU Agri-Food Trade: Development until August 2018
 Monitoring EU Agri-Food Trade: Development until August 2018 August 2018: Export performance remains stable; imports from US continue to increase The value of EU agri-food trade in the month of August
Monitoring EU Agri-Food Trade: Development until January 2018
 Monitoring EU Agri-Food Trade: Development until January 2018 January 2018: good start of a year for EU agri-food exports The value of EU agri-food exports in January 2018 kept its very high level, now
Fresh Deciduous Fruit (Apples, Grapes, & Pears): World Markets and Trade
: World Markets and Trade") United States Department of Agriculture Foreign Agricultural Service Fresh Deciduous Fruit (Apples, Grapes, & Pears): World Markets and Trade 9 1, MT Deciduous Fruit on Seasonal Cycles 6 Northern Hemisphere
United States Department of Agriculture Foreign Agricultural Service Fresh Deciduous Fruit (Apples, Grapes, & Pears): World Markets and Trade 9 1, MT Deciduous Fruit on Seasonal Cycles 6 Northern Hemisphere
The Potential Role of Latin America Food Trade in Asia Pacific PECC Agricultural and Food Policy Forum Taipei
 The Potential Role of Latin America Food Trade in Asia Pacific 2011 PECC Agricultural and Food Policy Forum Taipei Universidad EAFIT, Colombia December 2, 2011 1 CONTENTS 1. Introduction 2. Food Trade
AMERICAN PECAN COUNCIL. Shipments and Inventory on Hand. For the One Month and Five Months Ended January 31, 2019
 Shipments and Inventory on Hand One Month Five Months Shipments: Shelled Meats Retail/Grocery/Export 11,247,569 65,205,488 Inter-handler Transfers Shipped 28,470 3,650,972 Inter-handler Transfers Received
Are we loosing the young generation? Amund Bråthen Senior Advisor Estoril February 7 th 2019
 Are we loosing the young generation? Amund Bråthen Senior Advisor Estoril February 7 th 2019 A MAJOR PART OF WPP, THE WORLD S LARGEST MARKETING COMMUNICATIONS GROUP ADVERTISING & MEDIA HEALTHCARE PR &
AMERICAN PECAN COUNCIL. Pecan Industry Position Report. For the Crop Year Ended August 31, 2018
 Pecan Industry Position Report INTER-HANDLER TRANSFERS OF PECANS Total Inshell Pounds Transferred: Improved 109,898,013 Native/Seedling 14,813,988 Substandard 16,809,311 Total 141,521,312 YEAR-END INVENTORY
Monitoring EU Agri-Food Trade: Development until January 2016
 Monitoring EU Agri-Food Trade: Development until January 2016 January 2015 - EU agri-food exports in line with seasonal trend EU agri-food exports in January 2016 were worth EUR 9.3 billion, thus just
World Yoghurt Market Report
 World Yoghurt Market Report 2000-2020 Price: 1,800 /$2,200 The report contains 330 pages of valuable information Analysis of the current market situation and future possibilities in all regions of the
Major California Agricultural Exports to the Top Destinations in 1999* (1) Canada Rank Approximate Export Value (millions)
 Canada Rank Approximate Export Value (millions)") (1) Canada Rank Approximate Export Value (millions) Table Grapes 1 119 Tomatoes, Processed 2 115 Lettuce 3 102 Wine 4 84 Strawberries 5 78 Carrots 6 50 Tomatoes, Fresh 7 43 Peaches/Nectarines 8 42 Broccoli
(1) Canada Rank Approximate Export Value (millions) Table Grapes 1 119 Tomatoes, Processed 2 115 Lettuce 3 102 Wine 4 84 Strawberries 5 78 Carrots 6 50 Tomatoes, Fresh 7 43 Peaches/Nectarines 8 42 Broccoli
2013Q2 Daily Chemical Produced by IAR Team Focus Technology Co., Ltd.
 2013Q2 Daily Chemical 2013.10 Produced by IAR Team Focus Technology Co., Ltd. Contents 1. China Daily Chemical Industry Export Trend Analysis... 3 1.1. China Soap Export Trend Analysis from Jan. to June
Comparison across international sources of the value of exports for top 25 countries, 1992 (US$ billion )
") Table 1 Comparison across international sources of the value of exports for top 25 countries, 1992 (US$ billion ) FAO WB IFS UN WB b.o.p. United States 448.2 448.0 448.2 444.2 440.4 Germany 429.7 422.0
Table 1 Comparison across international sources of the value of exports for top 25 countries, 1992 (US$ billion ) FAO WB IFS UN WB b.o.p. United States 448.2 448.0 448.2 444.2 440.4 Germany 429.7 422.0
INTERNATIONAL DAIRY PRODUCTS COUNCIL. Reply to Questionnaire 4. Australia (1988/89) I. Milk. A. Production and Utilization of Milk
 I. Milk. A. Production and Utilization of Milk") GENERAL AGREEMENT ON TARIFFS AND TRADE ACCORD GENERAL SUR LES TARIFS DOUANIERS ET LE COMMERCE ACUERDO GENERAL SOBRE ARANCELES ADUANEROS Y COMERCIO RESTRICTED DPC/STAT/12/Add.20 29 September 198 9 International
GENERAL AGREEMENT ON TARIFFS AND TRADE ACCORD GENERAL SUR LES TARIFS DOUANIERS ET LE COMMERCE ACUERDO GENERAL SOBRE ARANCELES ADUANEROS Y COMERCIO RESTRICTED DPC/STAT/12/Add.20 29 September 198 9 International
MARKETING WINE: DEVELOPING NEW MARKETS IN ASIA
 MARKETING WINE: DEVELOPING NEW MARKETS IN ASIA MARKETING WINE: DEVELOPING NEW MARKETS IN ASIA GEOGRAPHY OF MARKETS IN ASIA INDIA CHINA HONG KONG MACAO THAILAND VIETNAM SINGAPORE MALAYSIA SOUTH KOREA TAIWAN
Global Trade in Mangoes
 Global Trade in Mangoes October 2014 Jim Lang Managing Director TradeData International Pty Ltd jim.lang@tradedata.net www.tradedata.net COUNTRIES WITH MONTH IMPORT STATISTICS 1. The global market is just
WINE EXPORTS. February Nadine Uren. tel:
 WINE EXPORTS February 2012 Nadine Uren tel: +27 21 807 5707 e-mail: nadine@sawis.co.za OVERVIEW OF WINE EXPORTS HIGHLIGHTS Exports as a percentage of wine production decreased from 48.5% in 2010 to 43.2%
ANALYSIS ON THE STRUCTURE OF HONEY PRODUCTION AND TRADE IN THE WORLD
 ANALYSIS ON THE STRUCTURE OF HONEY PRODUCTION AND TRADE IN THE WORLD GU G., ZHANG Ch., HU F.* Department of Sericulture and Apiculture, College of Animal Science Zhejiang University, Hangzhou 310029, CHINA
January 2015 WORLD GRAPE MARKET SUPPLY, DEMAND AND FORECAST
 January 2015 WORLD GRAPE MARKET SUPPLY, DEMAND AND FORECAST Table of Contents Executive Summary... 4 1. VARIETIES OF GRAPES... 6 1.1. White table grapes... 6 1.2. Red table grapes... 6 2. WORLD DEMAND
International Table Grape Symposium November 2014 Australian Table Grapes Jeff Scott Chief Executive Officer
 International Table Grape Symposium November 2014 Australian Table Grapes Jeff Scott Chief Executive Officer Australian Table Grape Industry - Snapshot There are approximately 900 table grape growers throughout
Citrus: World Markets and Trade
 Department of Agriculture eign Agricultural Service January Citrus: World Markets and Trade Citrus: / ecast Global Orange Production and Trade Expand Global production and trade for is forecast at. million
AMAZONIA (BRAZIL) NUTS MACADAMIAS HAZELNUTS PISTACHIOS WALNUTS PINE NUTS PECANS
 NUTS MACADAMIAS HAZELNUTS PISTACHIOS WALNUTS PINE NUTS PECANS") HAZELNUTS MACADAMIAS PECANS PINE NUTS INTRODUCTION WORLD PRODUCTION PRODUCTION AND CONSUMPTION TRENDS SUPPLY VALUE ALMONDS AMAZONIA (BRAZIL) NUTS CASHEWS PISTACHIOS WALNUTS PEANUTS DATES 05 06 09 13 14
HAZELNUTS MACADAMIAS PECANS PINE NUTS INTRODUCTION WORLD PRODUCTION PRODUCTION AND CONSUMPTION TRENDS SUPPLY VALUE ALMONDS AMAZONIA (BRAZIL) NUTS CASHEWS PISTACHIOS WALNUTS PEANUTS DATES 05 06 09 13 14
GAIN Report Global Agriculture Information Network
 Foreign Agricultural Service GAIN Report Global Agriculture Information Network Voluntary Report - public distribution Date: 5/26/2000 China, Peoples Republic of GAIN Report #CH0612 Trade data - Multiple
Agri-Food Exports. Alberta to 2014 Economics and Competitiveness. Highlights on Alberta Agri-Food Exports in Tables:
 Agri-Food Exports Alberta 2005 to 2014 Economics and Competitiveness Highlights on Alberta Agri-Food Exports in 2014 Tables: Alberta Agri-Food Exports, 2005-2014: - Top 5 Export Products and Markets -
Milk and Milk Products. Price and Trade Update. Weekly Newsletter. Milk and Milk Products. Price and Trade Update: April
 April Milk and Milk Products Price and Trade Update Weekly Newsletter Milk and Milk Products Price and Trade Update: April 1 PRICES: Remain depressed International dairy product prices began the year at
SAMPLE FILE USA Exports of Powdered milk, fat<= 1.5%
 Mexico Philippines Indonesia China Viet Nam Malaysia Pakistan Peru Egypt Chile Others Total SAMPLE FILE USA Exports of Powdered milk, fat
Bearing Produced by IAR Team Focus Technology Co., Ltd.
 Bearing 2013.06 Produced by IAR Team Focus Technology Co., Ltd. Contents 1. Bearing Industry Exports of 2012... 3 1.1. China Bearing Industry Export Classification Tables of 2012... 3 1.2. China Ball or
2013 Office Supplies Industry Annual Report
 2013 Office Supplies Industry Annual Report 2014.08. Catalog 1. China Office Supplies Export Enterprises Distribution... 4 1.1. China Fittings for loose leaf binders, staples and other office supplies
Outline. Long-term Outlook for Cotton Consumption. World End-Use Consumption of Textile Fibers. World Consumption of Textile Fibers
 World Cotton Supply and Use International Cotton Advisory Committee Secretariat Outline! Long-term Outlook for Consumption! Outlook for /! Developments in World Cotton Trade Fifth Open Session: Cotton
Milk and Milk Products: Price and Trade Update
 Milk and Milk Products: Price and Trade Update June 217 * International dairy prices The FAO Dairy Price Index averaged 29 points in June, up 16 points (8.3 percent) from January 217 and 71 points (51.5
P E C A N R E P O R T
 P E C A N R E P O R T Agricultural Marketing Service 16 Forest Parkway Specialty Crops Programs Building 1-218 Market News Division Forest Park, Georgia 30297 Phone (404) 361-1376 FAX (404) 363-2523 Pecan
China s Export of Key Products of Pharmaceutical Raw Materials
 China s Export of Key Products of Pharmaceutical Raw Materials During the period of the 62nd API China& INTERPHEX CHINA, China Pharmaceutical Industry Association released its annual Report on Analysis
DEVELOPMENTS IN STEEL SCRAP IN 2009
 DEVELOPMENTS IN STEEL SCRAP IN 2009 AMERICAN SCRAP COALITION WASHINGTON, DC DEVELOPMENTS IN STEEL SCRAP 2009 The year 2009 demonstrated that the United States continues to experience a crisis with respect
SAMPLE FILE - Thailand Exports of Fresh mangoes
 Viet Nam Malaysia South Korea China Japan Laos Singapore Hong Kong Myanmar Indonesia Others Total Page 1 November 6, 2017 SAMPLE FILE Thailand Exports of Fresh mangoes The purpose of this paper is to show
Deliveries to dairies 198/86 GENERAL AGREEMENT ON TARIFFS AND TRADE. Consurption of fresh milk (including exports) 1985/86. Industrial uses 1985/86
 1985/86. Industrial uses 1985/86") GENERAL AGREEMENT ON TARIFFS AND TRADE RESTRICTED DPC/STAT/12/Add. 14 23 September 1986 International Dairy Arrangement INTERNATIONAL DAIRY PRODUCTS Reply to Questionnaire 4 AUSTRALIA COUNCIL (Financial
GENERAL AGREEMENT ON TARIFFS AND TRADE RESTRICTED DPC/STAT/12/Add. 14 23 September 1986 International Dairy Arrangement INTERNATIONAL DAIRY PRODUCTS Reply to Questionnaire 4 AUSTRALIA COUNCIL (Financial
World Cocoa Prices. Commodity Prices Update: Coffee, Cocoa, and Cotton. Joelle Cook and Professor C. Leigh Anderson
 SDR per tonne Commodity Prices Update: Coffee, Cocoa, and Cotton Joelle Cook and Professor C. Leigh Anderson Prepared for the Agricultural Policy and Statistics Division of the Bill and Melinda Gates Foundation
Monthly Economic Letter U.S. and Global Market Fundamentals
 Monthly Economic Letter U.S. and Global Market Fundamentals August 2012 www.cottoninc.com After trading within relatively narrow bands throughout July, New York futures moved higher in early August, with
Overview of the Manganese Industry
 39th Annual Conference Istanbul, Turkey 2013 Overview of the Manganese Industry International Manganese Institute Alberto Saavedra Market Research Manager June, 2013 Introduction Global Production Supply,
ICC September 2018 Original: English. Emerging coffee markets: South and East Asia
 ICC 122-6 7 September 2018 Original: English E International Coffee Council 122 st Session 17 21 September 2018 London, UK Emerging coffee markets: South and East Asia Background 1. In accordance with
Fruit Production and Export in China
 Fruit Production and Export in China Xiuxin Deng College of Hort. & Forestry Huazhong Agricultural University Wuhan, Hubei 430070 P.R.China The Present Situation of Fruit Production China produced 15.2%
Milk and Milk Products. Price and Trade Update: October
 October Milk and Milk Products Price and Trade Update Weekly Newsletter Milk and Milk Products Price and Trade Update: October 1 INTERNATIONAL PRICES: Weak import demand causes prices to fall International
SAMPLE FILE. Table Top Ten Partner Countries
 China Malaysia Indonesia Philippines Singapore Thailand Saudi Arabia Taiwan Viet Nam Japan Others Total TradeData International Sample Report SAMPLE FILE Monitoring New Zealand Exports of Dairy produce;
Effect of new markets on the supply-demand balance
 Effect of new markets on the supply-demand balance Presentation to ICO Seminar Robert Simmons, LMC International, Oxford, UK www.lmc.co.uk Global coffee consumption has grown at by over 2% per annum over
Alberta Agri-Food Exports, 2008 to 2017 (1)
") Alberta Agri-Food Exports, 2008 to 2017 (1) Table of Content Tables Page 1 Alberta Agri-Food Exports, Top Products and Markets, 2008-2017, Value 1 2 Alberta Agri-Food Exports by Product, 2008-2017, Value
Alberta Agri-Food Exports, 2008 to 2017 (1) Table of Content Tables Page 1 Alberta Agri-Food Exports, Top Products and Markets, 2008-2017, Value 1 2 Alberta Agri-Food Exports by Product, 2008-2017, Value
Table grape. Horticulture trade intelligence. Quarter 1: January to March 2017
 Horticulture trade intelligence A custom report compiled for Hort Innovation by Euromonitor International Table grape Quarter 1: January to March 217 Horticulture trade intelligence: Table grape: 217:
EU Cereals Trade 2014/15 Marketing Year July - June. AGRI C 4 Committee for the Common Organisation of Agricultural Markets 27 August 2015
 EU Cereals Trade Marketing Year July - June AGRI C 4 Committee for the Common Organisation of Agricultural Markets 27 August 215 mio t 6 5 4 3 EU 28 - Cereals exports and imports from 2/1 to including
Economic Role of Maize in Thailand
 Economic Role of Maize in Thailand Hnin Ei Win Center for Applied Economics Research Thailand INTRODUCTION Maize is an important agricultural product in Thailand which is being used for both food and feed
Mango Market Profile
 Mango Market Profile Prepared by: Ministry of Industry, Commerce, Agriculture & Fisheries Agricultural Services Unit Hope Gardens, Kingston 6 Tel: (876)927-1731/Fax: (876)927-1792 Email: marketing@moa.gov.jm
Import Summary Report - Packaging Asia
 Import Summary Report Packaging Asia October 06 Contents. Global Imports. Imports in ASIA. Focus Packaging Categories.. 7. 8. 0. Established Export Destinations. Pakistan. India. Malaysia. Philippines.
United States Is World Leader in Tree Nut Production and Trade
 Special Article United States Is World Leader in Tree Nut and Trade by Doyle C. Johnson Abstract: Crops of all major U.S. tree nuts will be larger in 997. However, beginning stocks of most tree nuts are
The IWSR Global LOCAL KNOWLEDGE, GLOBAL INTELLIGENCE
 2008 The IWSR Global Wine Handbook LOCAL KNOWLEDGE, GLOBAL INTELLIGENCE 2008 The IWSR Disclaimer: While at all times The IWSR tries to ensure that the information presented in the database and reports
YUM! Brands Inc. Restaurant Units Activity Summary June 16, 2012 Total
 Unconsolidated Company Affiliates Franchisees Licensees (a) Worldwide Beginning of Year 7,437 587 26,928 34,952 New Builds 352 28 359 739 Acquisitions 200-275 475 Refranchising (200) - 200 - Closures (56)
Pakistan Surgical Instruments Sector ( )
") 2018 Trade Analysis Series Pakistan Surgical Instruments Sector (2016-17) Trade Analysis Series Turn Potential into Profit! Ministry of Industries and Production Government of Pakistan www.smeda.org.pk
2018 Trade Analysis Series Pakistan Surgical Instruments Sector (2016-17) Trade Analysis Series Turn Potential into Profit! Ministry of Industries and Production Government of Pakistan www.smeda.org.pk
Paper Packaging Practice June Copyright 2015 RISI, Inc. All rights reserved.
 Global Containerboard Outlook Ken Waghorne, VP Paper Packaging Practice June 2015 1 Today s Agenda Regional Containerboard Markets Asia Europe Western Eastern North America Latin America Rest of World
Kurt Huang Shanghai Longwu Market
 Kurt Huang Shanghai Longwu Market Email: khuang@fruitease.com 1380 60.00% 1360 1340 1320 1300 30.89% 36.22% Population(million) 40.53% 39.09% 37.66% 1292.27 Urbanlization 43.90% 42.99% 41.76% 1314.48
Citrus: World Markets and Trade
 United States Department of Agriculture Foreign Agricultural Service Citrus: World Markets and Trade Oranges Global orange production for 2012/13 is forecast to drop over 4 percent from the previous year
DESSERT INSPIRATION FACTS AND FIGURES GLOBAL PRODUCT TRENDS VIOGERM WHEAT GERMS OUR PROPOSALS
 DESSERT INSPIRATION DESSERT INSPIRATION FACTS AND FIGURES GLOBAL PRODUCT TRENDS VIOGERM WHEAT GERMS OUR PROPOSALS 2 FACTS & FIGURES Market value for the top 10 countries in 2012 in millions of euros Total:
2012 EXPORT HIGHLIGHTS BRITISH COLUMBIA AGRIFOODS
 2012 EXPORT HIGHLIGHTS BRITISH COLUMBIA AGRIFOODS REVISED FEBRUARY 2014 Table of Contents British Columbia Agrifoods Export Highlights - 2012... 1 Total BC Agrifoods Exports... 1 Top BC Agrifoods Exports
(As on ) Commodity Profile for Pulses-August, 2017
 Commodity Profile for Pulses-August, 2017") P a g e 1 (As on 30.08.2017) Commodity Profile for Pulses-August, 2017 Contents 1. Pulses estimates for India (2016-17)... 2 2. Domestic Production of Major Pulses... 2 3. Production of Pulses in India...
P a g e 1 (As on 30.08.2017) Commodity Profile for Pulses-August, 2017 Contents 1. Pulses estimates for India (2016-17)... 2 2. Domestic Production of Major Pulses... 2 3. Production of Pulses in India...
YUM! Brands Inc. Restaurant Units Activity Summary December 31, 2011 Total
 Total Unconsolidated Excluding Company Affiliates Franchisees Licensees (a) Total Worldwide Beginning of Year 7,271 525 27,852 35,648 New Builds 749 73 1,058 1,880 Acquisitions 137 - (137) - Refranchising
ACUERDO GENERAL SOBRE ARANCELES ADUANEROS Y COMERCIO INTERNATIONAL DAIRY PRODUCTS COUNCIL. Reply to Questionnaire 4 AUSTRALIA I.
 GENERAL AGREEMENT ON TARIFFS AND TRADE RESTRICTED ACCORD GENERAL SUR LES TARIFS DOUANIERS ET LE COMMERCE?!!P ST^T/ *^dd * 29 ACUERDO GENERAL SOBRE ARANCELES ADUANEROS Y COMERCIO 2 December 1994 Special
Monthly Economic Letter
 Monthly Economic Letter Cotton Market Fundamentals & Price Outlook RECENT PRICE MOVEMENT NY futures experienced volatility recently, with the net effect being a slight increase in prices. The A Index also
World vitiviniculture situation
 World vitiviniculture situation Surface area Grape Wine Global grape production Table and dried grapes Production Consumption Trade 2017 OIV Focus: Vine varietal distribution in the world 2 Global area
Coffee: World Markets and Trade
 United States Department of Agriculture Foreign Agricultural Service Circular Series December 213 Coffee: World Markets and Trade 4 in Producing Countries to Continue Rising Million 6 Kilogram Bags 3 2
GLOBAL DAIRY UPDATE KEY DATES MARCH 2017
 MARCH 2017 GLOBAL DAIRY UPDATE European milk production decreased for the seventh consecutive month, while the US remains strong. The rate of decline in New Zealand production is easing. US exports continue
North America Grains Outlook
 banchero costa North America Grains Outlook (covering wheat and coarse grains) September 2018 bancosta blue studies volume DRY 2018/#12 banchero costa research www.bancosta.com ; research@bancosta.com
DETERMINANTS OF GROWTH
 POLICY OPTIONS AND CHALLENGES FOR DEVELOPING ASIA PERSPECTIVES FROM THE IMF AND ASIA APRIL 19-20, 2007 TOKYO DETERMINANTS OF GROWTH IN LOW-INCOME ASIA ARI AISEN INTERNATIONAL MONETARY FUND Paper presented
Join the Conversation on Twitter: #FreshConnections PRODUCE MARKETING ASSOCIATION
 Join the Conversation on Twitter: #FreshConnections Fresh Connections: Southern Africa Business Opportunities in South East Asia 17-19 August 2016 Content of presentation 1. Overview of the South African
2018 World Vitiviniculture Situation. OIV Statistical Report on World Vitiviniculture
 2018 World Vitiviniculture Situation OIV Statistical Report on World Vitiviniculture Introduction This report has been prepared by the Statistics department of the International Organisation of Vine and
Taiwan Fishery Trade: Import Demand Market for Shrimps. Bith-Hong Ling
 International Symposium Agribusiness Management towards Strengthening Agricultural Development and Trade III : Agribusiness Research on Marketing and Trade Taiwan Fishery Trade: Import Demand Market for
Monthly Economic Letter
 Monthly Economic Letter Cotton Market Fundamentals & Price Outlook RECENT PRICE MOVEMENT After some upward movement in April, most benchmark prices turned lower in early May. After climbing to the upper
Fresh Fruit & Vegetable Export / Import Statistics 2016/17
 Fresh Fruit & Vegetable Export / Import Statistics 2016/17 A statistics resource for fresh produce exporters and importers prepared for the Australian Horticultural Exporters Association by Fresh Intelligence
2015 EXPORT HIGHLIGHTS BRITISH COLUMBIA AGRIFOOD & SEAFOOD
 2015 EXPORT HIGHLIGHTS BRITISH COLUMBIA AGRIFOOD & SEAFOOD Table of Contents BRITISH COLUMBIA AGRIFOOD & SEAFOOD EXPORT HIGHLIGHTS 2015...3 TOTAL VALUE OF B.C. AGRIFOOD & SEAFOOD EXPORTS ($ BILLIONS)...
For personal use only
 SEPTEMBER 216 GLOBAL DAIRY UPDATE European milk production has decreased for the first time since early 215, with volumes in June down 2 compared to last year. Last week we announced our annual results,
Mr. Michal MEJSTŘÍK. Chairman of ICC Czech Republic
 United Arab Emirates Mr. Michal MEJSTŘÍK Chairman of ICC Czech Republic Composition of GDP (2013) * United Arab Emirates federation Area: 83,600 sq km Population: 5,628,805 Capital: Abu Dhabi Languages:
Vegetable Spotlight Broccoli
 Vegetable Spotlight Broccoli Summary Broccoli is Australia s 10 th largest vegetable crop in terms of value, accounting for 3.4% of total vegetable production with a gross value of $101.2 million in 2008/09.
MARKET NEWSLETTER No 93 April 2015
 Focus on OLIVE OIL IMPORT TRENDS IN RUSSIA Russian imports of olive oil and olive pomace oil grew at a constant rate between 2/1 and 213/14 when they rose from 3 62 t to 34 814 t (Chart 1). The only exceptions