International Table Grape Symposium November 2014 Australian Table Grapes Jeff Scott Chief Executive Officer
|
|
|
- Milton Bailey
- 5 years ago
- Views:
Transcription
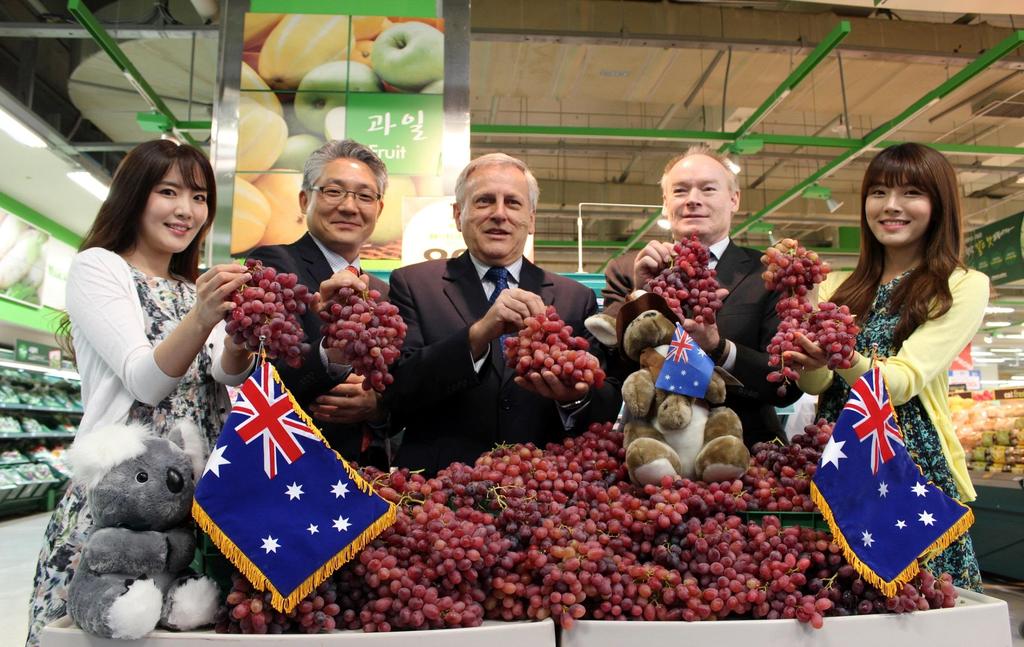
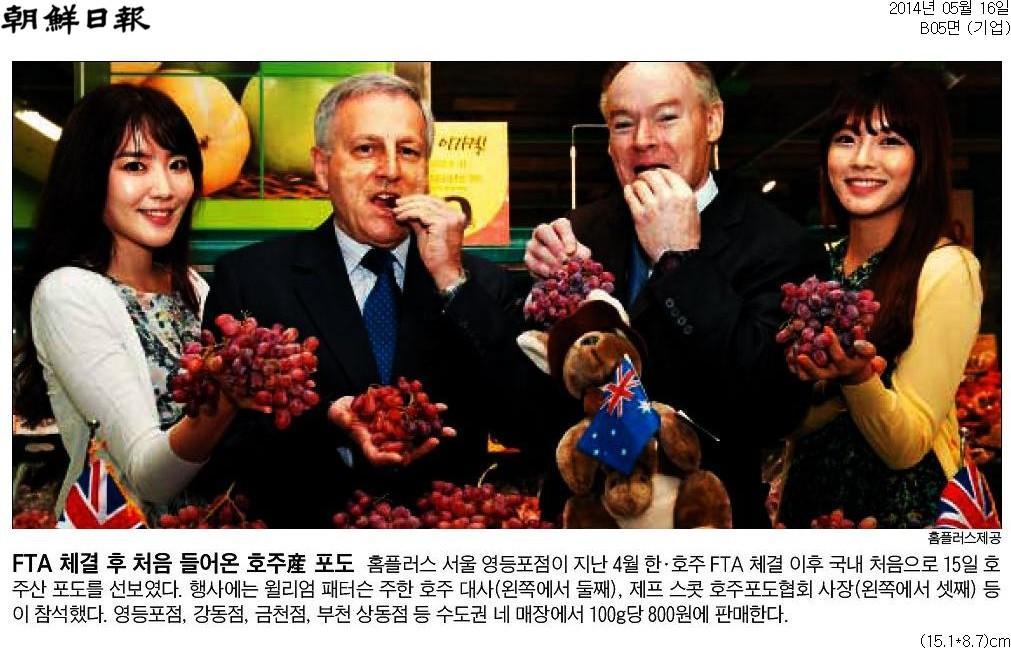
1 International Table Grape Symposium November 2014 Australian Table Grapes Jeff Scott Chief Executive Officer

2 Australian Table Grape Industry - Snapshot There are approximately 900 table grape growers throughout Australia Growers are predominately family owned, 2 nd generation farmers In recent times there has been consolidation of the industry of the industry The average grower has a 20 ha property There are very few large farms of 100 Ha or more Due to the domestic supply experiences in recent years growers are now very much export focused There has been some significant gains in market access in the last three years. 2

3 National production SE Queensland, Emerald, St George and Mundubbera production fills east coast early domestic trade Nov Dec Western Australia produces around 5,000 tonnes for WA market Small though successful crops in Central Australia, Bourke and Menindee in NSW 75% of of National Production is in Victoria s Sunraysia and supplies 99% of exported grapes Jan - June

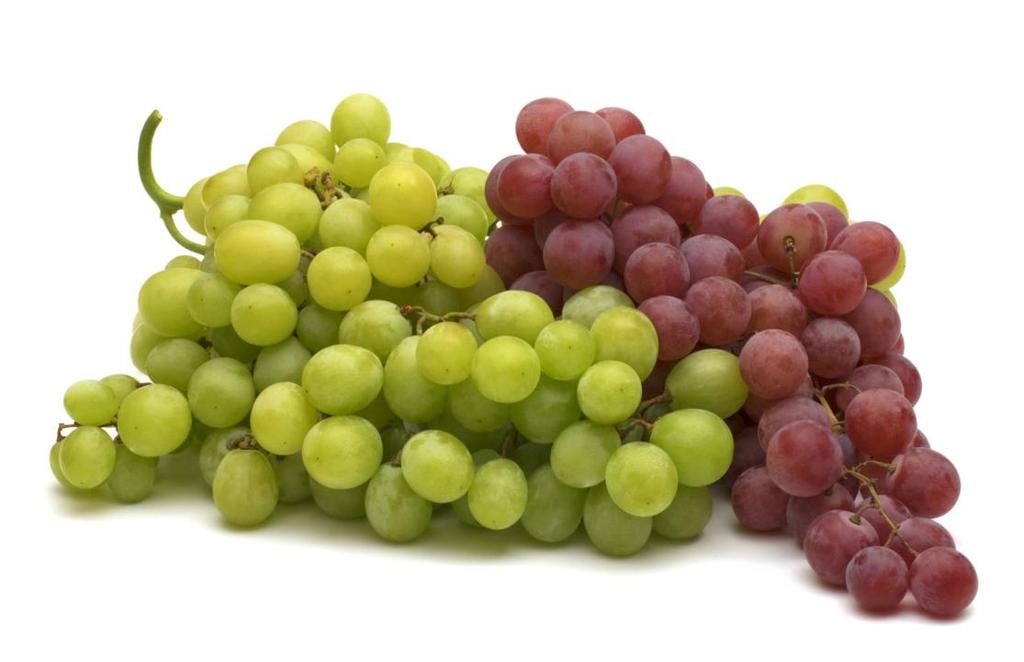
4 Main grape varieties Australian Table Grapes - Varieties & Seasonality Variety Nov Dec Green Grapes Seedless Menindee Seedless Thompson Seedless Seeded Calmeria O'Hanez Red Grapes Seedless Crimpson Seedless Flame Seedless Ralli Seedless Seeded Red Globe Blue/Black Grapes Seeded & Seedless Autumn Royal Midnight Beauty Jan Feb Mar Apr May Queensland regions and Carnarvon in Western Australia commence harvest mid November The southern regions of Victoria and Western Australia commence harvest in January through to June
 1997 2003 2006 2009 2014 75 205 205 94 210 227 86 174 204 69 146 151 94 120 103 94 111 118 111 86 100 to 500 ha 50")

5 Number of properties Change in property numbers and size for table grape growers from 1997 to 2014 in Sunraysia Property size (table grape area) 1 to 5 ha 5 to 10 ha 10 to 20 ha 20 to 40 ha 40 to 100 ha 100 to 500 ha Total properties Average size (ha) to 500 ha 50 to 100 ha 20 to 50 ha 10 to 20 ha 5 to 10 ha 1 to 5 ha % of 2014 total % % % % % % % Change There has been a consolidation of growers within the industry in the last 5 years 30% of properties are over 20 hectares and grow 73% of the grape plantings The average size of the properties has increased from 13.6 ha to 23.2 Ha

6 Change 7. Table in grape table industry plantings grape analysis plantings 1997 to , ,000 7,000 6, White non-bearing There has been a considerable increase in red varieties planted going from 25% of plantings in 1997 to 57% of 2014 plantings H E C T A R E S 5,000 4,000 3,000 2,000 White bearing Red Non-bearing Red bearing Black non-bearing The proportion of black table grape plantings increased from 2% of 1997 plantings to 8% of 2014 plantings. 1,000 0 Black bearing White table grape declined from 73% of 1997 plantings to just 36% of 2014 plantings
7 Summary of bearing and non-bearing table grape plantings (hectares) Table grapes % of 2014 total Change Black non-bearing % +86 Black bearing % +488 Red non-bearing 408 1, ,123 13% +715 Red bearing 991 1,728 2,569 2,744 3,835 44% +2,844 White non-bearing % -41 White bearing 3,558 4,038 3,823 3,139 2,682 31% -876 Total table grapes (ha) 5,540 7,685 8,040 7,320 8, % +3,215 % Bearing 84% 76% 80% 85% 81% % Non-bearing 16% 24% 20% 15% 19% % Black grapes 2% 1% 5% 7% 8% % Red grapes 25% 37% 41% 47% 57% Red bearing and non bearing plantings have increased from 25% to 57% from 1,399 to 4,958 Ha White bearing and non bearing plantings have decreased from 73% to 35% from 4,044 to 3,127 Ha Black bearing and non bearing plantings have increased from 2% to 8% from 96 to 670 Ha % White grapes 73% 62% 54% 45% 36%

8 The Murray River provides the water to Australia s fruit bowl where over 75% of our fruit is grown.

9 Hectares Irrigation methods for table grape plantings Low level sprinklers remained the dominant irrigation method for table grape plantings from 1997 to % of plantings are irrigated with low level sprinklers or drippers. Change in irrigation methods for table grape plantings from 1997 to ,000 8,000 7,000 6, ,000 4,000 3,000 2,000 1,000 0 Drip Low level Overhead Furrow Irrigation method % of 2014 total Change (ha) Drip 660 1,540 2,230 2,460 4,145 47% +3,485 Low level 2,170 3,960 4,230 4,110 4,325 49% +2,155 Overhead 980 1, % -755 Furrow 1,730 1, % -1,670 Total (ha) 5,540 7,685 8,040 7,320 8, % +3,215


10 National production on the increase The industry produced almost 160,000 tonnes fresh table grapes in 2013/14* which was 29% more than 2012/13 Worth $300 million to Victoria *Based on levy data and industry estimates

11 Table Grapes Production, Export and Consumption 210, , ,000 83,504 52% 120,000 40,813 36% 72,409 61% 15,745 90,000 29,861 38% 10,743 60,000 30,000 6,351 47,839 62% 72,943 64% 14,568 46,672 39% 76,496 48% / / / /14** 2013/14** - production and export figures are Production - export Import Export based on forecast

12 Table Grapes are Australia s largest fresh fruit export sector by value. In 2013/14 Australia exported 80,000 tonnes worth A$242 million, 36 per cent of Australian fresh fruit exports. Thailand Hong Kong China

13 2012/13 Export by State

14 Table Grape exports by month vs last year January to June combined is 10 per cent higher than last year s record trade with the trend slowed by a lower than anticipated June result.
 recommenced in April though only recorded 218 tonnes, while new access to Japan and South Korea achieved 235 tonnes and 6")
15 EXPORTS BY COUNTRY Hong Kong and Vietnam drove growth with several other markets recording strong growth at smaller levels. Trade to China (direct) recommenced in April though only recorded 218 tonnes, while new access to Japan and South Korea achieved 235 tonnes and 6 tonnes resp. for initial trade.

16 PREVIOUS SEASON INDICATORS Exports have been increasing consistently over the past 4 years. Strong growth has been recorded in Hong Kong, Vietnam and Thailand together with several other markets at smaller levels.


17 LATEST ANNUAL SNAPSHOT Hong Kong leads with 35% share. Together with Indonesia and Vietnam these 3 markets account for 63 per cent of trade over 12 months.

18 Australia is still a small player in Asia though has capacity to expand market share - got to do it right quality commitment value long term view


19 Asian markets have increased imports of table grapes on average 14 per cent per year. Increasing by 14 per cent per year Thailand Hong Kong China
20 LONG TERM TREND ANALYSIS Australian Table Grape annual export trend over 5 years overall is up 27 per cent per year measured for the 12 months to June. New access markets for China, Japan and South Korea are included. share 5year p.a. Market Jul - June 10 Jul - June 11 Jul - June 12 Jul - June 13 Jul - June % to LY Trend Tonnes Tonnes Tonnes Tonnes Tonnes % Hong Kong 7,508 9,863 17,351 22,265 27,681 35% 24% 39% Indonesia 7,699 5,751 6,246 11,111 11,405 14% 3% 10% Vietnam 1,545 2,538 3,761 7,194 10,257 13% 43% 61% Singapore 2,488 2,414 3,382 4,444 6,134 8% 38% 25% New Zealand 1, ,721 5,626 5,638 7% 0% 40% United Arab Emirates 1,075 1, ,956 4,145 5% 5% 40% Thailand 3,592 2,760 2,730 5,156 3,912 5% -24% 2% Malaysia 2,261 1,452 2,059 4,311 3,403 4% -21% 11% Russia ,404 1,256 2% -11% 16% Philippines ,033 1% 941% Bangladesh % 104% 24% Taiwan % 443% 56% India % 68% 31% Sri Lanka % -5% 10% Japan % China , % -94% Korea, South % all other 1, ,200 1,645 2% 37% 12% Total Exports (Tonnes) 30,615 29,861 40,813 72,409 80, % 11% 27% Source: Australian Bureau of Statistics; Fresh Intelligence analysis This data is funded from project MT14006

21 Australia is Asia s closest southern supplier of table grapes


22 IMPORT INSIGHTS Imports have stabilised around 16,000 tonnes notwithstanding 2011 when Australia restricted access from United States due to pest concerns. The volume appears to have responded strongly to price signals in earlier periods.
23 Thank you
24 International Promotion
25

26 Bruce Miller Australian Ambassador Japan 26

27

28 Thank you
Fresh Deciduous Fruit (Apples, Grapes, & Pears): World Markets and Trade
: World Markets and Trade") Million MT United States Department of Agriculture Foreign Agricultural Service December 21 Fresh Deciduous Fruit (Apples, Grapes, & Pears): World Markets and Trade 21/11 Forecast: World Apple Trade Declines;
Million MT United States Department of Agriculture Foreign Agricultural Service December 21 Fresh Deciduous Fruit (Apples, Grapes, & Pears): World Markets and Trade 21/11 Forecast: World Apple Trade Declines;
Vegetable Spotlight Broccoli
 Vegetable Spotlight Broccoli Summary Broccoli is Australia s 10 th largest vegetable crop in terms of value, accounting for 3.4% of total vegetable production with a gross value of $101.2 million in 2008/09.
Fresh Deciduous Fruit (Apples, Grapes, & Pears): World Markets and Trade
: World Markets and Trade") Fresh Deciduous Fruit (Apples, Grapes, & Pears): World Markets and Trade June 21 APPLES Record Production but Trade Estimate Revised Downward The world production estimate for 29/1 is virtually unchanged
Fresh Deciduous Fruit (Apples, Grapes, & Pears): World Markets and Trade June 21 APPLES Record Production but Trade Estimate Revised Downward The world production estimate for 29/1 is virtually unchanged
PHILIPPINES. 1. Market Trends: Import Items Change in % Major Sources in %
 PHILIPPINES A. MARKET OF FRESH FRUITS & VEGETABLES 1. Market Trends: Import Items 2003 2007 Change in % Major Sources in % Value Quantity Value Quantity Value Quantity USD '000 Tons USD '000 Tons Grapes
Fresh Deciduous Fruit (Apples, Grapes, & Pears): World Markets and Trade
: World Markets and Trade") United States Department of Agriculture Foreign Agricultural Service Fresh Deciduous Fruit (Apples, Grapes, & Pears): World Markets and Trade 9 1, MT Deciduous Fruit on Seasonal Cycles 6 Northern Hemisphere
United States Department of Agriculture Foreign Agricultural Service Fresh Deciduous Fruit (Apples, Grapes, & Pears): World Markets and Trade 9 1, MT Deciduous Fruit on Seasonal Cycles 6 Northern Hemisphere
July marks another month of continuous low prices
 July marks another month of continuous low prices In July 2018, the ICO composite indicator price decreased by 2.9% to an average of 107.20 US cents/lb, which is the lowest monthly average for July since
SINGAPORE. Summary Table: Import of Fresh fruits and Vegetables in Fresh fruit and Vegetables Market Value $000 Qty in Tons
 SINGAPORE A. MARKET FOR FRESH FRUIT AND VEGETABLES 1. Market Trend and Opportunities Summary Table: Import of Fresh fruits and Vegetables in Fresh fruit and Vegetables Market Products/ Other Info. Product
Economic Role of Maize in Thailand
 Economic Role of Maize in Thailand Hnin Ei Win Center for Applied Economics Research Thailand INTRODUCTION Maize is an important agricultural product in Thailand which is being used for both food and feed
World coffee consumption increases but prices still low
 World coffee consumption increases but prices still low The coffee market stabilised slightly in February, but prices remain at very low levels. A lack of news regarding fundamentals with expectations
Citrus: World Markets and Trade
 United States Department of Agriculture Foreign Agricultural Service Citrus: World Markets and Trade Oranges Global orange production for 2012/13 is forecast to drop over 4 percent from the previous year
Record exports in coffee year 2017/18
 Record exports in coffee year 2017/18 Total coffee exports increased each year since 2010/11 with a new record reached in 2017/18 at 121.86 million bags, 2% higher than 2016/17. In the twelve months ending
Global Trade in Mangoes
 Global Trade in Mangoes October 2014 Jim Lang Managing Director TradeData International Pty Ltd jim.lang@tradedata.net www.tradedata.net COUNTRIES WITH MONTH IMPORT STATISTICS 1. The global market is just
Coffee market ends 2017/18 in surplus
 Coffee market ends 217/18 in surplus World coffee production in coffee year 217/18 is estimated 5.7% higher at 164.81 million bags as output of Arabica increased by 2.2% to 11.82, and Robusta grew 11.7%
Coffee prices maintain downward trend as 2015/16 production estimates show slight recovery
 Coffee prices maintain downward trend as 2015/16 production estimates show slight recovery The coffee market fell again in December 2015, reaching its second lowest monthly average of the year. This decrease
January 2015 WORLD GRAPE MARKET SUPPLY, DEMAND AND FORECAST
 January 2015 WORLD GRAPE MARKET SUPPLY, DEMAND AND FORECAST Table of Contents Executive Summary... 4 1. VARIETIES OF GRAPES... 6 1.1. White table grapes... 6 1.2. Red table grapes... 6 2. WORLD DEMAND
Coffee market recovers slightly from December slump
 Coffee market recovers slightly from December slump After reaching its lowest level in 22 months in December 2017, the monthly average of the ICO composite indicator price increased by 1.4% to 115.60 US
Coffee market continues downward trend
 Coffee market continues downward trend Since August 2017, the ICO composite indicator price has declined in each month except January 2018. The composite indicator decreased by 1.1% in March 2018 to an
Table grape. Horticulture trade intelligence. Quarter 1: January to March 2017
 Horticulture trade intelligence A custom report compiled for Hort Innovation by Euromonitor International Table grape Quarter 1: January to March 217 Horticulture trade intelligence: Table grape: 217:
Fresh Fruit & Vegetable Export / Import Statistics 2016/17
 Fresh Fruit & Vegetable Export / Import Statistics 2016/17 A statistics resource for fresh produce exporters and importers prepared for the Australian Horticultural Exporters Association by Fresh Intelligence
Milk and Milk Products: Price and Trade Update
 Milk and Milk Products: Price and Trade Update June 217 * International dairy prices The FAO Dairy Price Index averaged 29 points in June, up 16 points (8.3 percent) from January 217 and 71 points (51.5
For personal use only
 SEPTEMBER 216 GLOBAL DAIRY UPDATE European milk production has decreased for the first time since early 215, with volumes in June down 2 compared to last year. Last week we announced our annual results,
DEVELOPMENTS IN STEEL SCRAP IN 2009
 DEVELOPMENTS IN STEEL SCRAP IN 2009 AMERICAN SCRAP COALITION WASHINGTON, DC DEVELOPMENTS IN STEEL SCRAP 2009 The year 2009 demonstrated that the United States continues to experience a crisis with respect
Coffee market settles lower amidst strong global exports
 Coffee market settles lower amidst strong global exports The ICO composite indicator price declined by 1.2% in February 2018 to an average of 114.19 US cents/lb. Indicator prices for all three Arabica
Overview of the Manganese Industry
 39th Annual Conference Istanbul, Turkey 2013 Overview of the Manganese Industry International Manganese Institute Alberto Saavedra Market Research Manager June, 2013 Introduction Global Production Supply,
GLOBAL DAIRY UPDATE KEY DATES MARCH 2017
 MARCH 2017 GLOBAL DAIRY UPDATE European milk production decreased for the seventh consecutive month, while the US remains strong. The rate of decline in New Zealand production is easing. US exports continue
KUWAIT. Similarly there is a decreasing trend for other fresh fruits products like grapes and lychee. India shared 37.6% of import market in Kuwait.
 KUWAIT A. MARKET FOR FRESH FRUITS AND FRESH VEGETABLES 1. Market Trend and Opportunities: Fresh Fruits The market for fresh fruits in Kuwait has a downward trend. Bananas import volume decreased by 34%
Asia Pacific Tuna Trade. Shirlene Maria Anthonysamy INFOFISH Pacific Tuna Forum 2017 Papua New Guinea
 Asia Pacific Tuna Trade Shirlene Maria Anthonysamy INFOFISH Pacific Tuna Forum 217 Papua New Guinea JAPANESE MARKET Demand for sashimi tuna remains highly seasonal strengthening during the spring festivals
Monitoring EU Agri-Food Trade: Development until March 2018
 Monitoring EU Agri-Food Trade: Development until March 2018 14.000 EU28: Export to Extra-EU of Agri-Food Products 13.000 12.000 11.000 10.000 2018 2017 2015 2016 2014 9.000 8.000 7.000 6.000 Jan Feb Mar
Asian Containerboard Markets
 Asian Containerboard Markets An Update on China: The Changes Keep Coming International Containerboard Conference November 2018 Beth Lis Vice President, Asian Paper & Packaging Beth Lis VP Asian Paper &
Asian Bitumen Supply/Demand Update. Seah Siew Hua Argus Media November 2009, Singapore
 Asian Bitumen Supply/Demand Update Seah Siew Hua Argus Media November 2009, Singapore Contents Asian supply and demand balance High demand growth countries Key exporting countries Country by country balance
Tuna Trade. Fatima Ferdouse
 Tuna Trade Fatima Ferdouse HIGHLIGHTS East Asia is the world s largest processing and exporting region for canned tuna. Producing countries in the region also depend on imported raw materials The fluctuating
Coffee market ends 2016/17 coffee year in deficit for the third consecutive year
 Coffee market ends 2016/17 coffee year in deficit for the third consecutive year The ICO composite indicator continued its downward trend that started at the end of August, averaging 124.46 US cents/lb.
Coffee prices rose slightly in January 2019
 Coffee prices rose slightly in January 2019 In January 2019, the ICO composite indicator rose by 0.9% to 101.56 US cents/lb as prices for all group indicators increased. After starting at a low of 99.16
Coffee market remains volatile but lacks direction
 Coffee market remains volatile but lacks direction Prices fluctuated significantly during August, with the ICO composite indicator dropping by 10 cents before jumping back up another 12 cents by the end
2018/19 expected to be the second year of surplus
 2018/19 expected to be the second year of surplus Coffee year 2018/19 is expected to be the second consecutive season of surplus, as global output, estimated at 167.47 million bags, exceeds world consumption,
Citrus: World Markets and Trade
 Department of Agriculture eign Agricultural Service January Citrus: World Markets and Trade Citrus: / ecast Global Orange Production and Trade Expand Global production and trade for is forecast at. million
Record exports from Brazil weigh heavy on the coffee market
 Record exports from Brazil weigh heavy on the coffee market Coffee exports from Brazil reached a record high of 36.8 million bags in crop year 2014/15 (April to March), fuelled by domestic stocks and encouraged
World Cocoa Prices. Commodity Prices Update: Coffee, Cocoa, and Cotton. Joelle Cook and Professor C. Leigh Anderson
 SDR per tonne Commodity Prices Update: Coffee, Cocoa, and Cotton Joelle Cook and Professor C. Leigh Anderson Prepared for the Agricultural Policy and Statistics Division of the Bill and Melinda Gates Foundation
INTERNATIONAL DAIRY PRODUCTS COUNCIL. Reply to Questionnaire 4. Australia (1988/89) I. Milk. A. Production and Utilization of Milk
 I. Milk. A. Production and Utilization of Milk") GENERAL AGREEMENT ON TARIFFS AND TRADE ACCORD GENERAL SUR LES TARIFS DOUANIERS ET LE COMMERCE ACUERDO GENERAL SOBRE ARANCELES ADUANEROS Y COMERCIO RESTRICTED DPC/STAT/12/Add.20 29 September 198 9 International
GENERAL AGREEMENT ON TARIFFS AND TRADE ACCORD GENERAL SUR LES TARIFS DOUANIERS ET LE COMMERCE ACUERDO GENERAL SOBRE ARANCELES ADUANEROS Y COMERCIO RESTRICTED DPC/STAT/12/Add.20 29 September 198 9 International
Outline. Long-term Outlook for Cotton Consumption. World End-Use Consumption of Textile Fibers. World Consumption of Textile Fibers
 World Cotton Supply and Use International Cotton Advisory Committee Secretariat Outline! Long-term Outlook for Consumption! Outlook for /! Developments in World Cotton Trade Fifth Open Session: Cotton
World of sugar PAGE 54
 World of sugar More than 1 countries produce sugar, about 8% of which is made from sugar cane grown primarily in the tropical and sub-tropical zones of the southern hemisphere, and the balance from sugar
WINE EXPORTS. February Nadine Uren. tel:
 WINE EXPORTS February 2012 Nadine Uren tel: +27 21 807 5707 e-mail: nadine@sawis.co.za OVERVIEW OF WINE EXPORTS HIGHLIGHTS Exports as a percentage of wine production decreased from 48.5% in 2010 to 43.2%
P E C A N R E P O R T
 P E C A N R E P O R T Agricultural Marketing Service 16 Forest Parkway Specialty Crops Programs Building 1-218 Market News Division Forest Park, Georgia 30297 Phone (404) 361-1376 FAX (404) 363-2523 Pecan
Dragon Fruit Market Analysis
 Dragon Fruit Market Analysis Global Production Competition Markets Dragon Fruit in South Africa - Considerations Vietnam Mainly White Flesh Pitaya (+/- 95%) and some conversion to Red Flesh (5%+) Some
Downward correction as funds respond to increasingly positive supply outlook
 Downward correction as funds respond to increasingly positive supply outlook Coffee prices fell sharply at the end of April as institutional investors sold off their positions. The coffee market continues
Global Considerations
 What Does Being a Global Player Mean to the U.S. Dairy Sector? Global Considerations 2 1 A Decade of Change $8, 4,5 $7, 4, (Million $) $6, $5, $4, $3, $2, $1, 3,5 3, 2,5 2, 1,5 1, 5 (Million Lbs.) $ 23
MONTHLY COFFEE MARKET REPORT
 1 E MONTHLY COFFEE MARKET REPORT March 2014 Ongoing uncertainty over the Brazilian coffee crop has caused significant fluctuations in coffee prices during March, with monthly volatility of the International
Prices for all coffee groups increased in May
 Prices for all coffee groups increased in May In May 2018, the ICO composite indicator increased by 0.7% to an average of 113.34 US cents/lb, following three months of declines. Prices for all coffee groups
The Potential Role of Latin America Food Trade in Asia Pacific PECC Agricultural and Food Policy Forum Taipei
 The Potential Role of Latin America Food Trade in Asia Pacific 2011 PECC Agricultural and Food Policy Forum Taipei Universidad EAFIT, Colombia December 2, 2011 1 CONTENTS 1. Introduction 2. Food Trade
Deliveries to dairies 198/86 GENERAL AGREEMENT ON TARIFFS AND TRADE. Consurption of fresh milk (including exports) 1985/86. Industrial uses 1985/86
 1985/86. Industrial uses 1985/86") GENERAL AGREEMENT ON TARIFFS AND TRADE RESTRICTED DPC/STAT/12/Add. 14 23 September 1986 International Dairy Arrangement INTERNATIONAL DAIRY PRODUCTS Reply to Questionnaire 4 AUSTRALIA COUNCIL (Financial
GENERAL AGREEMENT ON TARIFFS AND TRADE RESTRICTED DPC/STAT/12/Add. 14 23 September 1986 International Dairy Arrangement INTERNATIONAL DAIRY PRODUCTS Reply to Questionnaire 4 AUSTRALIA COUNCIL (Financial
Update on ASEAN Steel Industry Development Scenario
 2017 ASEAN Iron and Steel Sustainability Forum Update on ASEAN Steel Industry Development Scenario Presented by: TAN AH YONG Secretary General South East Asia Iron and Steel Institute (SEAISI) CONTENTS:
Bearing Produced by IAR Team Focus Technology Co., Ltd.
 Bearing 2013.06 Produced by IAR Team Focus Technology Co., Ltd. Contents 1. Bearing Industry Exports of 2012... 3 1.1. China Bearing Industry Export Classification Tables of 2012... 3 1.2. China Ball or
Coffee market ends 2014 at ten month low
 Coffee market ends 2014 at ten month low Coffee prices continued to slide downwards in December 2014, with the monthly average of the ICO composite indicator at its lowest level since February. Recent
Growing divergence between Arabica and Robusta exports
 Growing divergence between Arabica and Robusta exports In April 218, the ICO composite indicator decreased by.4% to an average of 112.56, with the daily price ranging between 11.49 and 114.73. Prices for
Record Exports for Coffee Year 2016/17
 Record Exports for Coffee Year 2016/17 Total exports in September 2017 reached 8.34 million bags, compared to 9.8 million in September 2016. While coffee year 2016/17 registered a decrease in its final
STATE OF THE VITIVINICULTURE WORLD MARKET
 STATE OF THE VITIVINICULTURE WORLD MARKET April 2018 1 Table of contents 1. VITICULTURAL PRODUCTION POTENTIAL 3 2. WINE PRODUCTION 5 3. WINE CONSUMPTION 7 4. INTERNATIONAL TRADE 9 Abbreviations: kha: thousands
Monitoring EU Agri-Food Trade: Development until September 2018
 Monitoring EU Agri-Food Trade: Development until September 2018 September 2018: Slowdown in EU export performance; imports from Brazil and US still on the rise The monthly value of EU agri-food trade in
North America Grains Outlook
 banchero costa North America Grains Outlook (covering wheat and coarse grains) September 2018 bancosta blue studies volume DRY 2018/#12 banchero costa research www.bancosta.com ; research@bancosta.com
THE GLOBAL PULSE MARKETS: recent trends and outlook
 THE GLOBAL PULSE MARKETS: recent trends and outlook CICILS/IPTIC 2004 CONVENTION 10-12 12 June 2004 Beijing, China Boubaker BENBELHASSEN Commodities and Trade Division United Nations Food and Agriculture
Dairy Outlook. December By Jim Dunn Professor of Agricultural Economics, Penn State University. Market Psychology
 Dairy Outlook December 2015 By Jim Dunn Professor of Agricultural Economics, Penn State University Market Psychology The Class III market has taken a beating lately as cheese prices have drifted down and
MONTHLY COFFEE MARKET REPORT
 E MONTHLY COFFEE MARKET REPORT February 2014 February 2014 has seen significant developments in the coffee market, with prices shooting upwards at a startling rate. The ICO composite daily price has increased
Milk and Milk Products. Price and Trade Update. Weekly Newsletter. Milk and Milk Products. Price and Trade Update: April
 April Milk and Milk Products Price and Trade Update Weekly Newsletter Milk and Milk Products Price and Trade Update: April 1 PRICES: Remain depressed International dairy product prices began the year at
VIETNAMESE COFFEE REPORT
 VIETNAMESE COFFEE REPORT Hanoi, November 2016 Coffee is one of Vietnam's most important agricultural exports, second only to rice about export turnover. Vietnam still remains the world s biggest exporter
Monitoring EU Agri-Food Trade: Development until October 2016
 Monitoring EU Agri-Food Trade: Development until October 2016 October 2016 EU agri-food exports stabilise at high level The monthly value of EU agri-food exports in October 2016 stabilised at EUR 11.4
Industry Advisory Panel Item 4c Trade of Stainless Steel Scrap
 Industry Advisory Panel Item 4c Trade of Stainless Steel Scrap Lisbon Tuesday 22 April 2008 Sven Tollin Chief Statistician 1 Stainless Steel Waste & Scrap Comparison calendar with Except Kazakhstan only
Soybean Oil and Palm Oil Account For An Increasing Share of World Vegetable Oil Consumption
 United States Department of Agriculture Foreign Agricultural Service Circular Series FOP 01-03 January 2003 Soybean Oil and Palm Oil Account For An Increasing Share of World Vegetable Oil Consumption Percent
MONTHLY COFFEE MARKET REPORT
 E MONTHLY COFFEE MARKET REPORT May 2014 After five consecutive months of rising prices, the coffee market reversed lower in May. From a high of 179 cents/lb in April, the daily price of the ICO composite
World Dairy Situation. IDF SC DPE, Paris April 11, 2013
 World Dairy Situation IDF SC DPE, Paris April 11, Current dairy situation Dairy production progressed in 2012 in supplying regions but is now stabilizing, even declining in some countries Export demand
Taiwan Fishery Trade: Import Demand Market for Shrimps. Bith-Hong Ling
 International Symposium Agribusiness Management towards Strengthening Agricultural Development and Trade III : Agribusiness Research on Marketing and Trade Taiwan Fishery Trade: Import Demand Market for
Monthly Economic Letter U.S. and Global Market Fundamentals
 Monthly Economic Letter U.S. and Global Market Fundamentals August 2012 www.cottoninc.com After trading within relatively narrow bands throughout July, New York futures moved higher in early August, with
Monitoring EU Agri-Food Trade: Development until March 2017
 Monitoring EU Agri-Food Trade: Development until March 2017 March 2017: record value in monthly agri-food exports at EUR 12.7 billion The monthly value of EU agri-food exports in March 2017 reached a value
Volatility returns to the coffee market as prices stay low
 Volatility returns to the coffee market as prices stay low Daily coffee prices hit their lowest level in 19 months during August, as commodity markets worldwide were negatively affected by currency movements
World vitiviniculture situation
 World vitiviniculture situation Surface area Grape Wine Global grape production Production Consumption Trade 2016 FAO-OIV Focus: Table and Dried Grapes 2 Global area under vines Area under vines in the
Update on ASEAN Steel Industry Development Scenario
 2016 ASEAN Iron and Steel Sustainability Forum Update on ASEAN Steel Industry Development Scenario Presented by: TAN AH YONG Secretary General South East Asia Iron and Steel Institute (SEAISI) CONTENTS:
GRAPE GAINS: GETTING ACCESS TO THE BEST VARIETIES. By Mr. Manik Patil
 GRAPE GAINS: GETTING ACCESS TO THE BEST VARIETIES By Mr. Manik Patil Climatic Conditions for Grapes Grapes are grown under a variety of soil and climatic conditions in three distinct agro-climatic zones
MONTHLY COFFEE MARKET REPORT
 E MONTHLY COFFEE MARKET REPORT December 2011 In December 2011 Arabica prices underwent significant downward corrections while Robusta prices increased slightly. The average of the 2 nd and 3 rd positions
Mango Market Profile
 Mango Market Profile Prepared by: Ministry of Industry, Commerce, Agriculture & Fisheries Agricultural Services Unit Hope Gardens, Kingston 6 Tel: (876)927-1731/Fax: (876)927-1792 Email: marketing@moa.gov.jm
What Does Being a Global Player Mean to the U.S. Dairy Sector?
 What Does Being a Global Player Mean to the U.S. Dairy Sector? Global Considerations Copyright of Daily Dairy Report, Inc. 2 A Decade of Change $8,000 4,500 $7,000 4,000 (Million $) $6,000 $5,000 $4,000
MARKETING WINE: DEVELOPING NEW MARKETS IN ASIA
 MARKETING WINE: DEVELOPING NEW MARKETS IN ASIA MARKETING WINE: DEVELOPING NEW MARKETS IN ASIA GEOGRAPHY OF MARKETS IN ASIA INDIA CHINA HONG KONG MACAO THAILAND VIETNAM SINGAPORE MALAYSIA SOUTH KOREA TAIWAN
India. Oilseeds and Products Update. August 2012
 THIS REPORT CONTAINS ASSESSMENTS OF COMMODITY AND TRADE ISSUES MADE BY STAFF AND NOT NECESSARILY STATEMENTS OF OFFICIAL U.S. GOVERNMENT POLICY Required Report - public distribution Oilseeds and Products
GLOBAL DAIRY UPDATE. Welcome to our March 2015 Global Dairy Update IN THIS EDITION Financial Calendar
 GLOBAL DAIRY UPDATE Welcome to our ch 2015 Global Dairy Update IN THIS EDITION Fonterra milk collection New Zealand 7% lower in ruary 2015 and 1.5% higher for the season to date Australia 4% higher in
Monitoring EU Agri-Food Trade: Development until April 2017
 Monitoring EU Agri-Food Trade: Development until April 2017 April 2017: Agri-food exports back to average values The monthly value of EU agri-food exports in April 2017 reached a value of EUR 10.6 billion,
Major California Agricultural Exports to the Top Destinations in 1999* (1) Canada Rank Approximate Export Value (millions)
 Canada Rank Approximate Export Value (millions)") (1) Canada Rank Approximate Export Value (millions) Table Grapes 1 119 Tomatoes, Processed 2 115 Lettuce 3 102 Wine 4 84 Strawberries 5 78 Carrots 6 50 Tomatoes, Fresh 7 43 Peaches/Nectarines 8 42 Broccoli
(1) Canada Rank Approximate Export Value (millions) Table Grapes 1 119 Tomatoes, Processed 2 115 Lettuce 3 102 Wine 4 84 Strawberries 5 78 Carrots 6 50 Tomatoes, Fresh 7 43 Peaches/Nectarines 8 42 Broccoli
Paper Packaging Practice June Copyright 2015 RISI, Inc. All rights reserved.
 Global Containerboard Outlook Ken Waghorne, VP Paper Packaging Practice June 2015 1 Today s Agenda Regional Containerboard Markets Asia Europe Western Eastern North America Latin America Rest of World
CBH 2015/16 QUALITY REPORT
 CBH 2015/16 QUALITY REPORT CBH GROUP Our business OUR CUSTOMERS Flour millers, Maltsters Feed manufacturers Food processors OUR GROWERS 4500 members 10 million tonnes production average Largest Co-op in
China s Export of Key Products of Pharmaceutical Raw Materials
 China s Export of Key Products of Pharmaceutical Raw Materials During the period of the 62nd API China& INTERPHEX CHINA, China Pharmaceutical Industry Association released its annual Report on Analysis
TURKEY ICAC RESEARCH ASSOCIATE PROGRAM 6-16 APRIL 2009 WASHINGTON D.C./USA SOME FACTS ABOUT SOME FACTS ABOUT SOME FACTS ABOUT
 ICAC RESEARCH ASSOCIATE PROGRAM TURKEY - Geographically, Turkey straddles two continents, Europe in the west and Asia in the east. - The two continents are divided by Istanbul and Dardanelles straits.
MONTHLY COFFEE MARKET REPORT
 E MONTHLY COFFEE MARKET REPORT July 2012 Coffee prices rebounded in July 2012, with the ICO composite indicator increasing by 9.5% compared to June, following nine consecutive months of price falls. The
Monitoring EU Agri-Food Trade: Development until October 2018
 Monitoring EU Agri-Food Trade: Development until October 2018 October 2018: best EU agri-food export performance ever The monthly value of EU agri-food trade in October 2018 was second biggest ever recorded
Coffee Season 2013/14 Finishes in Balance but Deficit Expected Next Year
 Coffee Season 2013/14 Finishes in Balance but Deficit Expected Next Year Coffee prices were volatile again over the course of September, mostly reacting to weather news from Brazil. Daily prices fell initially
Networkers Business Update. December 2014
 Networkers Business Update December 2014 Agenda Forecast Milk Price Global markets V3 Strategy Growing our share of New Zealand milk Page 2 Forecast Milk Price 110 100 2012/13 2013/14 2014/15 Forecast
Monitoring EU Agri-Food Trade: Development until January 2016
 Monitoring EU Agri-Food Trade: Development until January 2016 January 2015 - EU agri-food exports in line with seasonal trend EU agri-food exports in January 2016 were worth EUR 9.3 billion, thus just
Monitoring EU Agri-Food Trade: Development until November 2016
 Monitoring EU Agri-Food Trade: Development until November 2016 November 2016 EU agri-food exports again at record level The monthly value of EU agri-food exports in November 2016 reached a new record level
THIS REPORT CONTAINS ASSESSMENTS OF COMMODITY AND TRADE ISSUES MADE BY USDA STAFF AND NOT NECESSARILY STATEMENTS OF OFFICIAL U.S.
 THIS REPORT CONTAINS ASSESSMENTS OF COMMODITY AND TRADE ISSUES MADE BY USDA STAFF AND NOT NECESSARILY STATEMENTS OF OFFICIAL U.S. GOVERNMENT POLICY Required Report - public distribution Date: GAIN Report
Blow Molding Machine Produced by IAR Team Focus Technology Co., Ltd
 Blow Molding Machine 2012.08 Produced by IAR Team Focus Technology Co., Ltd Contents 1. 2009-2011 Chinese Blow Molding Machines Export Trend Analysis...3 2009-2011 Chinese Blow Molding Machines Export
ONE YEAR ANNUAL RESULTS FONTERRA FONTERRA CO-OPERAT CO-OPERA IVE GROUP LTD
 ONE YEAR. 2012 ANNUAL RESULTS FONTERRA CO-OPERATIVE GROUP LTD 1 SIR HENRY VAN DER HEYDEN CHAIRMAN FONTERRA CO-OPERATIVE GROUP LTD 2 OVERVIEW Highlights Business performance Update on strategy Questions
Global sparkling wine market trends. June Peter Bailey. Manager - Market Insights. Wine Australia
 Global sparkling wine market trends June 2018 Peter Bailey Manager - Market Insights Wine Australia Presentation Outline 1. Who are the biggest sparkling wine producers? 2. Where are the biggest markets?
Global Rum Market Insights, Forecast to 2025
 Report Information More information from: https://www.wiseguyreports.com/reports/3652945-global-rum-market-insights-forecast-to-2025 Global Rum Market Insights, Forecast to 2025 Report / Search Code: WGR3652945
ACUERDO GENERAL SOBRE ARANCELES ADUANEROS Y COMERCIO INTERNATIONAL DAIRY PRODUCTS COUNCIL. Reply to Questionnaire 4 AUSTRALIA I.
 GENERAL AGREEMENT ON TARIFFS AND TRADE RESTRICTED ACCORD GENERAL SUR LES TARIFS DOUANIERS ET LE COMMERCE?!!P ST^T/ *^dd * 29 ACUERDO GENERAL SOBRE ARANCELES ADUANEROS Y COMERCIO 2 December 1994 Special
Monitoring EU Agri-Food Trade: Development until December 2015
 Monitoring EU Agri-Food Trade: Development until December 2015 December 2015 - EU agri-food exports again higher than in previous years EU agri-food exports in December 2015 achieved a value of EUR 11.2