DYNAMICS OF GRAPE BERRY VOLUME CHANGE DURING RIPENING MARCO BIONDI
|
|
|
- Mariah Chase
- 6 years ago
- Views:
Transcription
1 DYNAMICS OF GRAPE BERRY VOLUME CHANGE DURING RIPENING By MARCO BIONDI A thesis submitted in partial fulfillment of the requirements for the degree of MASTER OF SCIENCE IN HORTICULTURE WASHINGTON STATE UNIVERSITY Department of Horticulture and Landscape Architecture DECEMBER 2007
2 ii To the Faculty of Washington State University: The members of the Committee appointed to examine the thesis of MARCO BIONDI find it satisfactory and recommend that it be accepted. Chair
3 ACKNOWLEDGEMENTS iii There are many people to thank for their help throughout the course of this endeavor. Big thanks to Markus Keller for his understanding, freedom, encouragement, guidance, advice and friendship which helped me to succeed not only in school but in research as well. Big thanks also to John Fellman for helping from the very beginning, and for never hesitating to discuss any my concerns throughout this all wonderful learning experience. I would like also to thank Bhaskar Bondada for his suggestions on daily discoveries and future projects. My special thanks go to Lynn Mills who did not just help me with measurements and reports, but also introduced me to her wonderful family and made me part of it. Special thanks also to John Ferguson who helped me in constructing, programming and logistics for the set up of the experiments. I would like also to acknowledge the North West Center for Small Fruits Research, WSU Agriculture Research Center, Washington Wine Advisory Committee program and scholarships donators for the financial support. Also I thank Alan Kawakami for managing and taking care of the grapevines used in this study; Pradeep Shrestha for HPLC analysis and for sharing the lab and making working a pleasant time; Gary Ballard for giving me the freedom to use his equipment at any time; Judy Hobart for helping with the administrative issues, Maurizio Sorbini for opening my mind to the New World and with Ray Folwell encouraging me to come to study at WSU; and to all the friends made in Washington who have made this experience the most enjoyable.
4 DYNAMICS OF GRAPE BERRY VOLUME CHANGE iv DURING RIPENING Abstract by Marco Biondi, M.S. Washington State University December 2007 Chair: Markus Keller Vitis vinifera L. (c.v. Merlot) and Vitis labruscana Bailey (c.v. Concord) were used in this study to better understand the dynamics of fruit volume change during grape ripening. Berry diameter was monitored during dry-down and re-watering cycles at veraison. The diameter of green berries declined during dry-down and increased when the skin changed color even though water was not available in the soil. The increase in berry size which was accentuated by re-watering may be due the increase of phloem influx. Leaf photosynthesis also increased within two hours of rewatering. Pressurizing the root system of Concord vines during veraison showed that berries respond to pressure by increasing their volume up to a soluble solids concentration of 9 Brix and sometimes cracked at >11 Brix. When the xylem-mobile dye, basic fuchsin, was infused through the shoot base, the dye penetrated through the berry s vascular system. Dye penetration decreased as the berry skin changed color from green to blue. This trend could be reversed by pressurizing the shoot base. When dye was infused through the stylar end of post-veraison berries, it moved back to the plant only when pressure applied to the root was released. This proves that the xylem vessels are perfectly functional and the berry is
5 v not hydraulically isolated from the rest of the plant during ripening. Berries immersed in distilled and tap water absorbed water through the skin and pedicel regardless of the variety, water source and maturity stage. Post-veraison berries were likely to crack and when they did, they lost up to 300 mg of sugar. Cracked berries gained more weight in distilled water than in tap water which might be explained by the difference of mineral concentration in the water source. Even if the berries did not crack, sugar leached out of the berry from the pedicel. When clusters were girdled or detached shortly before veraison, berries changed color similar to intact clusters. However, this was only true when the berries shriveled. Berry color change may be trigged by the sugar concentration which increases due to water loss or phloem influx.
6 vi TABLE OF CONTENTS Page ACKNOWLEDGEMENTS...iii ABSTRACT...iv LIST OF TABLES...ix LIST OF FIGURES.x DEDICATION xiv CHAPTER 1. INTRODUCTION General Aspects of the Washington Wine and Grape Industry Climate of Washington State Vegetative Development of Grapevines Reproductive Development of Grapevines Anatomy of the Grape Berry Water Flow and Vascular Transport Water Excess and Deficiency The Hypothesis MATERIALS AND METHODS Location of the experiments Dry- down and re-watering experiment...22
7 2.3 Root pressurization experiments Berry size response Xylem sap collection Leaf water potential / photosynthesis rate / xylem sap collection Dye feeding experiments Dye feeding without pressure Dye feeding / shoot pressure chamber Dye feeding reverse / root pressure chamber Berry weight response to immersion experiments Berry weight response to immersion Early post-veraison berries / response to immersion Late pos-veraison berries / response to immersion Heat-girdling experiment Statistical analyses RESULTS Dry-down and re-watering Root pressurization Dye feeding Berry weight response to immersion Heat-girdling 60 vii
8 viii 4. DISCUSSION CONCLUSIONS AND FUTURE STUDIES 76 REFERENCES...79
9 ix LIST OF TABLES Page CHAPTER THREE Table 1: Skin color, weight and soluble solid of cracked Concord berries due to application of pneumatic pressure to the root system Table 2: Photosynthetic rate (A) and stomatal conductance (g s ) compared to Ψ leaf at different phenological stage for Merlot and Concord Table 3: Effect of different ph of water on cracking for Concord berries at ~18 Brix 60
10 x LIST OF FIGURES Page CHAPTER ONE Figure 1: Diagram of a typical double-sigmoid pattern of growth by a grape berry, from anthesis to harvest. As noted in the figure above, in some cultivars, berries may shrivel between ripeness and harvest (redrawn from Coombe 2001)..7 Figure 2: Structure of a ripe grape berry partially sectioned on the long and central axis to show internal part (A) (illustration redraw from Coombe 2001)...10 Figure 3: Cavitation of xylem vessel by water vapor bubble (A) (Taiz and Zeiger 1998); Vascular flow (B) (Nobel 1999) 14 CHAPTER TWO Figure 4: Vines grown in white 20.0 liter PVC pots at the Irrigated Agriculture Research and Extension Center in Prosser, Washington, USA.21 Figure 5: Glasshouses used for experiments at the Irrigated Agriculture Research and Extension Center in Prosser, Washington, USA. (Light intensity in glass-house A= photosynthetic photon flux ~ 860 μmol m -2 s -1 under clear sky at midday; glass house B= photosynthetic photon flux ~1180 μmol m -2 s -1 under clear sky at midday.)..21 Figure 6: Climate of 2006 at IAREC Prosser, WA. Data from AgWeatherNet, Prosser, WA.USA 22 Figure 7: Plants placed on digital balances and the pot surfaces sealed with a plastic bag to prevent water loss by evaporation from the soil. Meteorological conditions in the glasshouse recorded using an HMP45 temperature and relative humidity sensor (A). Also, berry diameter recorded with FI-XSM linear variable displacement transducers (B) Figure 8: FI-XSM linear variable displacement transducers connected via an AM 416 relay multiplexer to a CR10X data logger which was connected to the computer...24 Figure 9: Different perspectives of the custom-built 26-L metal root pressure chamber armed (A and B), based on the design by Yong (2000) and modified by Smith (2004). The compression collar bolted down to seal around the stem (B).26
11 Figure 10: The Model 615 Pressure Bomb used to determine the leaf water potential (A). A length of parafilm TM wrapped around the peduncle of the cut cluster to attach an HPLC vial for collecting the xylem sap (B).. 28 Figure 11: Photosynthetic rate measured by the Portable Photosynthesis System...29 Figure 12: Correlation between dye basic fuchsin dilution and color intensity Figure 13: The extent of dye movement into the berry rated visually and assigned a number from 1, when the dye stops in the brush region, through 6, when the dye continues throughout the entire vascular bundles..31 Figure 14: Both figures show a freshly cut shoot inserted through the gland and placed inside the chamber. Merlot shoot with a cluster during veraison and no leaves with cut surfaces sealed by parafilm (A). Merlot shoot with ripe cluster and leaves (B) 33 Figure 15: Dye basic fuchsion fed to the berry by using a stand placed next to the pressure chamber (A). A Falcon tube used to feed the berry (B) Figure 16: Pedicel immersed with the berry protruding from the water (A). Berry immersed with the sealed pedicel protruding from the water (B). Berry immersed with the pedicel protruding from the water (C)...36 Figure 17: A pink Concord berry totally immersed in water 37 Figure 18: A Merlot cluster during veraison with a green shoulder (A). The heat-girdling applied to the peduncle of the cluster (B)..39 Figure 19: The heat-girdling instrument used (A). The top of resistance wire without (top) or with (bottom) a current of 12 V switched on (B).39 Figure 20: The heat-girdling damage on the peduncle.40 CHAPTER THREE Figure 21: Concord (A) and Merlot (B) berries on water-stressed vine started to expand as soon as color changed from green to blush-pink while the green berries kept shriveling due to low soil moisture.42 Figure 22: Change in diameter of Concord (A) and Merlot (B) grape berries at veraison during a soil dry down and rewatering cycle. Solid circle indicates the beginning of color change while the vertical line indicates rewatering. Transpiration is reported on the x axis.43 xi
12 Figure 23: Effect of pneumatic pressure applied to the Concord root system at veraison. Changes in diameter of seven berries on the same vine recorded with electronic transducers.44 Figure 24: HPLC chromatogram of sugar in a xylem sap sample from a Concord vine..45 Figure 25: Correlation between dye location (1 in the brush, 6 continuous throughout entire vascular network) and skin color (from green 1 to blue 6) of grape berries during veraison. 47 Figure 26: The seven stages of berry skin pigmentation linked with softening and dye location during veraison from hard green to blue color: 1-A hard green, 1-B soft green, 2-blush, 3-pink, 4-red, 5-purpole, 6-blue..48 Figure 27: Correlation between berry soluble solid and dye location (1 in the brush, 6 continuous throughout entire vascular network) when berries were pressurized to 1 bar for 30 and 60 minutes 49 Figure 28: Correlation between dye location (1 in the brush, 6 continuous throughout entire vascular network) and soluble solid for Concord and Chardonnay cluster upon veraison when shoots were pressurized to 2 bars for 30 minutes..50 Figure 29: Correlation between dye location (1 in the brush, 6 continuous throughout entire vascular network) and soluble solid under three different pressures applied to the shoot base (1, 2 and 4 bars) at veraison in Concord and Merlot berries 51 Figure 30: Correlation between dye location (1 in the brush, 6 continuous throughout entire vascular network) and soluble solid under different times of pressurization at 2 bars in Concord clusters 52 Figure 31: Shoots of Chardonnay, Muscat Blanc and Merlot pressurized by the pressure bomb at 0, 2 and 4 bar for 15, 30 and 45 minutes. The extent of dye movement inside of the berry was rated visually and assigned a number from 0 (no dye) through 6 (continuous throughout entire vascular network)..53 Figure 32: Correlation of the development of skin pigmentation (from green 1 to blue 6) and the soluble solid concentration inside the berry for Concord (A) and Merlot (B)..54 Figure 33: Movement of the xylem-mobile dye basic fuchsin infused from the stylar end of attached Chardonnay grape berries. The photo shows the radial section of the peduncle of cluster where the berry was infused..55 Figure 34: Weight gained by Merlot and Concord berries immersed in distilled water in correlation with cracking...56 xii
13 Figure 35: Six different treatments applied to post-veraison Merlot and Concord berries Treatments: A=berry protruding from the water, pedicle immersed; B=pedicel protruding from the water, skin immersed; C=berry entirely immersed with only skin sealed; D= berry entirely immersed with only pedicel sealed; E= berry entirely immersed without sealing; F= berry entirely immersed and sealed. Treatments with the same letter are not significantly different at p < Figure 36: Correlation between the final soluble solid and sugar lost for Merlot and Concord berries immersed in distilled water.58 Figure 37: Concord berries immersed in distilled water gained more weight than in tap water. No significant difference between water ph when the berries did not crack (A). Significant difference in gained weight between water sources when the berries did crack (B)..59 Figure 38: Merlot cluster. The heat-girdling done on the peduncle of the cluster and on the lateral shoulder indicate by the arrows. Figure A shows a girdled cluster at the early stage of ripening while Figure B shows the same cluster 5 days after girdling.61 Figure 39: Merlot cluster. The heat-girdling done only on the peduncle of the cluster indicated by the arrows. Figure A shows a cluster undergoing veraison while Figure B shows the same cluster 10 days after girdling...61 Figure 40: Correlation between days after girdling and soluble solid for the girdled and control Merlot clusters. Girdling done on the peduncle and the lateral shoulder of the cluster (shoulder girdled) and only on the peduncle of the cluster (shoulder not girdled) were the treatments. Soluble solid concentration of the berries measured for the girdled and control clusters at the time of girdling, after 5 and 10 days 62 Figure 41: A cluster of Merlot detached from the vine during the changing of color. A Merlot cluster detached from vine (A). The same cluster 5 days later (B) 63 Figure 42: A cluster of Concord detached from the vine during the changing of color. A Concord cluster detached from vine (A). The same cluster 5 days later (B).63 Figure 43: A Concord cluster (A) and a Merlot cluster (B) collected from the field during veraison and immersed in distilled water...64 xiii APPENDIX Appendix 1: Grapevine growth stages according to Eichhorn and Lorenz. Illustration from Coombe (1995)..87
14 xiv Dedication This thesis is dedicated to my family, especially to my Mom and Dad, who throughout my whole life have provided encouragement to always achieve my dreams. Grazie!
15 1 CHAPTER ONE INTRODUCTION AND LITERATURE REVIEW
16 2 1.1 General Aspects of the Washington Wine and Grape Industry Production of wine in the State of Washington has more than doubled over the past decade, making wine grapes the state's fourth largest fruit crop. In Washington State there are 350 wine grape growers, with more than 12,000 ha of Vitis vinifera L. vineyards (Ball et al., 2003). Major red-wine cultivars planted are Cabernet Sauvignon (2448 ha), Merlot (2420 ha), Syrah (849 ha), and Cabernet Franc (750 ha), while the white-wine cultivars are Chardonnay (2687 ha), Riesling (890 ha), Sauvignon Blanc (287 ha), and Gewürztraminer (271 ha) (Washington Agricultural Statistics Service, 2006). The nine American Viticulture Areas (AVAs) currently located in the state are Yakima Valley, Columbia Valley, Walla Walla Valley, Puget Sound, Red Mountain, Columbia Gorge, Horse Heaven Hills, Wahluke Slope, and Rattlesnake Hills. Today, the Washington State wine industry affects the U.S economy by $ 3 billion annually ( and the acreage planted to wine grapes continues to grow each year. Washington State is also the leading producer of Concord grapes (Vitis labruscana Bailey) with ~ 10,000 hectares supplying more than half of the U.S total (Ball et al., 2004). Concord is used mostly for juice and jelly and is highly appreciated in United States. 1.2 Climate of Washington State Climatic conditions in Washington State are unique when compared with other regions of the world. West of the Cascades, temperatures are milder without the danger of extreme cold in the winter, but in eastern Washington, vineyards are susceptible to killing frosts and cold temperatures. On the east side of the Cascade Mountains a rainshadow effect prevails, so that much of the region is semi-arid with less than 250 mm of rain per
17 3 year. In Prosser, where this study has been conducted, average annual rainfall is 198 mm with 75% of the rain events occurring from October through April. There is about 10 C range between day and night temperatures especially during the growing season. The growing season is short (158 frost free days) and the average cumulative "Class A" unscreened pan evaporation is 1266 mm for April through October (Naor and Wample, 1994) with maximum daily reference evapotranspiration (grass) during the growing season of about 9 mm d -1 (Evans et al., 1993). The combination of a short growing season, low rainfall, hot summers and cold winters challenges Washington grape growers in several ways. One challenge is the necessity of irrigation to grow grapes due to the large deficit between evapotranspiration and rainfall. 1.3 Vegetative Development of Grapevines Several distinct developmental stages such as dormancy, budbreak (budburst), bloom (anthesis, flowering), fruit set (berry set, setting), veraison (berry softening, color change, onset of ripening), harvest (ripeness, maturity), and leaf fall (abscission) occur in the annual vine growth cycle (Appendix 1). The vegetative cycle starts with bleeding in March, which refers to the exudation of xylem sap from pruning surfaces and is a transition from dormancy to active growth. Bleeding is caused by root pressure, which is generated by remobilization of nutrient reserves (especially carbohydrates) and pumping of sugar into the xylem (Sperry et al., 1987). Root pressure serves to dissolve and push out air bubbles that have formed in the xylem vessels during the winter. In temperate climates budbreak and shoot growth are induced by mean daily temperatures above 10 C (Galet, 2000). Budbreak is affected also by the grape variety, the time of pruning, the
18 4 vigor of the vine, water stress and cold hardiness (Mills et al., 2006). Budbreak is followed by a period of exponential shoot growth (Williams and Matthews, 1990). This phase is characterized by strong apical dominance, whereby release of auxin by the growing main-shoot tip inhibits lateral shoot growth. However, lateral shoots can supply up to 40% the total leaf area (Candolfi-Vasconcelos and Koblet, 1990) and lateral leaves are important contributors to sugar accumulation in the fruit and starch accumulation in the wood (Candolfi-Vasconcelos and Koblet, 1990; Mabrouk et al., 1997; Schultz et al., 1996). Unlike many fruit trees which produce specialized fruiting buds and vegetative buds, grapevines produce both fruit and foliage from the same buds. Buds are particularly numerous and complex. Latent buds can remain dormant for several years, before some event activates them. In the axil of each leaf on the main shoot there are lateral buds which can development and enrich leaf area (Pratt, 1971). The petiole is the leaf stem that connects the leaf to the shoot and contains multiple vascular bundles from a separate shoot vascular bundle (Pratt et al., 1974). As perennial plants, grapevines annually store and remobilize carbohydrates and mineral nutrients in response to changing conditions (Galet, 2000). After budbreak when the cells of the young shoot are dividing, growth is slow. Then, as mean temperatures rise, growth and shoot elongation accelerates from day to day (Williams et al., 1987). Unless growth conditions become unfavorable (e.g. with water stress), the shoots will continue to grow (Winkler et al., 1974). Shoots and leaves position themselves on the outside of the vine's canopy to capture sunlight. The plant leaf area depends on the training system, plant vigor, pruning intensity and genotype
19 5 (Williams, 1987; Mabrouk et al., 1997; Palliotti et al., 2000). The basic function of the leaf is to capture sunlight for energy (ATP) production and carbon dioxide (CO 2 ) for carbohydrate production to support the vine s metabolism. Grapevine leaves reach light saturation at photosynthetic photon fluxes between 700 and 1200 μmol m -2 s -1, which is well below the photon flux of full sunlight (up to 2000 μmol m -2 s -1 ) (Mullins et al., 2003). However, the conditions under which vines are grown may cause some change in the value for light saturation (Kriedemann, 1968). Temperature is another important environmental factor that can influence the rate of photosynthesis in grape leaves. The optimum leaf temperature for photosynthesis of field grown vines is generally between 25 and 35 C (Kriedemann, 1968). Vine leaves typically have between 100 and 400 stomata per mm 2 (Mullins et al., 2003). Stomata are responsible for regulating the gas exchange (mainly CO 2 for photosynthesis, oxygen (O 2 ) for respiration, and water (H 2 O) vapor from transpiration) between the leaf and the atmosphere. Vines, like other plants, are stationary so they cannot move from place to place to find better food sources. Because uptake of water and nutrients by the roots from the surrounding soil quickly depletes available resources, the roots must keep growing throughout the vine s life and the season in order to maintain the supply of these raw materials (Williams. et al., 1991; Araujo et al., 1988).
20 6 1.4 Reproductive Development of Grapevines Grapevines require two consecutive growing seasons for flower and fruit production. Inflorescences are initiated the year before bloom. Environmental conditions required for the formation of the maximum number of inflorescence include high light intensity, optimal temperature (25-30 C), and adequate water and nutrient availability (Mullins et al., 2003). Shoots and inflorescence develop between inflorescence initiation and anthesis. Depending on the species and cultivar, flowers might be female, male, or hermaphroditic (also known as "perfect", which means that each flower contains both male and female structures). By far, the majority of cultivated varieties are hermaphroditic (Pratt, 1971). Anthesis is the period during which a flower is fully open and functional. After bloom, fertilized flowers set fruit, although about 2/3 of the individual florets in the cluster drop off. Grape fruit set and growth is triggered by pollination and correlates with elevated endogenous auxin indole-3-acetic acid (IAA) levels (Cawthon and Morris, 1982). As berries develop, the fruit starts to be a greater 'sink' for photosynthetic products (Coombe, 1989; Ho 1988; Conradie, 1980), and the growth rate of shoots declines. Unfavorable environmental conditions (e.g. cloudy, cool, wet bloom period, water or nutrient stress), insufficient or inefficient leaf area (e.g. due to hail, insect or disease attack) or excessively vigorous shoot growth (competing with inflorescences for assimilates) often result in poor fruit set and loose clusters. Growth of some fleshy fruit such as grape exhibits a double sigmoid pattern in which there are two periods of growth separated by a lag phase (Coombe, 2001; Harris et al., 1968; Ollat et al., 2002) (Figure 1). The first stage is the cell division phase (phase I)
21 7 throughout mid July. Cell division and cell enlargement both contribute to pericarp growth in the early post-anthesis stage. Cell division in the grape pericarp begins 5-10 days before anthesis and continues for approximately 25 days (Harris et al., 1968). Following the cell division phase, is a pause in berry growth called the lag phase or phase II, during which seed formation progresses. Berry turgor pressure also declines about tenfold during this period (Matthews and Shackel, 2005). The length of the lag phase (one to six weeks) depends largely on the cultivar and is important in determining the time of fruit maturity (early vs. late ripening varieties). After the lag phase, the number of cells in each berry is set. Further berry growth is due to cell expansion only (Hardie et al., 1996; Ollat et al., 2002; Coombe 1976; Pratt, 1971). Figure 1: Diagram of a typical double-sigmoid pattern of growth by a grape berry, from anthesis to harvest. As noted in the figure above, in some cultivars, berries may shrivel between ripeness and harvest (redrawn from Coombe, 2001).
22 8 At the end of the quiescent lag phase, veraison (a French word meaning the commencement of berry color change) marks the beginning of ripening. During veraison the berries soften and skin changes in red-fruited cultivars from green to purple, while in white-fruited cultivars the berries acquire a more translucent appearance. The veraison process can continue for two weeks until all berries in the cluster complete the color change (Harris et al., 1968). Water import through the xylem declines gradually while the berry changes color. Although the xylem appears to remain functional (Bondada et. al., 2005; Keller et al., 2006), most of the water for the berry is now provided through the phloem. Berry turgor pressure is low (<0.5 bar), but remains positive and relatively constant throughout ripening (Matthews and Shackel, 2005). The last phase or phase III is characterized by a further increase in berry volume, which is initially very rapid but slows progressively towards fruit maturity. Red pigments (anthocyanins) accumulate in the exocarp, and sugars (glucose and fructose) accumulate in the pericarp, while organic acids (malate) and chlorophyll are degraded (Coombe, 2000; Ollat et al., 2002). Unlike in many other (so-called climacteric) fruits, the fruit-ripening hormone ethylene does not appear to play a prominent role in grape ripening (Coombe, 1976). 1.5 Anatomy of the Grape Berry The grape berry has three major types of tissue (Figure 2): seed, skin and flesh. Grape berries can have a maximum of four seeds, although in practice the seed number is usually one or two (Cawthon et al., 1982, Coombe, 1987). Seeds are made up of the outer and inner integument, which together form the testa (seed coat), the nucellus surrounding
23 9 the developing endosperm, and the embryo (with two cotyledons, epicotyl, hypocotyl, and radicle). After fertilization the pistil develops into the fruit, with the ovary wall (pericarp) becoming the skin and flesh of the grape berry. The pericarp consists of three anatomically distinct tissues: the exocarp, mesocarp, and endocarp (Coombe, 1987). The exocarp forms the grape s dermal system, or skin, which makes up between 5% and 18% of the fresh weight of mature berries. It is made up of a cuticle-covered (singlelayer) epidermis and the underlying outer hypodermis (Considine and Kriedemann, 1972). Epicuticular wax covers the surface of the cuticle forming a strongly hydrophobic layer that protects the berry from water loss (Rogiers et al., 2004). The structure of the epicuticular wax changes with age of the berry. Although the wax is normally crystalline, the crystals appear to degrade slowly over time (Rogiers et al., 2004). The wax material is rather soft and can be altered or removed by the impact of rain, by abrasion from windblown particles, or by contact with other berries and leaves. The mesocarp, which is commonly called the flesh or pulp of the grape berry, consists of 25 to 30 layers of thin-walled and highly vacuolated parenchyma cells. Vacuoles can make up as much as 99% of the cell volume in ripe grape berries and contain sugars and organic acids. While the mesocarp cell walls remain intact, their polysaccharide components (such as cellulose) are modified at veraison to enable the berry to soften (Coombe,1987; Ollat et al., 2002). Moreover, the incorporation of soluble proteins (especially glycoproteins, i.e. proteins attached to sugar molecules) reinforces the cell walls, so that cellular integrity can be maintained during softening (Davies et al., 1999). The outer mesocarp contains the tissues outside the network of peripheral vascular

 and their associated parenchyma cells are termed the brush and remain attached to the pedicel when a ripe grape is plucked from the cluster.")
24 10 bundles of the pericarp; the inner mesocarp is inside the network and, at maturity, makes up almost two thirds of the berry volume (Coombe, 1987). The innermost tissue in the pericarp is the septal tissue, or the endocarp, which surrounds the seeds. Throughout the flesh and under the skin are vascular bundles. The ovular vascular bundles that previously served the ovary give rise to a complex network of vascular traces (axial and peripheral) that supply the seed and the pericarp (Pratt, 1971). The central vascular bundles (axial) and their associated parenchyma cells are termed the brush and remain attached to the pedicel when a ripe grape is plucked from the cluster. Vascular bundles are composed of xylem with the phloem next to it and are responsible for water and nutrients transport through the plant (Matthews and Shackel, 2005). Locule Skin Stylar end Peripheral Vascular Bundle Brush Pedicel Pedicel end Outer Inner Septal Coat Endosperm Embryo Peripheral Axial Ovular Flesh Seed Vascular Bundles Figure 2: Structure of a ripe grape berry partially sectioned on the long and central axis to show internal part (A) (illustration redrawn from Coombe, 2001).
25 Water Flow and Vascular Transport Much of the following information was gathered from the text book Plant Physiological Ecology (Lambers et al., 1998). In plants, exchange of water between the fruit and the plant occurs primarily through the phloem and xylem tissues (Matthews and Shackel, 2005) which represent the vascular transport. The xylem and phloem are interconnected along their entire length, so can readily exchange water and solutes (Evert, 2006; Zwieniecki et al., 2004). Water relations of developing fruit play an important role in determining fruit growth and composition. Grapevine s fresh mass consists between 70% and 95% of water. Most of this water serves as a solvent for ions and organic molecules in vine s cells. Water can diffuse freely (but relatively slowly) across the phospholipid bilayer of cell membranes. Membranes are selectively permeable or semipermeable so, special gates (protein channels and transporters or pumps) are required for molecules other than H 2 O to pass through membranes. Because the concentration of solute in the cell such as sucrose, malic acid, and potassium (K + ) and chloride (Cl - ) are always higher than that of the exterior, there is relatively less water inside the cell than outside. This water concentration gradient causes water to diffuse through aquaporins (Steudle et al., 2000) into the cell and this diffusion is termed osmosis. Osmotic pressure (π) is defined as the hydrostatic pressure required to stop the net flow of water across a membrane separating solutions of different compositions. The movement of water during osmosis will always be from a region of lower solute concentration (i.e. greater water potential) to one of higher solute concentration (i.e. lesser water potential). When water moves into a cell, the wall pressure balances the
26 12 osmotic force. The cell wall raises the energy of the water inside the cell until it becomes equal to the water outside the cell. At this point the cell s internal hydrostatic pressure, termed turgor pressure, is equal to π inside π outside and water flow stops. The solute and pressure forces in plants and soils are described as free energy per unit volume (i.e. equivalent to force per unit area, or pressure) which are termed water potential (Ψ expressed in MPa). Water potential is the sum of the component potentials arising from the effects of turgor pressure (i.e. turgor potential, Ψ P = P) and solutes (i.e. solute potential, Ψ s or osmotic potential, Ψ π = -π) in addition to interactions with matrices of solidss (cell walls) and macromolecules (i.e. matrix potential, Ψ M ), as described by the equation: Ψ = Ψ P + Ψ π + Ψ M. The matrix potential is very close to zero in well-watered plant tissues and is therefore insignificant unless the tissue is dehydrated (e.g. loss of 50% of the tissue water). Pure water has the highest water potential which equals zero (Ψ = 0). Therefore, the water potential of aqueous solutions is always negative (Ψ < 0). Water flow from the soil, roots, leaves to pre-veraison berries, is caused by a water potential gradient (ΔΨ) between the soil and the vine (Keller 2005). In addition, during the transition from dormancy to active growth of a grapevine in early spring, water uptake by the roots and transport to the shoots is driven by positive root pressure (Sperry et al., 1987). Root pressure is induced by remobilization of stored nutrients and starch and unloading of osmotically active solutes into the xylem.
27 13 Using Ohm s law, the flow (F) of water from the soil to the leaves can be described by the equation F = ΔΨ r -1 h where ΔΨ= Ψ soil - Ψ leaf. The parameter r h describes the hydraulic resistance to water flow due to friction between water and conduit walls and between the H 2 O molecules themselves. Most of the r h is imposed by the vine s hydraulic architecture which is determined by the shape, size, and arrangement of xylem vessels as well as the total length of the flow pathway and the number and shape of bends. Also the opening and closing of stomata generates a resistance (stomatal resistance). During the course of the day, stomatal opening (i.e. stomatal conductance, g s ) normally follows the daily change in light intensity, which peaks around midday. Conversely, stomata close when the leaf runs out of water. Therefore, low Ψ leaf (indicating water stress) causes stomata to close partially to protect the xylem conduits (vessels and tracheids) from cavitation (Jones, 1998). In fact, cavitation occurs when the water column inside the xylem is put under too much tension so the water column breaks and fills up with H 2 O vapor or air bubbles (Figure 3-A). Gas blockages (embolisms) greatly increase r h which renders the vessels nonfunctional and can lead to canopy desiccation (Schultz and Matthews, 1988). For the gases to dissolve and reestablish xylem functionality, the xylem pressure must rise to near atmospheric pressure (0.1 MPa) or above (Sperry et al., 2002).

.")
28 14 A B Figure 3: Cavitation of xylem vessel by water vapor bubble (A) (Taiz and Zeiger, 1998); Vascular flow (B) (Nobel, 1999). Pre-veraison berries transpire due to the presence of stomata in the skin. Transpiration has been estimated at ~ 550 μl d -1 in pre-veraison berries and <100 μl d -1 in post-veraison berries (Greespan et. al., 1996, Rogiers et al., 2004). Fruit transpiration declines during development, implying that evaporative water loss during ripening ceases to function as the driving force for water influx (Rogiers et al., 2004). Also a ΔΨ in the xylem is the driving force for water movement to pre-veraison berries, whereas phloem flow is caused by the differences in positive pressure resulting in the loading and unloading of sugars in source and sink regions (Figure 3-B) (Lang and Düring 1991). Phloem unloading in grape berries (similar to tomato fruit), switches at veraison from the standard symplastic (through the cell cytoplasm) route to an apoplastic (extra-cellular including cell walls) path, in which sucrose is released to the apoplast (Zhang et al., 2006).
29 15 Scientists believe that during veraison the grape berry becomes hydraulically isolated, so there is no fluid exchange between the vine and the berry through the xylem vessel (Düring et al., 1987; Findlay et al., 1987; Creasy et al., 1993). Evidence for a xylem breakdown comes mainly from studies of dye tracer perfusion through the pedicel, originally by Findlay et al. (1987) and Düring et al. (1987) and later confirmed for different grape cultivars by Creasy et al. (1993) and Rogiers et al. (2001). In fact, hydraulic isolation of the fruit sink is now often regarded as a necessity for apoplastic phloem unloading (Patrick 1997), as seen in grape (Sarry et al., 2004), apple (Zhang et al., 2004), kiwifruit (Dichio et al., 2003), or tomato (Davies et al., 2000) and such isolation is considered a prerequisite to prevent loss of solutes via the xylem. 1.7 Water Excess and Deficiency Water and nutrients are basic requirements for plant growth and leaf water supply constitutes the limitation on plant productivity. Increasing soil moisture stimulates vigor, which can lead to a denser canopy and shaded fruit (Kriedemann and Goodwin 2003). Abundant water supply ordinarily delays veraison and slows the rate of fruit ripening. High availability of water and nitrogen to the vine has been associated with excessive vegetative growth (vigor). Excessive vigor may have undesirable consequences, such as vegetative growth competing for assimilate (Wade et al., 2000). This can influence many of the processes which affect yield and quality, including budbreak, inflorescence initiation, fruit set, berry growth and the balance between sugars, acids, aroma and flavor compounds which collectively describe fruit quality (Loveys et at., 1998).
30 16 Under natural conditions, water is supplied by snow and rainfall and temporarily stored in the soil for extraction by plant roots. In addition, soil water holding capacity and hence the amount of plant-available water varies with soil depth, texture, and organic matter content. Variation in soil moisture due to differences in water holding capacity and effective rootzone has a pronounced impact on vine performance (Hall et al., 2002). Water deficit typically reduces yield (Williams and Matthews, 1990) and fruitset (Hardie and Considine, 1976) and can increase or decrease berry sugar content, acidity, ph, and color (Matthews and Anderson, 1988) depending on the extent and timing of the deficit. Pre-veraison water stress tends to have a greater effect on berry size reduction as compared to post veraison water stress (Matthews and Anderson, 1988). Mild water deficit (-1.2 MPa) is ordinarily applied before veraison to limit shoot growth which may increase sugar accumulation in the berry by reducing canopy density (Kriedemann and Goodwin, 2003). However, water stress can delay berry development because of a reduction in photosynthesis or, in extreme cases, leaf drop (Kriedemann and Goodwin, 2003). In addition, water stress induces the formation of air bubbles in the xylem vessel called cavitation which stops xylem flow. Therefore root pressure pushes out air bubbles and reestablishes xylem functionality. To produce premium wines, growers frequently receive bonus payments for fruit with above-average sugar and/or color concentration. Grape growers and winemakers are often concerned about the dilution of grape quality or even cracking of berries by late season irrigation or rain. This popular belief, written into the law in Europe, prohibit or strictly regulate irrigation after veraison (Galet, 2000; Keller et al., 2006).On the other
31 17 hand, grape berries tend to shrivel at the end of maturity losing up to 25 % of the predicted yield (Rogiers et al., 2006; McCarthy and Coombe, 1999; McCarthy, 1999). 1.8 The Hypothesis Our hypothesis is that xylem is functional in the post-veraison stage and is responsible for recycling excess water from the berry (Bondada et al., 2005; Keller et al., 2006) while phloem flow is responsible for transporting sugar diluted in water into the berry (Greespan et. al., 1994, Rogiers et al., 2004). Consequently, irrigation later in the season could actually help berry ripening due to high photosynthetic activity and could maintain berry weight without an increase or decrease in berry-size due to water flow. Moreover, xylem functionality during ripening combined with natural root pressure may increase berry size and dilute the quality of the grape. Root pressure, which is the driving force for sap flow in early spring (Fisher et al., 1997), is generated by a degradation of starch in the root in glucose which then actively moves from the parenchyma cells to the xylem vessel resulting in hydrostatic pressure. Our hypothesis is that the same starch degradation process may happen during ripening when the plant is under water stress. If the stressed plant with high concentration of sugar in the xylem vessel could find water available due to late season rainfall or irrigation, the root pressure generated by osmosis may be higher than the xylem backflow from the berry resulting in an influx of water. An increase of water inside the berry before harvest may result in increased berry volume, which could lead to dilution of berry sugar concentration or even cracking. Also, during rainfall, berries may take up water directly through the skin (Lang and Thorpe, 1989),
32 18 which suggests overhead sprinkler irrigation or rainfall might effectively dilute berry solutes. Knowing how water flows in and out of the berry during ripening is important for both wine and juice grape industries. In wine grapes, winemakers desire small berries that have a high sugar concentration (~25 Brix soluble solids), a high proportion of skin and seed derived compounds, and high skin-pulp ratio for good color extraction which are requisites for high quality wine. In juice grapes, growers want to maintain a sugar content above 16 Brix, and keep the weight of the berries as high as possible. Since rainfall is likely to occur late in the season (September-October), knowing how water moves into and out of the berry and through the skin and how much it affects berry size would be helpful to viticulturists and winemakers for scheduling harvest time. In regard to health of the vines, water stress would decrease photosynthetic rate which would cause a lower accumulation of sugar inside the berry and a depletion of starch reserves in roots resulting in poor cold hardiness and budbreak (Mullins et al., 2003). The experiments described in this thesis were set up to examine if: berry size responds to dry-down and re-watering cycles during veraison; berry size responds to rapid changes in plant water status during veraison; xylem connections between the berries and the rest of the plant are intact; irrigation or rainfall affects berry weight at different maturation stages; water can enter in the berry through the skin and pedicel; xylem backflow is an overflow mechanism to balance the amount of water inside the berry; sugar can leach out from the pedicel; and sugar can be exported between berries.
33 19 CHAPTER TWO MATERIALS AND METHODS
34 Location of the experiments The study was conducted from 2005 to 2007 on own-rooted grapevines V. vinifera (Merlot, Chardonnay, Muscat Blanc), and V. labruscana (Concord). Grapevines were grown in white 20.0 liter PVC pots and black 3.0, 5.0, 10.0 liter PVC pots containing a mixture of 50% sandy loam, 25% peat moss, 25% pumice, and 30 g/l dolomite. The vines were grown outside in the full sun light (photosynthetic photon flux ~1820 μmol m- 2 s-1 under clear sky at midday) (Figure 4) then moved inside in the air-conditioned glass houses (Figure 5) at the Irrigated Agriculture Research and Extension Center in Prosser, Washington, USA (46 17 N; W; elevation 270 m). Prosser is located in Yakima Valley which has a semi-arid climate. The growing season in this region is characterized by warm days and cool nights with a long-term ( ) average accumulation of 1344 growing degree days (base 10 C) and low rainfall (199 mm/year) (Figure 6) ( Meteorological conditions in the glasshouse were recorded with a HMP45 (Vaisala, Oyj, Finland) temperature and relative humidity sensor (Figure 7). In addition to the potted plants, clusters were also collected from Merlot, Muscat Blanc, Chardonnay and Concord grapevines from two vineyards at the Irrigated Agriculture Research and Extension Center in Prosser, Washington. One vineyard was planted in 1984 in north-south oriented rows on a ~5% south facing slope at an elevation of 270 m. The other vineyard was planted in 1999 in north-south oriented rows at an elevation of 363 m. Both were spaced at 1.8 m (within rows) by 2.7 m (between rows) and were trained to a bilateral cordon with loose vertical shoot positioning.


35 21 Figure 4: Vines grown in white 20.0 liter PVC pots at the Irrigated Agriculture Research and Extension Center in Prosser, Washington, USA. A B Figure 5: Glasshouses used for experiments at the Irrigated Agriculture Research and Extension Center in Prosser, Washington, USA. (Light intensity in glass-house A= photosynthetic photon flux ~ 860 μmol m -2 s -1 under clear sky at midday; glass house B= photosynthetic photon flux ~1180 μmol m -2 s -1 under clear sky at midday).
36 22 Figure 6: Climate of 2006 at IAREC Prosser, WA. Data from AgWeatherNet, Prosser, WA, USA. 2.2 Dry- down and re-watering experiment A dry down and re-watering experiment was conducted to determine the response of berry size to dry-down and re-watering cycles during veraison to understand whether the vine is sensitive to plant water status at that stage. Concord and Merlot were used in this study to determine and understand how the genus Vitis behaves. Berry size was monitored daily with a digital caliper (General Tools, New York, USA; 0.01 mm resolution) to identify the lag phase. During the lag phase berries stop growing for several days just prior to veraison. When the berries reached the lag phase, vines were no longer irrigated resulting in berry shriveling while the berries were at soluble solids level from 5 to 7 Brix for Concord and 6 to 8 Brix for Merlot. Three plants of each variety were used for the experiment and the experiment was repeated three times over two seasons. During each dry-down experiment changes in berry diameter were recorded on
37 23 three berries per vine, using FI-XSM linear variable displacement transducers (Phytech, Rehovet, Israel, figure 7-B) inside the glasshouse. Transducers were connected via an AM416 relay multiplexer (Campbell Scientific, Logan, UT, USA) to a CR10X data logger (Campbell Scientific, Logan, UT, USA), to the computer (Figure 8). The calibration for the sensors was preformed by attaching the sensors to different diameter surfaces (0, 0.96 mm, 3.18 mm, 6.45 mm, 9.99 mm) and reading the sensor measurement in mv. The plants were also placed on digital balances (Rice Lake Weighing System, Rice Lake, WI, USA) (Figure 7-A) connected via an AM 416 relay multiplexer to a CR10X data logger to record transpiration. The digital balances were calibrated by measuring known weight in mv. The pot surfaces were sealed with a plastic bag to prevent water loss by evaporation from the soil (Figure 7-A). Transpiration was calculated by subtracting the daily weight of the pot from the initial weight. During veraison berries with similar color to the berries analyzed by the sensors were collected and soluble solids content (Brix) was measured with the refractometer (Pocket PAL-1, Atago, Tokyo, Japan) to determine their stage of ripening. When the berries changed color to red-purple, each vine was irrigated with 2 L of water. The experiment was terminated two days after irrigation. At the end of each experiment, the selected berries were removed, and the soluble solids content was measured.


38 24 HMP45 A Balance B FI-XSM linear variable displacement transducers Figure 7: Plants placed on digital balances and the pot surfaces sealed with a plastic bag to prevent water loss by evaporation from the soil (A). Meteorological conditions in the glasshouse recorded using an HMP45 temperature and relative humidity sensor (A). Also, berry diameter recorded with FI-XSM linear variable displacement transducers (B). CR10X data logger Computer AM416 relay multiplexer Figure 8: FI-XSM linear variable displacement transducers connected via an AM416 relay multiplexer to a CR10X data logger which was connected to the computer.
39 Root pressurization experiments Berry size response This experiment was conducted to determine the effect of rapid changes in plant water status on berry size during veraison. Pressure was applied to three Concord vines with a population of berries colored from green to blue (6.2 to 13.2 Brix) after having been dried down for five days and re-watered. When pressure is applied to a plant s root system, the entire xylem becomes pressurized (Wei et al., 2000). A custom-built 26-L metal root pressure chamber, based on the design by Yong (2000) and modified by Smith (2004) (Figure 9) was used in this study. The chamber was designed with a split lid such that the entire white 20.0 L PVC pot could be placed inside the chamber and the lid sealed around either side of the vine trunk. The join line of the lid was covered with a fast setting two-part silicon epoxy and the two halves of the lid were pulled together forming an air-tight seal. A split silicon bung (Dow Corning Silastic 3481, Wiesbaden, Germany) with a hole to match the trunk diameter was then pushed into the well in the center of the lid and a compression collar bolted down to seal around the stem (Figure 9-B). Pneumatic pressure was applied to the chamber under manual control with compressed air and was monitored with an analog pressure gauge. Gas flow to the chamber was regulated via metering and 3-way valves. The procedure was a rapid one-step increase to 10 bar in root pressure to bring the plant to full hydration (Ψ leaf 0 MPa) within a few minutes. This pressure was held for approximately 3 hours and 30 minutes with adjustments made manually to maintain the vine at full hydration. Seven FI-XSM sensors were used to monitor berry diameter. At the end of each experiment, the selected berries were removed, and the soluble solidss content was measured with a refractometer.
,")
.")
40 26 A B Figure 9: Different perspectives of the custom-built 26-L metal root pressure chamber (A and B), based on the design by Yong (2000) and modified by Smith (2004). The compression collar bolted down to seal around the stem (B).
41 Xylem sap collection The root pressure chamber was used to collect xylem sap to determine whether the vine mobilizes and pumps sugar into the xylem vessels to generate root pressure when water stressed. This normally happens in early spring before budbreak when the vine does not have any leaves (Sperry et al., 1987). After veraison, three vines of Concord grown in 20.0 L PVC pots were not irrigated for a week. The Model 615 Pressure Bomb (PMS Instrument Company, Corvallis, Oregon, USA) (Figure 10-A). was used to determine leaf water potential (Ψ leaf ). The leaf was cut from the vine using a sharp razor blade (Feather S, 0.1 mm, Tokyo, Japan) and quickly inserted and sealed in the chamber. When the Ψ leaf reached -2 MPa, one vine at the time was irrigated with 2 L of water and inserted into the root pressure chamber (Figure 9). Pressure was applied to keep the vines at full hydration. A cluster was cut off to expose fresh tissue and a length of parafilm TM (American National Can, Chicago, Illinois, USA) was then wrapped around the peduncle for collecting the sap into an HPLC vial (Figure 10-B). Approximately 0.5 ml of xylem sap was collected from each vine after pressurizing at 10 bar for 2 hours. The sample was centrifuged for 1 min at 10,000 rpm in a centrifuge tube. The collected sap was analyzed for sugar concentration by HPLC Agilent-1100 series (Agilent Technologies, Munich, Germany). The sugar analysis was carried out using a solvent system (acetonitrile: water = 80:20) and an injection volume of 8μL. The column temperature was 30 C and refractive index detector temperature was 30 C. The flow was 1.1 ml min -1 and run time was 11 minutes. The column used was an Agilent Zorbax Carbohydrate analysis column (4.6mm X 150 mm, 5 micron, Agilent Technologies, Chicago, Illinois, USA).
. 2.3.")

42 28 A B Figure 10: The Model 615 Pressure Bomb used to determine the leaf water potential (A). A length of parafilm TM wrapped around the peduncle of the cut cluster to attach an HPLC vial for collecting the xylem sap (B) Leaf water potential / photosynthesis rate / xylem sap collection This experiment was conducted to understand how the water stress and rewatering cycle applied to Merlot and Concord vines undergoing veraison affects the physiological status of the vine. Moreover it was conducted to determine how rapidly the photosynthetic rate recovers after irrigation of water-stressed vines. The experiment was carried out in the glasshouse on a total of four vines at their lag phase of berry growth. The pots were watered at field capacity and then allowed to dry down. The Portable Photosynthesis System CIRAS-2 (PP Systems, Amesbury, Massachusetts, USA) was used to measure the photosynthesis rate (A) (Figure 11). The Model 615 Pressure Bomb was used to determine Ψ leaf as described in The root pressure chamber described in was used for the collecting of xylem sap. All data were collected at the beginning of the experiment and after 5, 10 and 15 days. The photosynthetic rate was measured on the same three leaves before and after watering the vines with 500 ml of water. The leaves were selected from the fifth leaf from the tip of the main shoot. Photosynthesis was

43 29 recorded from 10 to 11 o clock before irrigation and from 12 to 13 o clock after irrigation when the photon flux was ~1180 μmol m -2 s -1 inside the glasshouse. Then after watering and photosynthesis measurements, root pressure was applied to each vine to bring the plant to full hydration. A length of parafilm TM was wrapped around the petiole of a cut leaf to collect the sap into an HPLC vial. The root pressure was held for two hours at 10 bar and nearly 0.5 ml of xylem sap was collected from each vine. The collected sap was analyzed for sugar concentration by HPLC as described in Figure 11: Photosynthetic rate measured by the Portable Photosynthesis System CIRAS-2.
44 Dye feeding experiments Three dye feeding experiments were done to trace xylem connections between the berries and the rest of the plant and to attempt to quantify the xylem pressure inside of the berry using the xylem-mobile dye basic fuchsin (Sigma-Aldrich, St. Louis, MO, USA) Dye feeding without pressure The first dye feeding experiment was conducted on three clusters of Merlot and Concord at veraison without pressure. Clusters of dark-skinned cultivars undergoing veraison have a population of berries ranging from green to blue with soluble solids between 7 to 18 Brix. The clusters were cut off by a sharp razor blade and the peduncles were immediately placed in a centrifuge tube containing 30 ml of the xylem-mobile dye basic fuchsin (0.1 % aqueous solution) (Figure 12). The tubes were sealed around the peduncle with parafilm TM to prevent evaporation. Clusters were kept in dye for 24 hours in the glasshouse at a temperature of ~21 C and 65% humidity. Twenty berries for each cluster were then visually rated for the progression of skin pigmentation (green, blush, pink, red, purple and blue) before being sectioned longitudinally for light microscopy. The extent of dye movement into the berry was rated visually and assigned a number from 1 (in brush only) through 6 (continuous throughout entire vascular network) (Figure 13). Following microscopy, the berry juice was expressed and soluble solids concentrations were measured with refractometer.


45 31 Figure 12: Correlation between dye basic fuchsin dilution and color intensity. Figure 13: The extent of dye movement into the berry rated visually and assigned a number from 1, when the dye stops in the brush region, through 6, when the dye continues throughout the entire vascular bundles.
46 Dye feeding / shoot pressure chamber Dye feeding experiments with pressure applied were conducted in two different stages of berry development. The first set of experiments was performed using Concord, Merlot, and Chardonnay at veraison and the second was conducted later in the season using Merlot, Muscat Blanc and Chardonnay at ~ 22 Brix. Shoots with mature leaves and one cluster were collected from field-grown grapevines in nearby vineyards for both experiments. The freshly cut base of the shoot was inserted through the gland and dipped into the dye container which was placed inside the Model 615 Pressure Bomb. The gland was then tightened around the shoot enough to assure that no gas and dye would escape during the pressurization (Figure 14). The dye was then pushed from the chamber into the cut shoot by pressure. In the first set of experiments, leaves of the shoot were cut off, and cut surfaces were burned and sealed with parafilm to avoid pressure dissipation (Figure 14-A) while in second set of experiments leaves where left on the shoot (Figure 14-B). During veraison, four different experiments were conducted. The first consisted in pressurizing Concord and Merlot clusters to 1 bar for 30 and 60 minutes and 60 berries were sampled. The second consisted in pressurizing Concord and Chardonnay clusters to 2 bar for 30 minutes and 100 berries were sampled. The third consisted in pressurizing Concord clusters to 1, 2 and 4 bar for 30 minutes and 50 berries for each treatment were sampled. The last experiment consisted in pressurizing Concord clusters to 2 bar for 30, 45 and 60 minutes and 50 berries for each treatment were sampled. For all the berries sampled, the extent of dye movement inside of the berry was rated as described in (Figure 13). Selected berries were also recorded for their skin color, and soluble solids content was measured with refractometer. In the post-veraison study, the freshly cut base


47 33 of the shoot was pressurized to 0, 2 and 4 bar for 45 minutes. Each 15 minutes of pressurization, 5 berries were sampled, sectioned longitudinally to determine dye location and soluble solids content measured. The experiment was repeated three times for each variety and for each pressure. A B Figure 14: Both figures show a freshly cut shoot inserted through the gland and placed inside the chamber. Merlot shoot with a cluster during veraison and no leaves with cut surfaces sealed by parafilm (A). Merlot shoot with ripe cluster and leaves (B).
. The vine was brought to full hydration by a pressure around 5 bar for 30 minutes and a leaf next to the selected cluster was cut off with a sharp razor blade.")
.")
48 Dye feeding reverse / root pressure chamber In the final dye feeding experiment, three potted post-veraison Chardonnay vines (soluble solids ~22 Brix), were placed in the root pressure chamber (Figure 15-A). The vine was brought to full hydration by a pressure around 5 bar for 30 minutes and a leaf next to the selected cluster was cut off with a sharp razor blade. When water came out of the petiole of the cut leaf, two berries were cut at the stylar end to expose the peripheral (dorsal) and axial (ventral) vascular bundles. The cut end of each berry was then immersed in 0.1% dye solution while still attached to the rest of the plant (Figure 15-B). The roots were pressurized at 5 bar for 5 hours, then 2 bar for 5 hours, then 1 bar for 5 hours and, finally no pressurization for 5 hours. Additionally, three potted post-veraison Chardonnay vines were fed dye without pressurization. Clusters were removed and crosssections of the pedicel (proximal) end of the treated berry, the pedicel, the rachis, other berries on the same cluster, the peduncle, the leaves and shoot above and below the cluster were examined for dye movement using light microscopy. A B Figure 15: Dye basic fuchsion fed to the berry by using a stand placed next to the pressure chamber (A). A Falcon tube used to feed the berry (B).
49 Berry weight response to immersion experiments The following experiments were conducted to understand whether irrigation or rainfall affects berry weight at different maturation stages and whether water could enter in the berry through the skin or pedicel. The study was also conducted to determine whether xylem backflow was an overflow mechanism to balance the amount of water inside the berry and whether sugar could leach out from it Berry weight response to immersion Post-veraison Concord and Merlot berries at ~18 and ~22 Brix respectively were immersed in 10 ml distilled water and six different treatments were applied to ten berries for each variety. The treatments were: entire berry immersed; pedicel immersed with berry protruding from the water (Figure 16-A); berry immersed after sealing the pedicel with petroleum jelly and the pedicel protruding from the water (Figure 16-B); berry immersed with unsealed pedicel protruding from the water (Figure 16-C); berry entirely sealed or skin only sealed and fully immersed. The experiment was done to observe whether water was taken up through the skin or/and pedicel and whether sugar leaches out from it. All the berries were kept in water for five days and water uptake was measured by weighing the berries before and after the test. At the beginning of each treatment, berries with similar color to the berries immersed in water were collected and soluble solids were measured with refractometer. Berry cracking was monitored daily. At the end of the experiment, measurements of soluble solids were taken in the water in which berries were immersed and in the berries after immersion. The amount of sugar lost from each berry was calculated considering that the refractometer calculates sugar
. Berry immersed with the sealed pedicel protruding from the water (B).")
 were collected and immersed in small beakers containing 10 ml water (Figure 17).")

50 36 concentration in g 100 ml -1 (Brix) and that the berries were immersed in 10 ml of water, so 0.1 Brix in the water is equal to 10 mg of sugar lost. A B C Figure 16: Pedicel immersed with the berry protruding from the water (A). Berry immersed with the sealed pedicel protruding from the water (B). Berry immersed with the pedicel protruding from the water (C) Early post-veraison berries / response to immersion One hundred Concord berries at a pink color stage (about 11 Brix) were collected and immersed in small beakers containing 10 ml water (Figure 17). Previously, a correlation between color and soluble solids was calculated after analyzing hundreds of berries so the color-brix correlation was an assumption used to estimate soluble solids content during veraison. Fifty berries were immersed in distilled water with ph 5.93 similar to rain water. The ph was measured using Mettler-Toledo Mp 255 ph meter (Mettler-Toledo, Schwerzenbach, Switzerland). The other fifty berries were immersed in tap water with ph 7.91 similar irrigation water. All the berries were left in water for five days and their initial and final weight were recorded. Also, berry cracking was monitored daily. At the end of the experiment, soluble solids were measured in the water used for immersion and in the berries after immersion.

51 37 Figure 17: A pink Concord berry totally immersed in water Late post-veraison berries / response to immersion One hundred Concord berries at approximation soluble solids content of 18 Brix were collected and immersed in small beakers containing 10 ml water. Fifty berries were immersed in distilled water with ph 5.93 similar to rain and the other fifty berries were immersed in tap water with ph 7.91 similar to irrigation water as described in All the berries were held in water for five days and their initial and final weight were recorded. Berry cracking was monitored daily. At the end of the experiment soluble solids were measured in the water used for immersion and in the berries after immersion.
52 Heat-girdling experiment A girdling experiment was conducted on Merlot to understand whether sugar can be exported between berries. Ten clusters were selected on the plant during veraison and the selection was based on the main part of the cluster having a population of berries from green to blue with a shoulder of only green berries (Figure 18-A). The green shoulder had berries with a range of sugar concentration from 5 to 7 Brix. Girdling was performed on the peduncle near the shoot in order to stop the sugar influx from the leaves to the berries through the phloem (Figure 18-B). Five clusters also were girdled on the lateral branch of the cluster to avoid sugar import from the main cluster to the green shoulder. The peduncle was heat-girdled by applying 12 V to a 24-cm length of 60% Ni, 16% Cr resistance wire for 4 seconds (Figure 19). The heat time was reduced to 2 seconds for the shoulder of the cluster because of the smaller diameter. Five to ten hard green berries on the shoulder with estimated soluble solids content of 5.5 Brix were tagged with cable ties which are designed to help identify cables, wires and pipes (Partex Marking System, Birmingham, United Kingdom). Other hard green berries were tagged on non girdled clusters as control. Half of the tagged berries were collected after 5 days and the remaining berries after 10 days following the girdling. Berries collected were analyzed for soluble solids content with refractometer.


. A B Figure 19: The")
.")
 or with")
53 39 A B Figure 18: A Merlot cluster during veraison with a green shoulder (A). The heat-girdling applied to the peduncle of the cluster (B). A B Figure 19: The heat-girdling instrument used (A). The top of resistance wire without (top) or with (bottom) a current of 12 V switched on (B).

54 40 Figure 20: The heat-girdling damage on the peduncle. Moreover ten clusters of Merlot and Concord with a population of berries from green to blue were cut from the vine and hung on the wind wire next to where they had been removed. The excised clusters were left on the wires for five days and then the visible color was observed. At the end of the experiment soluble solids content was measured for the 30 berries with similar color for attached and unattached clusters for each variety. This treatment was conducted to see whether the berries could change color when detached from the vine. At the same time other clusters undergoing veraison were also detached from the vine and immersed in distilled water for five days to see whether berry skin color would change. 2.7 Statistical analyses Data were subjected to analysis of variance, linear regression, and post-hoc comparisons of treatment means which were performed using Duncan s new multiple range test, using Statistica (version 7.1, StatSoft, Tulsa, OK, USA). Correlations between berries response variables were assessed using Pearson s correlation coefficient (r).
55 41 CHAPTER THREE RESULTS

.")
56 Dry-down and re-watering The three experiments gave similar results so data of one are shown. The average solute concentration at the end of the experiment was 12.5 Brix for the Concord and 12.1 Brix for the Merlot. Pre-veraison berries started shriveling 16 and 18 days for Concord and Merlot respectively after the irrigation was stopped. At the beginning of veraison (solute concentration for Concord was estimated at ~9 Brix and for Merlot at ~10 Brix) berries started to increase in size even though water was not available in the soil. Green berries in both cultivars were visibly shrinking while the blush-pink berries were expanding (Figure 21-A and B). Data recorded from the FI-XSM linear sensors (Figure 22) confirmed that berries stopped shrinking during color change. A B Figure 21: Concord (A) and Merlot (B) berries on water-stressed vine started to expand as soon as color changed from green to blush-pink while the green berries kept shriveling due to low soil moisture. Transpiration was low due to the long water stress period before berry shriveling started and increased drastically after watering. The increase in berry size during veraison was accentuated by re-watering for both varieties (Figure 22). In Concord berry size could increase up to 30% of initial size (Figure 22-A) while in Merlot increased up to 7% of the initial size (Figure 22-B).
57 43 Berry size (% starting diameter) Berry size (% starting diameter) Concord A = veraison Irrigation 80 ml 40 ml 20 ml 10 ml 10 ml 280 ml Merlot B Days after the irrigation stopped = veraison Irrigation 60 ml 30 ml 20 ml 10 ml 10 ml 190 ml Brix Brix Days after the irrigation stopped Figure 22: Change in diameter of Concord (A) and Merlot (B) grape berries at veraison during a soil dry down and rewatering cycle. Solids circle indicates the beginning of color change while the vertical line indicates rewatering. Transpiration is reported on the x axis.
58 Root pressurization During veraison Concord berries responded within 20 minutes to changes in plant water status imposed by the application of up to 10 bar pressure to the root system (Figure 23). The berries below 9 Brix soluble solids showing a green color increased up to 10% their size under pressure. Moreover after three hours of pressurization preveraison berries stopped expanding and maintained their size without cracking. When berries were at a soluble solids content at least of 9 Brix with a blush color, their diameter no longer responded to root pressure. However, some berries without sensors on the same plant cracked under pressure when their soluble solids was > 11 Brix and their skin color was blue (Table 1). Pink and red berries never cracked. Berry size (% starting diameter) Brix Duration of pressurization (min) Figure 23: Effect of pneumatic pressure applied to the Concord root system at veraison. Changes in diameter of seven berries on the same vine recorded with electronic transducers.
59 45 Table 1: Skin color, weight and soluble solids of cracked Concord berries due to application of pneumatic pressure to the root system. Color Weight (mg) Soluble solids (Brix) Blue Blue Blue Blue Blue Blue Blue Blue Blue Blue Blue Blue Blue Blue Sap collected from Concord vines under water stress (Ψ leaf = -2 MPa) was analyzed for sugar (glucose, fructose and sucrose) concentration by HPLC (Figure 24). The total sugar concentration was found to be g L -1 for the three vines tested. Norm RID1 A, Refractive Index Signal (PRADEEP\S8_11-01.D) FRUCTOSE GLUCOSE SUCROSE min Time (min) Figure 24: HPLC chromatogram of sugar in a xylem sap sample from a Concord vine.
60 46 In the other experiment, no sugar was detected in the sixteen sap samples collected from Merlot and Concord vines during veraison. This may be due to the higher Ψ leaf than the previous experiment where Concord reached -2 MPa while in this case Ψ leaf never dropped below -1.5 MPa and -1.7 MPa in Concord and Merlot respectively since vines were rewatered before sap collection. It was observed that the photosynthetic rate and stomatal conductance increased when the vines were irrigated with 500 ml of water regardless of water stress or phenological stage (Table 2). The photosynthetic rate increased up 270% in Merlot and 320% in Concord and the increase was observed after 2 hours from watering. At the pre-veraison and veraison phenological stages, photosynthesis is closely correlated with severe of water-stress (r = -0.92, p<0.001). Table 2: Photosynthetic rate (A) and stomatal conductance (g s ) compared to Ψ leaf at different phenological stage for Merlot and Concord. Variety Phenological stage Ψ leaf (MPa) Before irrigation A g s (μmol CO 2 m -2 s -1 ) (mmol m -2 s -1 ) After irrigation A g s (μmol CO 2 m -2 s -1 ) (mmol m -2 s -1 ) Concord pre-veraison Merlot pre-veraison Concord pre-veraison Merlot veraison n.d. n.d Concord veraison Merlot veraison Concord post-veraison Merlot post-veraison n.d. = not detected.
61 Dye feeding Basic fuchsin clearly behaved as a xylem lumen-mobile dye and the dye always remained confined to xylem vessels and tracheids, regardless of whether it was fed via the shoot base (forward infusion) or via the berries (reverse infusion). For both Merlot and Concord, feeding dye to shoots without pressure resulted in a decrease in dye penetration through the berry s vascular system as the berry changed color from green to blue (Figure 25). Once the berries reached Brix (purple-blue color) the dye was confined to the brush region. However there are significant differences between Concord and Merlot dye uptake (Figure 25). 6 (a) Concord Merlot p< (ab) (b) Dye location 4 3 (c) (cd) 2 (cde) (de) (de) (e) (e) Skin pigmentation Figure 25: Correlation between dye location (1 in the brush, 6 continuous throughout entire vascular network) and skin color (from green 1 to blue 6) of grape berries during veraison (error bars represent standard error of the mean, 40 n 55)
. The dye in pre-veraison Merlot and Concord berries at ~ 5.5 Brix (hard green berry), was found to be continuous throughout the entire vascular network.")
62 48 As soon as Concord reached a sugar concentration of 9-10 Brix at the blush color stage (Figure 26), the dye was likely to be near the brush region whereas in Merlot dye was located in position 4 at a similar skin color (Figure25). The dye in pre-veraison Merlot and Concord berries at ~ 5.5 Brix (hard green berry), was found to be continuous throughout the entire vascular network. In contrast when berries started softening (7-8 Brix in Concord, 8-9 Brix in Merlot) just before blush color stage, the dye movement became discontinuous in the stylar end as seen in several different stages linked with color, softening and dye location at veraison (Figure 26). 1-A 1-B Figure 26: The seven stages of berry skin pigmentation linked with softening and dye location during veraison from hard green to blue color: 1-A hard green, 1-B soft green, 2-blush, 3-pink, 4- red, 5-purple, 6-blue.
63 49 The first experiment during veraison in which Merlot and Concord shoots were pressurized to 1 bar for 30 and 60 minutes, showed that dye location was near the brush when berries reached 14 Brix. No significant differences were noted between varieties and time of pressurization on dye location. Moreover when dye was pressurized into the shoot for five hours at 1 bar no dye was found beyond the brush region above 14 Brix (data not shown). However, pressurization changed the extent of dye penetration at 11 Brix (Figure 27) min r = -0.87, p < min r = -0.82, p < Dye location Soluble solids (Brix) Figure 27: Correlation between berry soluble solids and dye location (1 in the brush, 6 continuous throughout entire vascular network) when berries were pressurized to 1 bar for 30 and 60 minutes.
64 50 The pneumatic pressure applied at the base of the shoots in the following experiments was able to push the dye into the berry through the vascular bundles during veraison (Figure 28, 29 30, and 31). The second experiment which consisted of pressurizing Chardonnay and Concord shoots to 2 bar for 30 minutes showed that the pressure was able to move the dye beyond the brush even when berries were 14 Brix. However there were not significant differences between varieties (Figure 28). 7 6 Concord r = -0.60, p<0.001 Chardonnay r = -0.53, p< Dye location Soluble solids (Brix) Figure 28: Correlation between dye location (1 in the brush, 6 continuous throughout entire vascular network) and soluble solids for Concord and Chardonnay cluster upon veraison when shoots were pressurized to 2 bars for 30 minutes.
65 51 The third experiment at veraison consisted of applying different pressures such as 1, 2 and 4 bar for 30 minutes to Concord and Merlot shoots. The result confirmed that dye could move through the xylem inside the berry when pressure was applied, although there were no significant differences between pressures (Figure 29) bar r= -0.86, p< bar r= -0.59, p< bar r= -0.82, p< Dye location Soluble solids (Brix) Figure 29: Correlation between dye location (1 in the brush, 6 continuous throughout entire vascular network) and soluble solids under three different pressures applied to the shoot base (1, 2 and 4 bars) at veraison in Concord and Merlot berries.
66 52 For the last experiment during veraison, Concord shoots were pressurized to 2 bar for 30, 45, and 60 minutes. The low correlation between soluble solids and dye location confirmed that pressure was able to push the dye into 14 Brix berries. However there were no significant differences between duration of pressurization (Figure 30) min. r = -0.59, p< min. r = -0.61, p< min. r = -0.69, p< Dye location Soluble solids (Brix) Figure 30: Correlation between dye location (1 in the brush, 6 continuous throughout entire vascular network) and soluble solids under different times of pressurization at 2 bars in Concord clusters.
67 53 Chardonnay, Muscat Blanc and Merlot berries behaved identically to shoot base pressure when they were at ~22 Brix. When pressure was applied, dye could move into the post-veraison berries, confirming the integrity of xylem vessels in post-veraison berries. In addition, dye could move farther into the berries when shoots were pressurized to higher pressure for longer time (Figure 31) bar 2 bar p< bar Dye location Duration of pressurization (min) Figure 31: Shoots of Chardonnay, Muscat Blanc and Merlot pressurized by the pressure bomb at 0, 2 and 4 bar for 15, 30 and 45 minutes. The extent of dye movement inside of the berry was rated visually and assigned a number from 0 (no dye) through 6 (continuous throughout entire vascular network). Error bars represent standard error of the mean (15 n 45). During the dye feeding experiments at veraison a large number of berries were analyzed for their color and soluble solids concentration. A correlation between color and soluble solids was calculated for Merlot and Concord (Figure 32). Also a threshold for
68 54 the beginning of skin pigmentation has been noted at 9 Brix for Concord and 10 Brix for Merlot. In addition, blue berries always had >15 Brix. 7 Concord 6 r = , p< Skin pigmentation A Soluble solids (Brix) r = -0.93, p <0.001 Merlot Skin pigmentation B Soluble solids (Brix) Figure 32: Correlation of the development of skin pigmentation (from green 1 to blue 6) and the soluble solids concentration inside the berry for Concord (A) and Merlot (B).

69 55 The reverse dye infusion to Chardonnay berries at ~22 Brix indicated that the dye fed from the berry did not move back to the vine when pressure was applied to the root system. Also, the dye did not move back to the vine even when the pressure applied was 1 bar for 5 hours at the root system. However the dye always moved back through the berry tracheids and through the pedicel when pressure was released. Also the dye movement could be traced throughout the peduncle of the dye fed berry s cluster (Figure 33), nearby leaves, beyond the basal leaf, and towards the trunk of the vine. Although dye also moved to other berries on the same cluster, it stopped in the brush region. The same behavior was observed for the control treatment without pressure. Figure 33: Movement of the xylem-mobile dye basic fuchsin infused from the stylar end of attached Chardonnay grape berries. The photo shows the radial section of the peduncle of cluster where the berry was infused. 3.4 Berry weight response to immersion The immersion experiment with different treatments applied to post-veraison Merlot and Concord berries at a concentration of soluble solids ~ 22 and ~18 Brix respectively showed that berries gained weight. In addition, Concord berries were more likely to crack than Merlot. There was no difference in water uptake between varieties due to a big variation in volume of cracked berries (Figure 34). The variation was due to
70 56 the inability to weigh all berries at the end of the experiment, because some of the cracked berries had become heavily infected with mold Concord Merlot p=0.051 Berry weight change (%) No Crack Yes Figure 34: Weight gained by Merlot and Concord berries immersed in distilled water in correlation with cracking. (Error bars represent standard error of the mean, 5 n 51). However there were differences among treatments regardless of varieties and berry cracking (Figure 35). In fact, berries entirely immersed with the skin sealed (C) gained the same weight as the berries entirely immersed without sealing (E) showing that water may move inside the berry through the pedicel. Water uptake was the same when the entire berry (F) or just the pedicel (D) was sealed but the weight gain was similar to treatment C and E. Moreover, berries entirely sealed gained weight (F) evidencing that the sealant was not able to avoid water influx into the berry. In addition, the weight gain was significantly lower when the berry protruded from the water with pedicel immersed
71 57 (A) and when the berry skin was immersed with the pedicel protruding from the water (B). Also, the immersion of the pedicel with the entire berry out and the totally immersed berry showed that berries for both varieties lose up to 10 mg of solutes. On the other hand, no soluble solids were found in water when berry skin was unsealed and the pedicel was sealed. This shows that solutes can be lost from the berries through the pedicel when berries did not crack p<0.05 Berry weight change (%) (b) (b) (a) (ab) (a) (ab) A B C D E F Treatments Figure 35: Six different treatments applied to post-veraison Merlot and Concord berries Treatments: A=berry protruding from the water, pedicel immersed; B=pedicel protruding from the water, skin immersed; C=berry entirely immersed with only skin sealed; D= berry entirely immersed with only pedicel sealed; E= berry entirely immersed without sealing; F= berry entirely immersed and sealed. Treatments with the same letter are not significantly different at p < (Error bars represent standard error of the mean, 13 n 20)
72 58 As soon as the berries cracked their soluble solids dropped from 16 to 2 Brix for Concord and from ~22 to ~8 Brix for Merlot (Figure 36). Measuring soluble solids in the immersion water showed that the berries lost between 100 and 300 mg of sugar. So assuming for Concord, a planting distance of 2.7 m between the rows and 1.8 m within the row, 30 berries per cluster, 200 clusters per vine, and if each single berry lost 100 mg in soluble solids, up to ~ 1.2 tons per ha of soluble solids could be lost on the ground just before harvest due to rainfall or sprinkler irrigation Concord r = -0.80, p<0.001 Merlot r = -0.87, p<0.001 Final soluble solid (Brix) Sugar lost (mg) Figure 36: Correlation between the final soluble solids and sugar lost for Merlot and Concord berries immersed in distilled water.
73 59 The early post-veraison experiment, which consisted of immersing Concord berries in two different water sources, showed that berries took up water and increased their weight. However, there was no significant difference between water ph when the berries did not crack (Figure 37-A). When berries did crack, berries immersed in distilled water increased their weight more (p<0.05) than berries immersed in tap water (Figure 37-B). About 10 % of berries cracked and there was no significant difference between water ph. Moreover, no soluble solids were found in the water used for immersion when berries did not crack. Intact berries gained from 100 to 300 mg in weight which dropped the soluble solids concentration from a range of Brix before the immersion to 7-9 Brix after the immersion. Berry weight change (%) p = n.s tap distilled Water source A Berry weight change (%) p<0.05 tap distilled Water source B Figure 37: Concord berries immersed in distilled water gained more weight than in tap water. No significant difference between water ph when the berries did not crack (A). Significant difference in gained weight between water sources when the berries did crack (B). (Error bars represent standard error of the mean, n = 40 in Figure A and 1 n in Figure (B)). The immersion experiment later in the season did not show significant differences between water uptake and water ph or between early and late post-veraison berries when berries did not crack. When the berries did crack, the difference in water uptake became significant similar to the early post-veraison immersion experiment (Figure 38). However, the more mature berries were more likely (p<0.05) to crack than the early post
74 60 veraison berries. Also there was a significant difference between water ph. In fact, 54 % of Concord berries immersed in distilled water at ~18 Brix cracked and 59% of them cracked within 24 hours. On the other hand, 28% of berries cracked when immersed in tap water and 35% of them cracked within 24 hours (Table 3). Moreover, berries lost up to 10 mg of solutes regardless of water ph when the berries were intact. When the berries cracked, they lost between 100 and 300 mg of sugar. Table 3: Effect of different ph of water on cracking for Concord berries at ~18 Brix. Water source Total berries No. of cracked berries Cracked within 24 hours Weight change of intact berries ( % ) Distilled water (ph 5.93) Tap water (ph 7.91) Heat-girdling The heat girdling experiment in Merlot showed that berries started shriveling and changing color within 5 days following the girdling treatment, even though they were hard and green with ~5.5 Brix at the time of girdling (Figures 38, 39). Also no visible color change differences were observed between girdling the peduncle of the cluster or girdling the peduncle and lateral shoulder. The soluble solids concentration of hard green berries, which were tagged, moved from 5.5 Brix before the girdling to ~9 Brix 5 days later at the same time their skin color changed to red. Ten days after girdling they had moved to ~12 Brix and were visibly shrinking (Figure 38-B, 39-B). No significant differences were found in the soluble solids content between the two treatments (Figure 40). Although the average of soluble solids measurement for the girdled clusters was
.")
, but when clusters were girdled at the same time, berries shrank (Figure 38 and 39).")


75 61 higher (p<0.05) 5 days following the girdling than in the control. This difference disappeared when the soluble solids was measured 10 days after girdling (Figure 40). Also noted, when the vine was water-stressed during veraison, the berries changing color expanded (Figure 21 and 22), but when clusters were girdled at the same time, berries shrank (Figure 38 and 39). A B Figure 38: Merlot cluster. The heat-girdling done on the peduncle of the cluster and on the lateral shoulder indicate by the arrows. Figure A shows a girdled cluster at the early stage of ripening while Figure B shows the same cluster 5 days after girdling. A B Figure 39: Merlot cluster. The heat-girdling done only on the peduncle of the cluster indicated by the arrows. Figure A shows a cluster undergoing veraison while Figure B shows the same cluster 10 days after girdling.
76 Shoulder girdled Control p<0.001 Shoulder not girdled Soluble solid (Brix) Days after girdling Figure 40 Correlation between days after girdling and soluble solids for the girdled and control Merlot clusters. Girdling done on the peduncle and the lateral shoulder of the cluster (shoulder girdled) and only on the peduncle of the cluster (shoulder not girdled) were the treatments. Soluble solids concentration of the berries measured for the girdled and control clusters at the time of girdling, after 5 and 10 days. (Error bars represent standard error of the mean, 53 n 73). When Merlot and Concord clusters undergoing veraison were detached from the vine, a change of color from green to red-purple was observed (Figure 41 and 42). Also, the soluble solids concentration in the detached clusters was not significantly different from that of the attached clusters. Detached Concord and especially Merlot berries were visibly shriveling (Figure 41-B and Figure 42-B) so this result indicates the soluble solids concentration in the berries increased due to water loss from the berry. In addition, it was noted that some Concord clusters were still undergoing veraison on the vines while the detached clusters had totally turned color.

.")

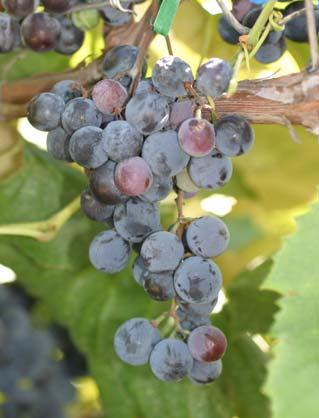
77 63 A B Figure 41: A cluster of Merlot detached from the vine during the changing of color. A Merlot cluster detached from vine (A). The same cluster 5 days later (B). A B Figure 42: A cluster of Concord detached from the vine during the changing of color. A Concord cluster detached from vine (A). The same cluster 5 days later (B).
.")

78 64 Other clusters that had been collected on the same day and immersed in distilled water for the same time period did not show any color change. In fact, the green berries on the cluster were still green after 5, 10 and 15 days of immersion for both Merlot and Concord (Figure 44). Soluble solids were not measured for this experiment but results from 3.4 showed that intact berries were increasing their weight from 100 to 300 mg while their soluble solids concentration was decreasing. A B Figure 43: A Concord cluster (A) and a Merlot cluster (B) collected from the field during veraison and immersed in distilled water.
Fruit Set, Growth and Development
 Fruit Set, Growth and Development Fruit set happens after pollination and fertilization, otherwise the flower or the fruit will drop. The flowering and fruit set efficiency could be measured by certain
Lecture 4. Factors affecting ripening can be physiological, physical, or biotic. Fruit maturity. Temperature.
 Lecture 4. Factors affecting ripening can be physiological, physical, or biotic. Physiological factors relate to fruit maturity or environmental factors, which affect the metabolism of fruit and banana.
IMPOSING WATER DEFICITS TO IMPROVE WINE QUALITY AND REDUCE COSTS
 IMPOSING WATER DEFICITS TO IMPROVE WINE QUALITY AND REDUCE COSTS Terry L. Prichard, Water Management Specialist University of California Davis 420 S. Wilson Way, Stockton, CA 95205 (209) 468-2085; fax
Vineyard Water Management
 Vineyard Water Management Pierre Helwi Texas A&M AgriLife Extension Service Grape Camp November 7, 2016 Lady Bird Johnson Park Pioneer Pavilion, Fredericksburg, TX Terroir Concept Climate Human factor
2 Grapevine Development and
 2 Grapevine Development and Basic Physiology Pat Bowen, Pacific Agri-Food Research Centre Summerland BC V0H 1Z0 The Goals of Viticulture The common goal of viticulture is to make a profit but strategies
Copyright Advanced Viticulture, Inc. Mark Greenspan, Ph.D., CPAg, CCA Advanced Viticulture, Inc.
 Mark Greenspan, Ph.D., CPAg, CCA Advanced Viticulture, Inc. www.advancedvit.com Irrigation Management Water Management Floor Management Weather Frost, Cooling, other. Strategy Physiology of vine water
Rhonda Smith UC Cooperative Extension, Sonoma County
 Berry Shrivel Research Update 2005 and 2006 investigations Rhonda Smith UC Cooperative Extension, Sonoma County Note: This update includes a summary of research conducted by Mark Krasow, Post Doctoral
Grapevine Cold Hardiness And Injury: Dynamics and Management
 Grapevine Cold Hardiness And Injury: Dynamics and Management Dr. Robert Wample California State University- Fresno Low Temperature Tolerance Vs Avoidance Tolerance Supercooling Avoidance (?)(Permanent
Crop Load Management of Young Vines
 Crop Load Management of Young Vines UC ANR Foothill Grape Day March 29, 2018 George Zhuang UC Cooperative Extension - Fresno County Thanks for Having Me Here! What is Crop Load? Crop load (Ravaz Index)
Do lower yields on the vine always make for better wine?
 Grape and wine quality Increasing quality Do lower yields on the vine always make for better wine? Nick Dokoozlian Viticulture, & Enology E&J Gallo ry Do lower yields on the vine always make for better
Colorado State University Viticulture and Enology. Grapevine Cold Hardiness
 Colorado State University Viticulture and Enology Grapevine Cold Hardiness Grapevine cold hardiness is dependent on multiple independent variables such as variety and clone, shoot vigor, previous season
Characterising weight loss in Vitis vinifera Shiraz berries at sub-optimal maturity Joanne Tilbrook
 Characterising weight loss in Vitis vinifera Shiraz berries at sub-optimal maturity Joanne Tilbrook Thesis presented for the degree of Doctor of Philosophy The University of Adelaide School of Agriculture,
18 PHOTOSYNTHESIS AND CARBOHYDRATE PARTITIONING IN CRANBERRY
 18 PHOTOSYNTHESIS AND CARBOHYDRATE PARTITIONING IN CRANBERRY Teryl R. Roper, Marianna Hagidimitriou and John Klueh Department of Horticulture University of Wisconsin-Madison Yield per area in cranberry
FALL TO WINTER CRANBERRY PLANT HARDINESS
 FALL TO WINTER CRANBERRY PLANT HARDINESS Beth Ann A. Workmaster and Jiwan P. Palta Department of Horticulture, University of Wisconsin-Madison Protection of cranberry plants from frost and freezing temperatures
The Pomology Post. Hull Rot Management on Almonds. by Brent Holtz, Ph.D., University of California Pomology Advisor
 University of California Cooperative Extension The Pomology Post Madera County Volume 54, JUNE 2007 Hull Rot Management on Almonds by Brent Holtz, Ph.D., University of California Pomology Advisor Many
A new approach to understand and control bitter pit in apple
 FINAL PROJECT REPORT WTFRC Project Number: AP-07-707 Project Title: PI: Organization: A new approach to understand and control bitter pit in apple Elizabeth Mitcham University of California Telephone/email:
Crop Development: Why things sometimes go wrong. Markus Keller
 Crop Development: Why things sometimes go wrong Markus Keller Grape berry: a job description Seed production Seed dispersal Color/aroma advertising Sugar ticket price from Coombe (AV, 2001) photo courtesy
GRAPES. Stop watering the end of August or first of September to harden off grape vines for winter. Keep foliage dry - don't overhead water.
 222 N Havana Spokane WA 99202 (509) 477-2181 e-mail: mastergardener@spokanecounty.org http://extension.wsu.edu/spokane/master-gardener-program/home-lawn-and-garden/ GRAPES C053 Not all grape cultivars
Lack of irrigation in 2002 reduced Riesling crop in Timothy E. Martinson Finger Lakes Grape Program
 Lack of irrigation in 2002 reduced Riesling crop in 2003 Timothy E. Martinson Finger Lakes Grape Program Lailiang Cheng, Alan Lakso, Thomas Henick-Kling and Terry Acree Depts. Horticulture Ithaca, Horticultural
10. THE ROLE OF PLANT GROWTH REGULATORS IN THE DEVELOPMENT, GROWTH AND MATURATION OF THE FRUIT
 The Division of Subtropical Agriculture. The Volcani Institute of Agricultural Research 1960-1969. Section B. Avocado. Pg 77-83. 10. THE ROLE OF PLANT GROWTH REGULATORS IN THE DEVELOPMENT, GROWTH AND MATURATION
Factors Affecting Sweet Cherry Fruit Pitting Resistance/Susceptibility. Yan Wang Postharvest Physiologist MCAREC, OSU
 Factors Affecting Sweet Cherry Fruit Pitting Resistance/Susceptibility Yan Wang Postharvest Physiologist MCAREC, OSU Sweet cherry pitting #1 postharvest disorder Pitting not only detract from the appearance
Module 6. Yield and Fruit Size. Presenter: Stephan Verreynne
 Presenter: Stephan Verreynne definition Yield Yield refers to the amount of fruit produced, and can be expressed in terms of: Tree yield kg per tree kg/tree Orchard yield tons per hectare t/ha Export yield
Measured effects of elevated temperature on vine phenology, yield, berry and wine attributes
 Measured effects of elevated temperature on vine phenology, yield, berry and wine attributes Victor Sadras, Martin Moran & Paul Petrie South Australian R&D Institute, Treasury Wine Estates Funded by Grape
Berry = Sugar Sink. Source: Sink Relationships in the Grapevine. Source: Sink Relations. Leaf = Photosynthesis = Source
 Source: Sink Relationships in the Grapevine S. Kaan Kurtural Department of Viticulture and Enology Source: Sink Relations Leaf = Photosynthesis = Source Berry = Sugar Sink 2 3/4/2018 1 Sink growing apex
Diffusion, Osmosis, and Water Potential Lab Report
 Diffusion, Osmosis, and Water Potential Lab Report Activity A: Diffusion Background: Diffusion is the movement of molecules from areas of higher concentration to areas of lower concentration. Two specific
j ÇxzÜtÑxá Ç Â These gapes are a whole different kind of animal Yahoo Group Home Page:
 j ÇxzÜtÑxá Ç axätwtr  These gapes are a whole different kind of animal Yahoo Group Home Page: http://groups.yahoo.com/group/nevadawinegrapegrowers Email: nevadawinegrapegrowers@yahoogroups.com Winegrape
SUGAR AND ACID METABOLISM IN CITRUS FRUIT. Karen E. Koch 1
 SUGAR AND ACID METABOLISM IN CITRUS FRUIT Karen E. Koch 1 Two important horticultural questions in this area are: 1. What affects sugar levels in citrus fruit? 2. What affects acid levels in citrus fruit?
Growing Grapes for White Wine Production: Do s and Don ts in the Vineyard
 Washington Winegrowers Convention Kennewick, WA, February 6-8, 2018 Growing Grapes for White Wine Production: Do s and Don ts in the Vineyard Markus Keller Aroma, flavor: Volatiles for white wine Norisoprenoids
Elderberry Ripeness and Determination of When to Harvest. Patrick Byers, Regional Horticulture Specialist,
 Elderberry Ripeness and Determination of When to Harvest Patrick Byers, Regional Horticulture Specialist, byerspl@missouri.edu 1. Ripeness is an elusive concept for many people a. Ripeness is often entirely
Grapevine Mineral Nutrition
 Grapevine Mineral Nutrition Peter Christensen Viticulture Specialist, Emeritus Department of Viticulture and Enology University of California, Davis UC Kearney Agricultural Center Parlier, CA Vineyard
THE EFFECT OF ETHYLENE UPON RIPENING AND RESPIRATORY RATE OF AVOCADO FRUIT
 California Avocado Society 1966 Yearbook 50: 128-133 THE EFFECT OF ETHYLENE UPON RIPENING AND RESPIRATORY RATE OF AVOCADO FRUIT Irving L. Eaks University of California, Riverside Avocado fruits will not
High School Gardening Curriculum Outline:
 High School Gardening Curriculum Outline: Part One: Preparing for a Garden Lesson 1: MyPlate and Plant Basics Lesson 2: Where, What, and When of Planning a Garden Part Two: Making Your Garden a Reality
Mechanical Canopy and Crop Load Management of Pinot Gris. Joseph P. Geller and S. Kaan Kurtural
 Mechanical Canopy and Crop Load Management of Pinot Gris Joseph P. Geller and S. Kaan Kurtural 3.6 million tons of wine grapes grown in CA More than 50% comes from the San Joaquin Valley More than 60%
THE EFFECT OF GIRDLING ON FRUIT QUALITY, PHENOLOGY AND MINERAL ANALYSIS OF THE AVOCADO TREE
 California Avocado Society 1971-72 Yearbook 55: 162-169 THE EFFECT OF GIRDLING ON FRUIT QUALITY, PHENOLOGY AND MINERAL ANALYSIS OF THE AVOCADO TREE E. Lahav Division of Subtropical Horticulture, The Volcani
Harvest times vary between growing regions and seasons. As an approximation, harvest times for the most common types are:
 Harvest Maturity Asian pear varieties (ie. Pyrus bretschneideri, Pyrus pyrifolia, Pyrus ussuariensis) more commonly known as nashi typically ripen on the tree. European pears (ie. Pyrus communis) such
THE GROWTH OF THE CHERRY OF ROBUSTA COFFEE
 THE GROWTH OF THE CHERRY OF ROBUSTA COFFEE L WEIGHT CHANGES CORRELATED WITH WATER AVAILABILITY DURING DEVELOPMENT BY J. DANCER Department of Agriculture, Kawanda Research Station, Kampala, Uganda {Received
Practical Aspects of Crop Load and Canopy Management
 Practical Aspects of Crop Load and Canopy Management Jim Wolpert Extension Viticulturist Department of Viticulture and Enology University of California, Davis Penn State Grape Day August 10, 2011 Presentation
The Implications of Climate Change for the Ontario Wine Industry
 The Implications of Climate Change for the Ontario Wine Industry Tony B. Shaw Department of Geography and Cool Climate Oenology and Viticulture Institute Brock University Climate Change Most scientists
Grape Berry Ripening: Environmental Drivers and Spoilers
 Grape Berry Ripening: Environmental Drivers and Spoilers Bogs et al. (2007) Markus Keller A winemaker s dream Loose clusters Small berries Uniform composition Nature s reality Large spatial and temporal
Berry sugar and water loading. Principles and a few observations
 Berry sugar and water loading Principles and a few observations Prof Alain Deloire deloire@sun.ac.za Department of Viticulture and Oenology Stellenbosch University UC-Davis, 10 May 2012 Berry sugar and
HANDS-ON SOLUTIONS TO OVERCOME FAST GRAPE RIPENING
 HANDS-ON SOLUTIONS TO OVERCOME FAST GRAPE RIPENING 1 Techniques based on modification of growing and ripening pattern Increase of vine yield (> bud load) Late shoot trimming Late irrigation (i.e. just
FRUIT GROWTH IN THE ORIENTAL PERSIMMON
 California Avocado Society 1960 Yearbook 44: 130-133 FRUIT GROWTH IN THE ORIENTAL PERSIMMON C. A. Schroeder Associated Professor of Subtropical Horticulture, University of California at Los Angeles. The
Fruit Ripening & Retail Handling Workshop. Why use cold storage? Ripe Strawberries After 7 days. Respiration and Temperature.
 Fruit Ripening & Retail Handling Workshop Cold Storage Disorders of Fruits and Vegetables Mikal E. Saltveit Mann Laboratory, Department of Plant Sciences University of California, Davis Why use cold storage?
ARIMNet2 Young Researchers Seminar
 ARIMNet2 Young Researchers Seminar How to better involve end-users throughout the research process to foster innovation-driven research for a sustainable Mediterranean agriculture at the farm and local
Wine Grape Trellis and Training Systems
 Wine Grape Trellis and Training Systems Thomas Todaro Viticulture Specialist Michigan State University Extension Sutton s Bay, Michigan 2018 Wine Grape Vineyard Establishment Conference Trellis systems
Peach and Nectarine Cork Spot: A Review of the 1998 Season
 Peach and Nectarine Cork Spot: A Review of the 1998 Season Kevin R. Day Tree Fruit Farm Advisor Tulare County University of California Cooperative Extension Along with many other problems, fruit corking
Unit B: Plant Anatomy. Lesson 4: Understanding Fruit Anatomy
 Unit B: Plant Anatomy Lesson 4: Understanding Fruit Anatomy 1 Terms achene aggregate fruits berry capsule caryopsis cytokinins dehiscent fruits disseminated drupe endocarp exocarp follicle fruit gibberellins
GALA SPLITTING WASHINGTON TREE FRUIT POSTHARVEST CONFERENCE. March 13 th & 14 th, 2001, Wenatchee, WA PROCEEDINGS, Gala Splitting page 1 of 6
 March 13 th & 14 th, 21, Wenatchee, WA GALA SPLITTING Preston K. Andrews Department of Horticulture & Landscape Architecture Washington State University Pullman, WA 99164-6414 59-335-363 (office) andrewsp@wsu.edu
Notes on acid adjustments:
 Notes on acid adjustments: In general, acidity levels in 2018 were lower than normal. Grape acidity is critical for the winemaking process, as well as the quality of the wine. There are 2 common ways to
Lesson 2 The Vineyard. From Soil to Harvest
 Lesson 2 The Vineyard From Soil to Harvest Objectives After reading this chapter, you should be able to display an understanding of how grapes are grown for wine production. describe the annual growing
MATURITY AND RIPENING PROCESS MATURITY
 MATURITY AND RIPENING PROCESS MATURITY It is the stage of fully development of tissue of fruit and vegetables only after which it will ripen normally. During the process of maturation the fruit receives
Fruit maturity and quality. Azra Alikadić Web Valley 2016, San Lorenzo Dorsino
 Fruit maturity and quality Azra Alikadić Web Valley 2016, San Lorenzo Dorsino Quality - Quality implies the degree of excellence of a product or its suitability for a particular use. - Which combines:
Development of smoke taint risk management tools for vignerons and land managers
 Development of smoke taint risk management tools for vignerons and land managers Glynn Ward, Kristen Brodison, Michael Airey, Art Diggle, Michael Saam-Renton, Andrew Taylor, Diana Fisher, Drew Haswell
Predicting Susceptibility of Gala Apples To Lenticel Breakdown Disorder: Guidelines for Using the Dye Uptake Test
 Predicting Susceptibility of Gala Apples To Lenticel Breakdown Disorder: Guidelines for Using the Dye Uptake Test Dr. Eric Curry and Dr. Eugene Kupferman Preliminary research indicates the following test
Psa and Italian Kiwifruit Orchards an observation by Callum Kay, 4 April 2011
 Psa and Italian Kiwifruit Orchards, 2011 The Psa-research programme in New Zealand draws on knowledge and experience gained from around the world particularly in Italy, where ZESPRI, Plant & Food Research
Diffusion & Osmosis Labs
 AP Biology Diffusion & Osmosis Labs INTRODUCTION The life of a cell is dependent on efficiently moving material into and out of the cell across the cell membrane. All cells need sugars and oxygen to make
Vinews Viticulture Information News, Week of 3 August 2015 Columbia, MO
 NO. 15 1 Vinews Viticulture Information News, Week of 3 August 2015 Columbia, MO Magnesium Deficiency With the onset of veraison nutrient deficiencies often become more apparent. Veraison is a phenological
Session 4: Managing seasonal production challenges. Relationships between harvest time and wine composition in Cabernet Sauvignon.
 Session 4: Managing seasonal production challenges Relationships between harvest time and wine composition in Cabernet Sauvignon Keren Bindon Cristian Varela, Helen Holt, Patricia Williamson, Leigh Francis,
Ripening and Conditioning Fruits for Fresh-cut
 Ripening and Conditioning Fruits for Fresh-cut Adel Kader UCDavis Management of Ripening of Intact and Fresh-cut Fruits 1. Stages of fruit development 2. Fruits that must ripen on the plant 3. Fruits that
INFLUENCE OF ENVIRONMENT - Wine evaporation from barrels By Richard M. Blazer, Enologist Sterling Vineyards Calistoga, CA
 INFLUENCE OF ENVIRONMENT - Wine evaporation from barrels By Richard M. Blazer, Enologist Sterling Vineyards Calistoga, CA Sterling Vineyards stores barrels of wine in both an air-conditioned, unheated,
AN ENOLOGY EXTENSION SERVICE QUARTERLY PUBLICATION
 The Effects of Pre-Fermentative Addition of Oenological Tannins on Wine Components and Sensorial Qualities of Red Wine FBZDF Wine. What Where Why How 2017 2. October, November, December What the authors
THE NATURAL SUSCEPTIBILITY AND ARTIFICIALLY INDUCED FRUIT CRACKING OF SOUR CHERRY CULTIVARS
 THE NATURAL SUSCEPTIBILITY AND ARTIFICIALLY INDUCED FRUIT CRACKING OF SOUR CHERRY CULTIVARS S. Budan Research Institute for Fruit Growing, Pitesti, Romania sergiu_budan@yahoo.com GENERALITIES It is agreed
Causes and Prevention of Thompson Seedless Berry Collapse
 Causes and Prevention of Thompson Seedless Berry Collapse Davinder Singh, Michael Treeby, Kristen, Pitt and Peter Clingeleffer 7 th International Table Grape Symposium, November 2014 CSIRO AGRICULTURE
Impact of Vineyard Practices on Grape and Wine Composition
 Impact of Vineyard Practices on Grape and Wine Composition James A. Kennedy UC Davis April 20, 2018 Davis, CA Outline Assumption: Managing wine composition in the vineyard is effective General thoughts
Using Less Water and Liking It
 Using Less Water and Liking It Vineyard Water Conservation Demo Project Mark Greenspan, Ph.D. Advanced Viticulture, LLC www.advancedvit.com Copyright Advanced Viticulture, LLC www.advancedvit.com Irrigation
is pleased to introduce the 2017 Scholarship Recipients
 is pleased to introduce the 2017 Scholarship Recipients Congratulations to Elizabeth Burzynski Katherine East Jaclyn Fiola Jerry Lin Sydney Morgan Maria Smith Jake Uretsky Elizabeth Burzynski Cornell University
Archival copy. For current information, see the OSU Extension Catalog: https://catalog.extension.oregonstate.edu/em9070
 EM 9070 June 2013 How to Measure Grapevine Leaf Area Patricia A. Skinkis and R. Paul Schreiner Figure 1. A leaf area template can be easily made using typical office supplies. The template, above, is being
Phenolics of WA State Wines*
 Phenolics of WA State Wines* Jim Harbertson Washington State University * And Grapes! Introduction Impacts of deficit irrigation on grape and wine phenolics Impacts of grape ripening on wine phenolic development
Melon Quality & Ripening
 Melon Quality & Ripening Marita Cantwell Dept. Plant Sciences, UC Davis micantwell@ucdavis.edu Fruit Ripening and Ethylene Management Workshop Postharvest Technology Center, UC Davis, March 17-18, 2015
GROWTH AND DEVELOPMENT OF THE AVOCADO FRUIT
 California Avocado Society 1958 Yearbook 42: 114-118 GROWTH AND DEVELOPMENT OF THE AVOCADO FRUIT C. A. Schroeder Associate Professor Subtropical Horticulture, University of California at Los Angeles. The
IS RIPENING AND POST HARVEST QUALITY OF HASS AVOCADOS AFFECTED BY FRUIT WATER STATUS?
 New Zealand and Australia Avocado Grower s Conference 05. 20-22 September 2005. Tauranga, New Zealand. Session 6. Postharvest quality, outturn. 9 pages. IS RIPENING AND POST HARVEST QUALITY OF HASS AVOCADOS
Joseph G. Alfieri 1, William P. Kustas 1, John H. Prueger 2, Lynn G. McKee 1, Feng Gao 1 Lawrence E. Hipps 3, Sebastian Los 3
 Joseph G. Alfieri 1, William P. Kustas 1, John H. Prueger 2, Lynn G. McKee 1, Feng Gao 1 Lawrence E. Hipps 3, Sebastian Los 3 1 USDA, ARS, Hydrology & Remote Sensing Lab, Beltsville MD 2 USDA,ARS, National
Post-Harvest-Multiple Choice Questions
 Post-Harvest-Multiple Choice Questions 1. Chilling injuries arising from the exposure of the products to a temperature a. above the normal physiological range b. below the normal physiological range c.under
Texas A&M AgriLife Extension Service Grapevine Cold Hardiness
 Texas A&M AgriLife Extension Service Grapevine Cold Hardiness Pierre Helwi and Justin Scheiner Cold hardiness Cold hardiness is the ability of dormant grapevine tissues to survive cold temperatures during
Effect of Thinning of Mandarin. on Yield and Fruit Quality. Mohammad Abd-El- Jaber Alabdallah. Supervisor. Prof. Dr.
 Effect of Thinning of Mandarin (Citrus reticulata Blanco. cv. Michal) on Yield and Fruit Quality By Mohammad Abd-El- Jaber Alabdallah Supervisor Prof. Dr. Mostafa Qrunfleh Submitted in Partial Fulfillment
IMPACT OF RAINFALL PRIOR TO HARVEST ON RIPE FRUIT QUALITY OF HASS AVOCADOS IN NEW ZEALAND
 Proceedings V World Avocado Congress (Actas V Congreso Mundial del Aguacate) 2003. pp. 629-634. IMPACT OF RAINFALL PRIOR TO HARVEST ON RIPE FRUIT QUALITY OF HASS AVOCADOS IN NEW ZEALAND H.A. Pak 1, J.
Relationship between Fruit Color (ripening) and Shelf Life of Cranberries: Physiological and Anatomical Explanation
 and Shelf Life of Cranberries: Physiological and Anatomical Explanation") Relationship between Fruit Color (ripening) and Shelf Life of Cranberries: Physiological and Anatomical Explanation 73 Mustafa Özgen, Beth Ann A. Workmaster and Jiwan P. Palta Department of Horticulture
Relationship between Fruit Color (ripening) and Shelf Life of Cranberries: Physiological and Anatomical Explanation 73 Mustafa Özgen, Beth Ann A. Workmaster and Jiwan P. Palta Department of Horticulture
INVESTIGATIONS INTO THE RELATIONSHIPS OF STRESS AND LEAF HEALTH OF THE GRAPEVINE (VITIS VINIFERA L.) ON GRAPE AND WINE QUALITIES
 ON GRAPE AND WINE QUALITIES") INVESTIGATIONS INTO THE RELATIONSHIPS OF STRESS AND LEAF HEALTH OF THE GRAPEVINE (VITIS VINIFERA L.) ON GRAPE AND WINE QUALITIES by Reuben Wells BAgrSc (Hons) Submitted in fulfilment of the requirements
INVESTIGATIONS INTO THE RELATIONSHIPS OF STRESS AND LEAF HEALTH OF THE GRAPEVINE (VITIS VINIFERA L.) ON GRAPE AND WINE QUALITIES by Reuben Wells BAgrSc (Hons) Submitted in fulfilment of the requirements
Optimising harvest date through use of an integrated grape compositional and sensory model
 Optimising harvest date through use of an integrated grape compositional and sensory model Alain DELOIRE, Katja ŠUKLJE, Guillaume ANTALICK, Campbell MEEKS, John W. BLACKMAN & Leigh M. SCHMIDTKE National
2012 Estimated Acres Producers Estimated Production Units Estimated Farm Value Farm Crawfish 182,167 1,251 90,973,725 Lbs.
 www.lsuagcenter.com 2012 Estimated Acres Producers Estimated Production Units Estimated Farm Value Farm Crawfish 182,167 1,251 90,973,725 Lbs. $152,835,858 Crawfish Biology Life Cycles evolved in nature,
Big Data and the Productivity Challenge for Wine Grapes. Nick Dokoozlian Agricultural Outlook Forum February
 Big Data and the Productivity Challenge for Wine Grapes Nick Dokoozlian Agricultural Outlook Forum February 2016 0 Big Data and the Productivity Challenge for Wine Grapes Outline Current production challenges
Factors to consider when ripening avocado
 Factors to consider when ripening avocado Mary Lu Arpaia Univ. of CA Riverside, CA mlarpaia@ucanr.edu Why Ripen Avocados? Untreated, fruit ripening may range from a few days to even weeks within a carton
Some Uses of Plant Growth Regulators in Modern Apple Production Systems
 Some Uses of Plant Growth Regulators in Modern Apple Production Systems Steven McArtney Southeast Apple Specialist Department of Horticultural Science, NSCU Some Uses of PGR s Crop load management Control
2015 BUD SURVIVAL SURVEY IN NIAGARA AREA VINEYARDS
 BUD SURVIVAL SURVEY IN NIAGARA AREA VINEYARDS Prepared for: The Grape Growers of Ontario KCMS - Applied Research and Consulting 1215 Maple St. P.O Box 13 Fenwick, Ontario L0S 1C0 Telephone: (905) 892-7050
EFFECT OF TOMATO GENETIC VARIATION ON LYE PEELING EFFICACY TOMATO SOLUTIONS JIM AND ADAM DICK SUMMARY
 EFFECT OF TOMATO GENETIC VARIATION ON LYE PEELING EFFICACY TOMATO SOLUTIONS JIM AND ADAM DICK 2013 SUMMARY Several breeding lines and hybrids were peeled in an 18% lye solution using an exposure time of
Extraction of Acrylamide from Coffee Using ISOLUTE. SLE+ Prior to LC-MS/MS Analysis
 Application Note AN796 Extraction of Acrylamide from Coffee using ISOLUTE SLE+ Page 1 Extraction of Acrylamide from Coffee Using ISOLUTE SLE+ Prior to LC-MS/MS Analysis This application note describes
Deficit Irrigation Scheduling for Quality Winegrapes
 Deficit Irrigation Scheduling for Quality Winegrapes Terry Prichard, Water Management Specialist Dept. LAWR, Hydrology UC Davis Improving Fruit Quality Improving Fruit Quality Crop Crop Load Management
In 2015, low temperatures occurred
 FARM ADVISORS Pinot Leaf Curl Rhonda J. Smith and Larry J. Bettiga UC Cooperative Extension Viticulture Farm Advisors, Sonoma and Monterey Counties; and Douglas O. Adams, Department of Viticulture and
Lab 2: Phase transitions & ice cream
 Lab 2: Phase transitions & ice cream Lab sections on Tuesday Sept 18 Friday Sept 21 In this lab you will observe how changing two parameters, pressure and salt concentration, affects the two phase transitions
Acta Chimica and Pharmaceutica Indica
 Acta Chimica and Pharmaceutica Indica Research Vol 7 Issue 2 Oxygen Removal from the White Wine in Winery VladimirBales *, DominikFurman, Pavel Timar and Milos Sevcik 2 Faculty of Chemical and Food Technology,
Influence of GA 3 Sizing Sprays on Ruby Seedless
 University of California Tulare County Cooperative Extension Influence of GA 3 Sizing Sprays on Ruby Seedless Pub. TB8-97 Introduction: The majority of Ruby Seedless table grapes grown and marketed over
Varieties and Rootstocks in Texas
 Varieties and Rootstocks in Texas Pierre Helwi, Ph.D Extension Viticulture Specialist Texas A&M AgriLife Extension Service Grape Camp November 05, 2017 Characteristics of Major Types of Grapes Type Fruit
What Went Wrong with Export Avocado Physiology during the 1996 Season?
 South African Avocado Growers Association Yearbook 1997. 20:88-92 What Went Wrong with Export Avocado Physiology during the 1996 Season? F J Kruger V E Claassens Institute for Tropical and Subtropical
(36) PROHEXADIONE-CALCIUM AFFECTS SHOOT GROWTH AND YIELD OF LEMON, ORANGE AND AVOCADO DIFFERENTLY
 PROHEXADIONE-CALCIUM AFFECTS SHOOT GROWTH AND YIELD OF LEMON, ORANGE AND AVOCADO DIFFERENTLY") (36) PROHEXADIONE-CALCIUM AFFECTS SHOOT GROWTH AND YIELD OF LEMON, ORANGE AND AVOCADO DIFFERENTLY Lauren C. Garner, Yusheng Zheng, Toan Khuong and Carol J. Lovatt 1 ABSTRACT Lemon (Citrus limon L.) and
(36) PROHEXADIONE-CALCIUM AFFECTS SHOOT GROWTH AND YIELD OF LEMON, ORANGE AND AVOCADO DIFFERENTLY Lauren C. Garner, Yusheng Zheng, Toan Khuong and Carol J. Lovatt 1 ABSTRACT Lemon (Citrus limon L.) and
Physiology, Orchard Establishment, Cultivars, Training/Pruning. Lenny Wells UGA Extension Horticulture
 Pecan Production 101: Physiology, Orchard Establishment, Cultivars, Training/Pruning Lenny Wells UGA Extension Horticulture Chilling/Heating As more chill hrs accumulate, less heat units required to stimulate
Tomato Product Cutting Tips
 Tomato Product Cutting Tips Tomato Product Cutting Tips Know your customer and the application of the products being shown. Confirm the products will work for the application. Listen to the customer regarding
Hybrid Seeds Production
 Hybrid Seeds Production S.S.Janen Project Manager Seeds Pacific Feeds Limited National Youth Training Centre Ministry of Youth and Sports, Fiji 11 th March 2015 What is hybrid Vegetable seeds? The offspring
Using Growing Degree Hours Accumulated Thirty Days after Bloom to Help Growers Predict Difficult Fruit Sizing Years
 Using Growing Degree Hours Accumulated Thirty Days after Bloom to Help Growers Predict Difficult Fruit Sizing Years G. Lopez 1 and T. DeJong 2 1 Àrea de Tecnologia del Reg, IRTA, Lleida, Spain 2 Department
NE-1020 Cold Hardy Wine Grape Cultivar Trial
 Iowa State Research Farm Progress Reports 2014 NE-1020 Cold Hardy Wine Grape Cultivar Trial Paul A. Domoto Iowa State University, domoto@iastate.edu Gail R. Nonnecke Iowa State University, nonnecke@iastate.edu
Figure #1 Within the ovary, the ovules may have different arrangements within chambers called locules.
 Name: Date: Per: Botany 322: Fruit Dissection What Am I Eating? Objectives: To become familiar with the ways that flower and fruit structures vary from species to species To learn the floral origin of