Sri Lanka s Edible Oils Exports. September 2016
|
|
|
- Dayna Campbell
- 5 years ago
- Views:
Transcription
1 Sri Lanka s Edible Oils Exports September 2016
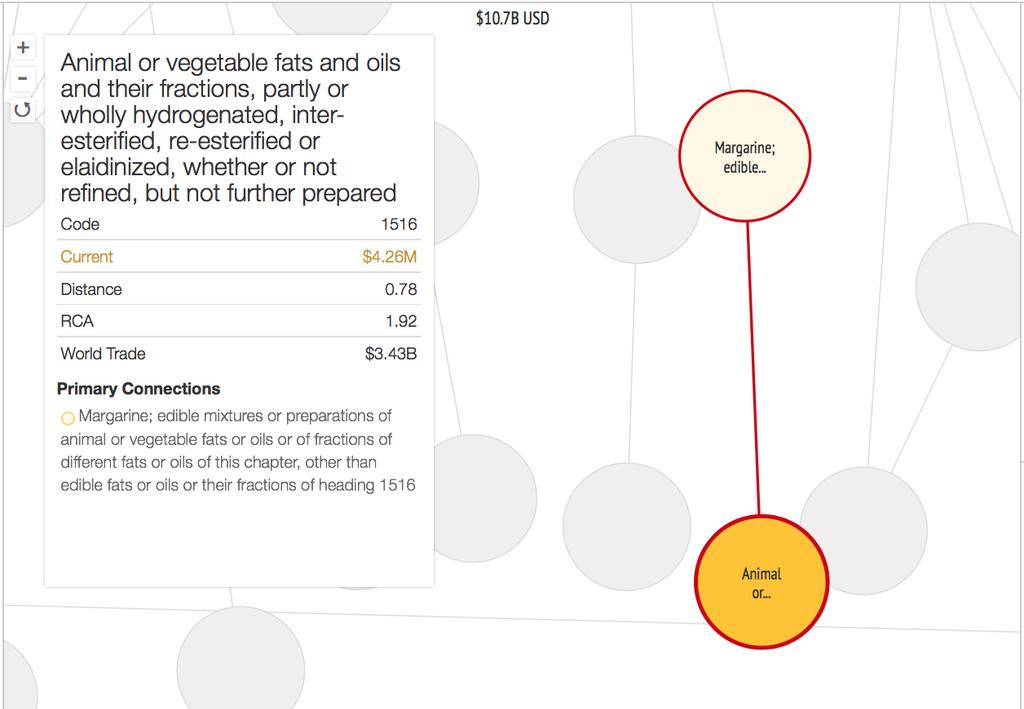
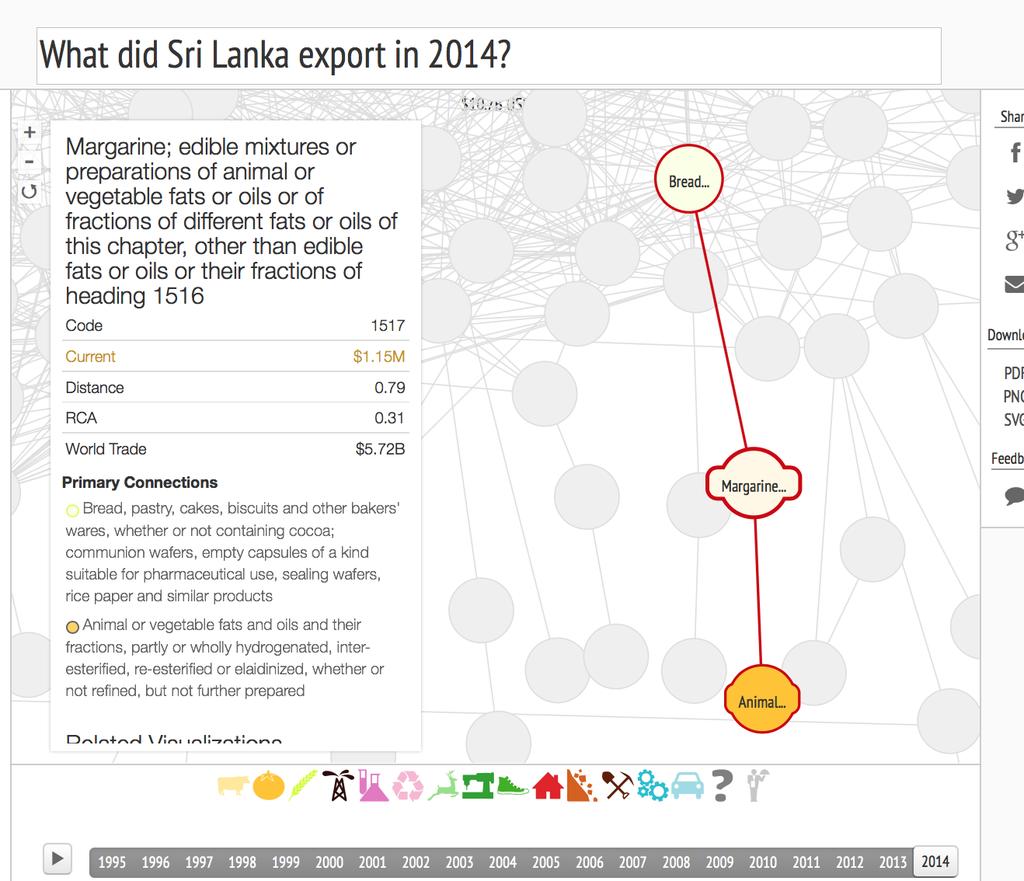
2 Key products in Sri Lanka s edible oils sector Animal and vegetable fats and oils exports accounted for only.51% of Sri Lanka s $11.1 billion total export value in Crude coconut oil dominates this product category, representing 85.9% of the sector s $56.7 million export value. The breakdown below accounts for 99.3% of Sri Lanka s total animal and vegetable fats and oils exports. Breakdown of Exports: Animal and Vegetable Fats and Oils and their Cleavage Products (2014) Key Products (HS Code Rev. 92) Export Value ($US) % of Sri Lanka s Total Exports % of Sri Lanka s Animal and Vegetable Fats and Oils Exports RCA* Annual Growth Rate (5 yr.) Coconut oil (1513) 48.7M 0.439% 85.9% % Hydrogenated oils (1516) 2.26M 0.038% 7.5% % Stearic acid (1519) 1.29M 0.012% 2.3% % Margarine (1517) 1.15M 0.010% 2.0% % Palm oil (1511) 472k 0.004% 0.8% % Fish oil (1504) 465k 0.004% 0.8% % * Revealed Comparative Advantage (RCA) is the share of the product in Sri Lanka s exports divided by the share of the product in the average country s exports. Source: Data by UN COMTRADE 2014
, Sri Lanka has a high revealed comparative advantage in this product and its exports have grown rapidly from $4.7 million in 2009 to $48.")
3 Coconut oil exporters between 1995 and 2014 Coconut oil exporters in 2014 Although Sri Lanka s exports of coconut oil account for just 0.83% of global coconut oil exports ($5.9 billion), Sri Lanka has a high revealed comparative advantage in this product and its exports have grown rapidly from $4.7 million in 2009 to $48.7 million in 2014 a factor of more than 10 in just 5 years. Indonesia, Malaysia and the Philippines have consistently dominated the industry from 1995 to the present. Source: Data by UN COMTRADE 2014; Visualizations by The Atlas of Economic Complexity (

4 Coconut oil importers between 1995 and 2014 Where did Sri Lanka export coconut oil to between 1995 and 2014? 25% of Sri Lanka s coconut oil was exported to the United States in 2014, but this accounted for only 1% of the total coconut oil that the US imported. The US imported 48% of its coconut oil from the Philippines and 28% from Indonesia. Source: Data by UN COMTRADE 2014; Visualizations by The Atlas of Economic Complexity (

5 Hydrogenated oils exporters in 2014 Where did Sri Lanka export hydrogenated oils to in 2014? Sri Lanka s exports of hydrogenated oils have varied by an extraordinary amount from year to year, driven by changes in demand from India. Over the last decade, exports were as high as $111 million in 2007, as low as $144 thousand in 2009, and totaled $4.3 million in 2014, which represented 0.05% of the global export value of hydrogenated oils. In 2014, Sri Lanka exported 87% of its hydrogenated oils to Pakistan and Kenya, and had a weak presence in the European market, which consistently accounts for 30-50% of all hydrogenated oils imports. Source: Data by UN COMTRADE 2014; Visualization by The Atlas of Economic Complexity (


6 Where did Sri Lanka export stearic acid to in 2014? Global importers of stearic acid in 2014 Sri Lanka s share of global stearic acid exports is very low at just 0.015%. Indonesia and Malaysia together account for more than half of all stearic acid exports. Source: Data by UN COMTRADE 2014; Visualization by The Atlas of Economic Complexity (


7 Margarine exporters in 2014 Global exporters of margarine between 1995 and 2014 Sri Lanka s margarine exports dropped from $20.6 million in 2007 to $1.15 million in 2014, with this drop matching a major drop in demand from India. World exports grew from $3.45 billion to $5.72 billion over the same period, despite a sharp decline from Source: Data by UN COMTRADE 2014; Visualization by The Atlas of Economic Complexity (
. Indonesia and Malaysia are far and away the top producers, with 48% and 36% of world exports, respectively, in 2014.")
8 Where did Sri Lanka export palm oil to in 2014? Global importers of palm oil in 2014 The palm oil industry is the largest globally within the edible oil sector, with total exports of $35.2 billion (33% of the sector total). Indonesia and Malaysia are far and away the top producers, with 48% and 36% of world exports, respectively, in According to an OECD Review of Agricultural Policies for Indonesia in 2012, the ownership structure of palm oil producers in that country was as follows: 55% large-scale private companies (Indonesian, Malaysian, or located in Singapore under Chinese capital control); 35% smallholders; 10% state-owned companies. The top 10 companies in Indonesia owned 67% of Indonesia s palm oil plantations in Sources: OECD Review of Agricultural Policies: Indonesia 2012 & UN COMTRADE 2014; Visualization by The Atlas of Economic Complexity (


9 Where did Sri Lanka export fish oil in 2014? Global importers of fish oil in 2014 Sri Lanka s fish oil exports are limited exclusively to Japan, even though Japan represents only 3% of global fish oil imports. Fish oil exports dropped from $985 thousand in 2008 to $196 thousand in 2011, and rebounded to reach $465 thousand in Sources: OECD Review of Agricultural Policies: Indonesia 2012 & UN COMTRADE 2014; Visualization by The Atlas of Economic Complexity (

10 Edible Oils in Sri Lanka s Product Space
11 Primary connections in the Product Space
12 Primary connections in the Product Space
13 Primary connections in the Product Space
14 Sri Lanka s efficiency frontier, by product
15 Position of edible oils in Sri Lanka s efficiency frontier, by community Note: Vegetable products isolated to locate edible oils Sri Lanka has a revealed comparative advantage of 1.05 in the sector, but the complexity score of is fairly low. However, the opportunity gain measure of 3 is the highest within the vegetable products category, indicating that the edible oils sector could be a stepping stone that would open some new doors to more complex products.
16 Conclusions At $56.7 million in 2014, edible oils make up a small share of Sri Lanka s overall exports and a small share of global exports of edible oils. However, Sri Lanka maintains a revealed comparative advantage in this sector, albeit just barely (RCA = 1.05). Coconut oil is Sri Lanka s main export in the sector and the one with the highest revealed comparative advantage. Sri Lanka s growth in coconut oil exports has been very strong and it has much room to grow, including in the US market. Hydrogenated oil, stearic acid, margarine and palm oil exports all fluctuate dramatically with demand from India. Sri Lanka maintained a revealed comparative advantage in its exports of hydrogenated oils in 2014 without exporting to India. Sri Lanka exports fish oil only to Japan although there is a much wider global market for the product. Sri Lanka does not have a foothold in other major edible oils (sunflower, soya-bean, canola, olive and linseed). Edible oils are non-complex products that are not not well-connected to other products, but among vegetable products the sector is a relatively good stepping stone for continued diversification for Sri Lanka. Indonesia, Malaysia and the Philippines tend to dominate exports of the edible oils in which Sri Lanka has a foothold. Large-scale multi-national companies appear to play a role in their productivity.
17 Appendix Efficiency frontiers, with product highlighted Coconut oil, crude
18 Hydrogenated animal and vegetable fats, oils
19 Stearic acid
20 Margarine, not liquid
21 Palm oil, crude
22 Fish oil
FCC Ag Economics. Trade Ranking Report: Agriculture
 FCC Ag Economics Trade Ranking Report: Agriculture Published November 7, 2017 1 Introduction There s good reason to be optimistic about the future of Canada s agri-food. Demand for agricultural commodities
OPPORTUNITIES FOR SRI LANKAN VIRGIN COCONUT OIL IN TURKEY
 OPPORTUNITIES FOR SRI LANKAN VIRGIN COCONUT OIL IN TURKEY Prepared by: Embassy of Sri Lanka, Turkey June 2017 CONTENTS 1. SUMMARY... 3 2. MARKET DESCRIPTION... 3 3. POSITION OF SRI LANKAN VIRGIN COCONUT
SINGAPORE. Summary Table: Import of Fresh fruits and Vegetables in Fresh fruit and Vegetables Market Value $000 Qty in Tons
 SINGAPORE A. MARKET FOR FRESH FRUIT AND VEGETABLES 1. Market Trend and Opportunities Summary Table: Import of Fresh fruits and Vegetables in Fresh fruit and Vegetables Market Products/ Other Info. Product
World Scenario: Oilseed Production
 World Scenario: Oilseed Production Commodity 13/14 (Million Ton) 16/17 (Million Ton) Soybean 280.3 352 Sunflower seed 43.6 48.22 Rapeseed 69.6 63.13 Cotton Seed 44.4 39.52 Groundnuts 28.4 30.32 Palm-kernal
TRADE AS A % OF GDP VS GDP PER CAPITA (LANDLOCKED DEVELOPING COUNTRIES) MOLDOVA UZBEKISTAN
 MOLDOVA UZBEKISTAN") An Outlook of Rwanda s EXPORT PERFORMANCE Export growth and competitiveness are key to Rwanda s ability to raise FDI levels and foster economic growth. Rwanda s export trade has risen tremendously between
An Outlook of Rwanda s EXPORT PERFORMANCE Export growth and competitiveness are key to Rwanda s ability to raise FDI levels and foster economic growth. Rwanda s export trade has risen tremendously between
JAPAN COUNTRY FACT SHEET: General information. Unemployment rate: 4,3% BBP: 4237,8 billion BBP per capita: Official language(s):
:") General information Capital: Surface area: Official language(s): Currency: Key macroeconomic indicators Tokyo 377.835 km² Japanese Japanese Yen Population: 126,5 million Unemployment rate: 4,3% BBP: 4237,8
General information Capital: Surface area: Official language(s): Currency: Key macroeconomic indicators Tokyo 377.835 km² Japanese Japanese Yen Population: 126,5 million Unemployment rate: 4,3% BBP: 4237,8
Thailand Packaging Machinery Market. Jorge Izquierdo VP Market Development PMMI
 Thailand Packaging Machinery Market Jorge Izquierdo VP Market Development PMMI jizquierdo@pmmi.org www.pmmi.org/global www.pmmi.org/research Today General Economic and Political Highlights Current Packaging
The Potential Role of Latin America Food Trade in Asia Pacific PECC Agricultural and Food Policy Forum Taipei
 The Potential Role of Latin America Food Trade in Asia Pacific 2011 PECC Agricultural and Food Policy Forum Taipei Universidad EAFIT, Colombia December 2, 2011 1 CONTENTS 1. Introduction 2. Food Trade
Millet [100820] Figure 0-1 India s export of Millet to World. Please refer to Table 1 of Annexure.
![Millet [100820] Figure 0-1 India s export of Millet to World. Please refer to Table 1 of Annexure.](/thumbs/86/93964521.jpg "Millet [100820] Figure 0-1 India s export of Millet to World. Please refer to Table 1 of Annexure.") Millet [100820] Figure 0-1 India s export of Millet to World. Please refer to Table 1 of Annexure. It can be seen from the above graph that India s export of millet was steadily increasing from year 2003
Millet [100820] Figure 0-1 India s export of Millet to World. Please refer to Table 1 of Annexure. It can be seen from the above graph that India s export of millet was steadily increasing from year 2003
Economic Role of Maize in Thailand
 Economic Role of Maize in Thailand Hnin Ei Win Center for Applied Economics Research Thailand INTRODUCTION Maize is an important agricultural product in Thailand which is being used for both food and feed
POC 2018 PALM & LAURIC OILS PRICE OUTLOOK CONFERENCE & EXHIBITION. Emerging Trends In The Edible Oil Sector A View From Pakistan..
 POC 2018 PALM & LAURIC OILS PRICE OUTLOOK CONFERENCE & EXHIBITION 5-7 March, 2018 Hotel Shangri-La, Kuala Lumpur Emerging Trends In The Edible Oil Sector A View From Pakistan.. By Abdul Rasheed Janmohammed
Tea Statistics Report 2015
 Tea Statistics Report 215 Introduction This report presents the scope and scale of the UTZ tea program in 215. Throughout this report tea also includes rooibos unless otherwise specified. The statistics
Senal Weerasooriya and Jeevika Weerahewa University of Peradeniya
 Senal Weerasooriya and Jeevika Weerahewa University of Peradeniya Research workshop on Trade Diversification in the Context of Global Challenges 2728 October 2010 Vientiane, Lao PDR 1 Why do countries
Background. Objectives and Scope. Research Method. Trade Flows. Competitiveness. Conclusion
 PERFORMANCE OF AGRICULTURAL TRADE AMONG DEVELOPING COUNTRIES FACULTY OF ECONOMICS AND MANAGEMENT BOGOR AGRICULTURAL UNIVERSITY 2011 OUTLINE Background Objectives and Scope Research Method Trade Flows Competitiveness
Monitoring EU Agri-Food Trade: Development until March 2018
 Monitoring EU Agri-Food Trade: Development until March 2018 14.000 EU28: Export to Extra-EU of Agri-Food Products 13.000 12.000 11.000 10.000 2018 2017 2015 2016 2014 9.000 8.000 7.000 6.000 Jan Feb Mar
Fresh Deciduous Fruit (Apples, Grapes, & Pears): World Markets and Trade
: World Markets and Trade") Million MT United States Department of Agriculture Foreign Agricultural Service December 21 Fresh Deciduous Fruit (Apples, Grapes, & Pears): World Markets and Trade 21/11 Forecast: World Apple Trade Declines;
Million MT United States Department of Agriculture Foreign Agricultural Service December 21 Fresh Deciduous Fruit (Apples, Grapes, & Pears): World Markets and Trade 21/11 Forecast: World Apple Trade Declines;
Statistics & Agric.Economics Deptt., Tocklai Experimental Station, Tea Research Association, Jorhat , Assam. ABSTRACT
 Two and a Bud 59(2):152-156, 2012 RESEARCH PAPER Global tea production and export trend with special reference to India Prasanna Kumar Bordoloi Statistics & Agric.Economics Deptt., Tocklai Experimental
Import Summary Report - Packaging Asia
 Import Summary Report Packaging Asia October 06 Contents. Global Imports. Imports in ASIA. Focus Packaging Categories.. 7. 8. 0. Established Export Destinations. Pakistan. India. Malaysia. Philippines.
Plastic Machinery Produced by IAR Team Focus Technology Co., Ltd.
 2010-2013 Plastic Machinery 2014.02 Produced by IAR Team Focus Technology Co., Ltd. Contents 1. 2010-2012 Chinese Plastic Machinery Export Trend Analysis...3 1.1. 2010-2012 Chinese Plastic Machinery Export
ECONOMICS OF COCONUT PRODUCTS AN ANALYTICAL STUDY. Coconut is an important tree crop with diverse end-uses, grown in many states of India.
 ECONOMICS OF COCONUT PRODUCTS AN ANALYTICAL STUDY Introduction Coconut is an important tree crop with diverse end-uses, grown in many states of India. Coconut palm is the benevolent provider of the basic
UK Leather Industry in 2017
 UK Leather Industry in 2017 The UK leather industry is comprised of specialist, high end producers of automotive, upholstery, shoe upper and sole, gloving, chamois, equestrian leather and wet blue leather.
Monitoring EU Agri-Food Trade: Development until October 2016
 Monitoring EU Agri-Food Trade: Development until October 2016 October 2016 EU agri-food exports stabilise at high level The monthly value of EU agri-food exports in October 2016 stabilised at EUR 11.4
Taiwan Fishery Trade: Import Demand Market for Shrimps. Bith-Hong Ling
 International Symposium Agribusiness Management towards Strengthening Agricultural Development and Trade III : Agribusiness Research on Marketing and Trade Taiwan Fishery Trade: Import Demand Market for
Commodity Profile of Edible Oil for July
 Commodity Profile of Edible Oil for July - 2018 As on 23.07.2018 Contents 1. Edible Oil estimates for India (marketing year- November 2017- October 2018)... 2 2. Production Trend of Domestic Oilseeds...
EMBARGO TO ON FRIDAY 16 SEPTEMBER. Scotch Whisky Association. Exports of Scotch Whisky; Year to end of June 2016 (2016 H1)
") EMBARGO TO 00.01 ON FRIDAY 16 SEPTEMBER Scotch Whisky Association Exports of Scotch Whisky; Year to end of June 2016 (2016 H1) VOLUME UP 3.1% to 531 MILLION bottles VALUE DOWN SLIGHTLY BY 1.0% TO 1.70
EMBARGO TO 00.01 ON FRIDAY 16 SEPTEMBER Scotch Whisky Association Exports of Scotch Whisky; Year to end of June 2016 (2016 H1) VOLUME UP 3.1% to 531 MILLION bottles VALUE DOWN SLIGHTLY BY 1.0% TO 1.70
WORLD OILSEEDS AND PRODUCTS
 WORLD OILSEEDS AND PRODUCTS 218 / World Oilseeds and Products: FAPRI 2004 Agricultural Outlook World Soybean and Soybean Products The world soybean price climbed strongly in 2003/04, driven by robust demand
KUWAIT. Similarly there is a decreasing trend for other fresh fruits products like grapes and lychee. India shared 37.6% of import market in Kuwait.
 KUWAIT A. MARKET FOR FRESH FRUITS AND FRESH VEGETABLES 1. Market Trend and Opportunities: Fresh Fruits The market for fresh fruits in Kuwait has a downward trend. Bananas import volume decreased by 34%
Monitoring EU Agri-Food Trade: Development until September 2018
 Monitoring EU Agri-Food Trade: Development until September 2018 September 2018: Slowdown in EU export performance; imports from Brazil and US still on the rise The monthly value of EU agri-food trade in
Agri-Food Exports. Alberta to 2014 Economics and Competitiveness. Highlights on Alberta Agri-Food Exports in Tables:
 Agri-Food Exports Alberta 2005 to 2014 Economics and Competitiveness Highlights on Alberta Agri-Food Exports in 2014 Tables: Alberta Agri-Food Exports, 2005-2014: - Top 5 Export Products and Markets -
Report on Italian Desserts in China
 Report on Italian Desserts in China In recent three years, the total imports value of Chinese desserts products continued to grow steadily. In 2016 the total value of desserts products (including coffee,
ICC September 2018 Original: English. Emerging coffee markets: South and East Asia
 ICC 122-6 7 September 2018 Original: English E International Coffee Council 122 st Session 17 21 September 2018 London, UK Emerging coffee markets: South and East Asia Background 1. In accordance with
Tuna Trade. Fatima Ferdouse
 Tuna Trade Fatima Ferdouse HIGHLIGHTS East Asia is the world s largest processing and exporting region for canned tuna. Producing countries in the region also depend on imported raw materials The fluctuating
Paper Packaging Practice June Copyright 2015 RISI, Inc. All rights reserved.
 Global Containerboard Outlook Ken Waghorne, VP Paper Packaging Practice June 2015 1 Today s Agenda Regional Containerboard Markets Asia Europe Western Eastern North America Latin America Rest of World
Global sparkling wine market trends. June Peter Bailey. Manager - Market Insights. Wine Australia
 Global sparkling wine market trends June 2018 Peter Bailey Manager - Market Insights Wine Australia Presentation Outline 1. Who are the biggest sparkling wine producers? 2. Where are the biggest markets?
COMCEC STRATEGY. For Building an Interdependent Islamic World. COMCEC Trade OUTLOOK th Meeting of the Trade Working Group
 COMCEC Trade OUTLOOK 2017 11th Meeting of the Trade Working Group March 7-8, 2018 Ankara, Turkey OUTLINE Trade Between the OIC Countries and the World Developments in Intra-OIC Trade Trade Facilitation
GLOBOIL INTERNATIONAL Emerging Trends In The Edible Oil Sector A View From Pakistan.. Abdul Rasheed Janmohammed
 GLOBOIL INTERNATIONAL 2018 27-29 April, 2018 Hotel JW Marriott Marquis, Dubai, U.A.E. Emerging Trends In The Edible Oil Sector A View From Pakistan.. By Abdul Rasheed Janmohammed Chief Executive Chief
COMCEC STRATEGY. For Building an Interdependent Islamic World. COMCEC Trade OUTLOOK 2013
 COMCEC Trade OUTLOOK 2013 Trade Working Group Meeting October 31st, 2013 Ankara, Turkey OUTLINE Recent Trends and Patterns in Global Trade Developments in Total OIC Trade with the World Developments in
Shellfish Trends in China
 MARKET ACCESS SECRETARIAT Global Analysis Report Sector Trend Analysis Shellfish Trends in China February 2018 Executive summary China is Canada's second-largest agri-food and seafood trading partner in
Consistently higher production and more exportable supplies from Thailand are major factors in the decline in world rice prices in 2014 and continued
 Rice Consistently higher production and more exportable supplies from Thailand are major factors in the decline in world rice prices in 2014 and continued lower levels over the next ten years. Part of
Monitoring EU Agri-Food Trade: Development until June 2017
 Monitoring EU Agri-Food Trade: Development until June 2017 June 2017: Agri-food exports again above previous years level After a rebound in May, the monthly value of EU agri-food exports went down to EUR
PHILIPPINES. 1. Market Trends: Import Items Change in % Major Sources in %
 PHILIPPINES A. MARKET OF FRESH FRUITS & VEGETABLES 1. Market Trends: Import Items 2003 2007 Change in % Major Sources in % Value Quantity Value Quantity Value Quantity USD '000 Tons USD '000 Tons Grapes
UTZ Tea Statistics Report 2017
 UTZ Tea Statistics Report 2017 More than 107,000 tea farmers and workers benefit from the UTZ program UTZ certified tea is produced in 13 countries In 2017, more than 4.6 billion cups of UTZ certified
Global Dissolving Pulp Market Outlook China
 Global Dissolving Pulp Market Outlook China RISI Asian Conference May 2017 Rod Young Chief Economic Advisor China Is The Driving Force Behind Dissolving Pulp Demand Viscose fibers lead the development
World Trends and Technology in Sunflower Production, Crushing and Consumption
 World Trends and Technology in Sunflower Production, Crushing and Consumption Robert Green, Cargill Australia Focus World production trends Implications on oilseed processing Production viability Sunflowers
Monitoring EU Agri-Food Trade: Development until August 2018
 Monitoring EU Agri-Food Trade: Development until August 2018 August 2018: Export performance remains stable; imports from US continue to increase The value of EU agri-food trade in the month of August
Monitoring EU Agri-Food Trade: Development until August 2017
 Monitoring EU Agri-Food Trade: Development until August 2017 August 2017: Agri-food exports continue strong The monthly value of EU agri-food exports rose slightly to EUR 11.5 billion in August 2017, a
TRADE ASPECT OF PLANTATION SECTOR OF INDIA
 NRPPD Discussion Paper 8 TRADE ASPECT OF PLANTATION SECTOR OF INDIA B.H. Nagoor October 2010 TRADE ASPECT OF PLANTATION SECTOR OF INDIA B.H. Nagoor October 2010 4 ABSTRACT The central objective of the
Comparison across international sources of the value of exports for top 25 countries, 1992 (US$ billion )
") Table 1 Comparison across international sources of the value of exports for top 25 countries, 1992 (US$ billion ) FAO WB IFS UN WB b.o.p. United States 448.2 448.0 448.2 444.2 440.4 Germany 429.7 422.0
Table 1 Comparison across international sources of the value of exports for top 25 countries, 1992 (US$ billion ) FAO WB IFS UN WB b.o.p. United States 448.2 448.0 448.2 444.2 440.4 Germany 429.7 422.0
Monitoring EU Agri-Food Trade: Development until March 2017
 Monitoring EU Agri-Food Trade: Development until March 2017 March 2017: record value in monthly agri-food exports at EUR 12.7 billion The monthly value of EU agri-food exports in March 2017 reached a value
Table grape. Horticulture trade intelligence. Quarter 1: January to March 2017
 Horticulture trade intelligence A custom report compiled for Hort Innovation by Euromonitor International Table grape Quarter 1: January to March 217 Horticulture trade intelligence: Table grape: 217:
Update on ASEAN Steel Industry Development Scenario
 2017 ASEAN Iron and Steel Sustainability Forum Update on ASEAN Steel Industry Development Scenario Presented by: TAN AH YONG Secretary General South East Asia Iron and Steel Institute (SEAISI) CONTENTS:
ECONOMICS. Sri Lanka s Export Problem. Not Concentration, but Composition
 ECONOMICS Sri Lanka s Export Problem Not Concentration, but Composition August 2017 Sri Lanka s Export Problem Not Concentration, but Composition August 2017 The Economics Research Team of Verité Research
Commodity Profile of Edible Oil for May
 Commodity Profile of Edible Oil for May - 2017 As on 17.05.2017 Contents 1. Edible Oil estimates for India ( marketing year- November 2016- October 2017)... 2 2. Production Trend of Domestic Oilseeds...
Healthy Ageing in Asia
 Healthy Ageing in Asia Megatrends and Opportunities in Packaged Foods Seow Chin Juen Research Analyst (Food and Nutrition) Euromonitor Singapore ABOUT EUROMONITOR INTERNATIONAL 2 Network and Coverage ABOUT
Fresh Deciduous Fruit (Apples, Grapes, & Pears): World Markets and Trade
: World Markets and Trade") Fresh Deciduous Fruit (Apples, Grapes, & Pears): World Markets and Trade June 21 APPLES Record Production but Trade Estimate Revised Downward The world production estimate for 29/1 is virtually unchanged
Fresh Deciduous Fruit (Apples, Grapes, & Pears): World Markets and Trade June 21 APPLES Record Production but Trade Estimate Revised Downward The world production estimate for 29/1 is virtually unchanged
MONTHLY REPORTS EDIBLE OIL JUNE - JULY 2016
 MONTHLY REPORTS EDIBLE OIL Monthly Prices Movement Edible Oil prices remained volatile in June month tracking movement in Indian Rupee and uncertain fundamentals. Soy Oil prices remained mixed with more
Economics 452 International Trade Theory and Policy Fall 2012
 Name FIRST EXAM Economics 452 International Trade Theory and Policy Fall 2012 WORLD TRADE 1. The United States trades (exports plus imports) the third most with a. China b. Canada c. France d. Mexico e.
Major California Agricultural Exports to the Top Destinations in 1999* (1) Canada Rank Approximate Export Value (millions)
 Canada Rank Approximate Export Value (millions)") (1) Canada Rank Approximate Export Value (millions) Table Grapes 1 119 Tomatoes, Processed 2 115 Lettuce 3 102 Wine 4 84 Strawberries 5 78 Carrots 6 50 Tomatoes, Fresh 7 43 Peaches/Nectarines 8 42 Broccoli
(1) Canada Rank Approximate Export Value (millions) Table Grapes 1 119 Tomatoes, Processed 2 115 Lettuce 3 102 Wine 4 84 Strawberries 5 78 Carrots 6 50 Tomatoes, Fresh 7 43 Peaches/Nectarines 8 42 Broccoli
Food Additive Produced by IAR Team Focus Technology Co., Ltd
 Food Additive 2012.03 Produced by IAR Team Focus Technology Co., Ltd Contents 1. 2009-2011 Chinese Citric Acid Export Data Analysis... 3 2009-2011 Major Importers of Chinese Citric Acid...4 2. 2009-2011
Monitoring EU Agri-Food Trade: Development until October 2018
 Monitoring EU Agri-Food Trade: Development until October 2018 October 2018: best EU agri-food export performance ever The monthly value of EU agri-food trade in October 2018 was second biggest ever recorded
Beer sales pick up in 2010 after the slowdown in 2009
 Global Picture Beer sales pick up in 2010 after the slowdown in 2009 Global beer volume growth picked up again in 2010, after flat sales in 2009, with volumes growing by over 1%. It appears that recovery
Monitoring EU Agri-Food Trade: Development until April 2017
 Monitoring EU Agri-Food Trade: Development until April 2017 April 2017: Agri-food exports back to average values The monthly value of EU agri-food exports in April 2017 reached a value of EUR 10.6 billion,
Fresh Deciduous Fruit (Apples, Grapes, & Pears): World Markets and Trade
: World Markets and Trade") United States Department of Agriculture Foreign Agricultural Service Fresh Deciduous Fruit (Apples, Grapes, & Pears): World Markets and Trade 9 1, MT Deciduous Fruit on Seasonal Cycles 6 Northern Hemisphere
United States Department of Agriculture Foreign Agricultural Service Fresh Deciduous Fruit (Apples, Grapes, & Pears): World Markets and Trade 9 1, MT Deciduous Fruit on Seasonal Cycles 6 Northern Hemisphere
THE EXPORT PERFORMANCE OF INDONESIAN DRIED CASSAVA IN THE WORLD MARKET
 Agricultural Socio-Economics Journal P -ISSN: 1412-1425 Volume 17, Number 3 (2017): 134-139 E-ISSN: 2252-6757 THE EXPORT PERFORMANCE OF INDONESIAN DRIED CASSAVA IN THE WORLD MARKET Nico Adi Putra Hutabarat
Table 1.1 Number of ConAgra products by country in Euromonitor International categories
 CONAGRA Products included There were 1,254 identified products manufactured by ConAgra in five countries. There was sufficient nutrient information for 1,036 products to generate a Health Star Rating and
Global Sugar Substitute Market: An Analysis
 Global Sugar Substitute Market: An Analysis ----------------------------------------- 2013 Executive Summary The sugar substitute market mainly consists of high fructose syrup (HFCS), high intensity sweetener
Monitoring EU Agri-Food Trade: Development until December 2016
 Monitoring EU Agri-Food Trade: Development until December 2016 EU agri-food exports at highest annual level ever: EUR 130.7 billion The annual value of EU agri-food exports in 2016 reached a new record
Monitoring EU Agri-Food Trade: Development until November 2016
 Monitoring EU Agri-Food Trade: Development until November 2016 November 2016 EU agri-food exports again at record level The monthly value of EU agri-food exports in November 2016 reached a new record level
2013Q2 Daily Chemical Produced by IAR Team Focus Technology Co., Ltd.
 2013Q2 Daily Chemical 2013.10 Produced by IAR Team Focus Technology Co., Ltd. Contents 1. China Daily Chemical Industry Export Trend Analysis... 3 1.1. China Soap Export Trend Analysis from Jan. to June
Global Trade in Mangoes
 Global Trade in Mangoes October 2014 Jim Lang Managing Director TradeData International Pty Ltd jim.lang@tradedata.net www.tradedata.net COUNTRIES WITH MONTH IMPORT STATISTICS 1. The global market is just
World Dairy Situation. IDF SC DPE, Paris April 11, 2013
 World Dairy Situation IDF SC DPE, Paris April 11, Current dairy situation Dairy production progressed in 2012 in supplying regions but is now stabilizing, even declining in some countries Export demand
International Table Grape Symposium November 2014 Australian Table Grapes Jeff Scott Chief Executive Officer
 International Table Grape Symposium November 2014 Australian Table Grapes Jeff Scott Chief Executive Officer Australian Table Grape Industry - Snapshot There are approximately 900 table grape growers throughout
DEVELOPMENTS IN TURKISH STEEL INDUSTRY AND OUTLOOK
 DEVELOPMENTS IN TURKISH STEEL INDUSTRY AND OUTLOOK Dr. Veysel YAYAN Secretary General Turkish Iron and Steel Producers Association OECD Steel Commitee Meeting 17-18 May 2007, İstanbul 1 Crude steel production
Fresh Fruit & Vegetable Export / Import Statistics 2016/17
 Fresh Fruit & Vegetable Export / Import Statistics 2016/17 A statistics resource for fresh produce exporters and importers prepared for the Australian Horticultural Exporters Association by Fresh Intelligence
MARKETING TRENDS FOR COCONUT PRODUCTS IN SRI LANKA
 ,'6 b l\o L( cl/\r!y ~?\ 1IJ7'X ~.fsool- CR Cc~~ ~t).> MARKETING TRENDS FOR COCONUT PRODUCTS IN SRI LANKA 1950-1981 By Sunil Chandra ~~nnapperuma B.A. (Ceylon) A dissertation submitted in partial fulfilment
Prices for all coffee groups increased in May
 Prices for all coffee groups increased in May In May 2018, the ICO composite indicator increased by 0.7% to an average of 113.34 US cents/lb, following three months of declines. Prices for all coffee groups
Monitoring EU Agri-Food Trade: Development until January 2018
 Monitoring EU Agri-Food Trade: Development until January 2018 January 2018: good start of a year for EU agri-food exports The value of EU agri-food exports in January 2018 kept its very high level, now
DEVELOPMENTS IN STEEL SCRAP IN 2009
 DEVELOPMENTS IN STEEL SCRAP IN 2009 AMERICAN SCRAP COALITION WASHINGTON, DC DEVELOPMENTS IN STEEL SCRAP 2009 The year 2009 demonstrated that the United States continues to experience a crisis with respect
INDUSTRY CAPABILITY REPORT COCONUT & COCONUT BASED PRODUCTS
 INDUSTRY CAPABILITY REPORT COCONUT & COCONUT BASED PRODUCTS Prepared by: Export Development Board (EDB), Sri Lanka March, 2012 CONTENTS 1. INTRODUCTION... 3 2. TYPE OF PLAYERS... 3 3. KEY PRODUCTS AND
In 2017, the value of Scotch Whisky exports reached a record 4.37 billion.
 SCOTCH WHISKY 2017 EXPORT ANALYSIS #WHISKYFORTHEWORLD www.scotch-whisky.org.uk " In 2017, the value of Scotch Whisky exports reached a record 4.37 billion. To put this into perspective, more Scotch Whisky
Quarterly AGRI-FOOD TRADE HIGHLIGHTS
 Quarterly AGRI-FOOD TRADE HIGHLIGHTS First Quarter 1998 Agriculture and Agri-Food Canada Agriculture et Agroalimentaire Canada QUARTERLY AGRI-FOOD TRADE HIGHLIGHTS FIRST QUARTER 1998 NO. 98:1 JULY 1998
Asia Pacific Tuna Trade. Shirlene Maria Anthonysamy INFOFISH Pacific Tuna Forum 2017 Papua New Guinea
 Asia Pacific Tuna Trade Shirlene Maria Anthonysamy INFOFISH Pacific Tuna Forum 217 Papua New Guinea JAPANESE MARKET Demand for sashimi tuna remains highly seasonal strengthening during the spring festivals
MARCOS S. JANK. JAPAN BRAZIL Bilateral Dynamics and Partnership in the Agri-Food Sector
 MARCOS S. JANK JAPAN BRAZIL Bilateral Dynamics and Partnership in the Agri-Food Sector JAPAN-BRAZIL BUSINESS COUNCIL Tokyo, Japan 24 th July 2018 Japan and Brazil Competitive Advantages in the Agri-Food
Bearing Produced by IAR Team Focus Technology Co., Ltd.
 Bearing 2013.06 Produced by IAR Team Focus Technology Co., Ltd. Contents 1. Bearing Industry Exports of 2012... 3 1.1. China Bearing Industry Export Classification Tables of 2012... 3 1.2. China Ball or
Italy. Italian Wine Overview 2017
 THIS REPORT CONTAINS ASSESSMENTS OF COMMODITY AND TRADE ISSUES MADE BY USDA STAFF AND NOT NECESSARIY STATEMENTS OF OFFICIA U.S. GOVERNMENT POICY Voluntary - Public Date: //7 GAIN Report Number: IT7 Italy
Market Brief for Asia Fruit Logistica. Hong Kong & Macau, Makret Dynamic Markets for U.S. Exports
 Market Brief for Asia Fruit Logistica Hong Kong & Macau, Makret Dynamic Markets for U.S. Exports September 5, 2017 1 USDA Foreign Agricultural Service (FAS) - ATO Hong Kong - FAS offices are staffed by
Monitoring EU Agri-Food Trade: Development until December 2015
 Monitoring EU Agri-Food Trade: Development until December 2015 December 2015 - EU agri-food exports again higher than in previous years EU agri-food exports in December 2015 achieved a value of EUR 11.2
Monthly Economic Letter
 Monthly Economic Letter Cotton Market Fundamentals & Price Outlook RECENT PRICE MOVEMENT NY futures experienced volatility recently, with the net effect being a slight increase in prices. The A Index also
2012 EXPORT HIGHLIGHTS BRITISH COLUMBIA AGRIFOODS
 2012 EXPORT HIGHLIGHTS BRITISH COLUMBIA AGRIFOODS REVISED FEBRUARY 2014 Table of Contents British Columbia Agrifoods Export Highlights - 2012... 1 Total BC Agrifoods Exports... 1 Top BC Agrifoods Exports
Outlook for Global Recovered Paper Markets. Global OCC Market. Global ONP Market RISI. Hannah Zhao, Economist, Recovered Paper October 2012
 Outlook for Global Recovered Paper Markets Hannah Zhao, Economist, Recovered Paper October 212 Global OCC Market $28 $24 $2 $16 US$ per Tonne % 6 55 5 $12 $8 US West Export (FAS) N. German Export (FAS)
FONTERRA AT A GLANCE
 FONTERRA AT A GLANCE AN INTRODUCTION TO FONTERRA We re united by a fundamental belief in the power of dairy to make a difference. WE RE A GLOBAL DAIRY NUTRITION COMPANY A CO-OPERATIVE OWNED BY 10,500
Competitive Trade Analysis Italy
 MARKET ACCESS SECRETARIAT Global Analysis Report Competitive Trade Analysis Italy July 2015 REPORT CONTENT SUMMARY This report looks to highlight the major sectors in Italy, and attempts to identify the
More information from: https://www.wiseguyreports.com/reports/ global-online-food-delivery-and-takeaway-marketanalysis-by-order-type
 Report Information More information from: https://www.wiseguyreports.com/reports/1079744-global-online-food-delivery-and-takeaway-marketanalysis-by-order-type Global Online Food Delivery and Takeaway Market
PRODUCTION AND EXPORT PERFORMANCE OF CARDAMOM IN INDIA
 PRODUCTION AND EXPORT PERFORMANCE OF CARDAMOM IN INDIA Dr.R.Govindasamy Guest Lecturer, Department of Economics, Bharathiar University, Coimbatore Abstract Cardamom is generally produced in the tropical
A review of South African agricultural exports
 23 October 2015 A review of South African agricultural Tinashe Kapuya, Head: International Trade and Investment 1. INTRODUCTION This article reviews South Africa s agricultural by reflecting on the top
Foodservice Market Prospects
 Foodservice Market Prospects Australia & South East Asia Food SA Summit 5th June 2012 BIS Foodservice 3 4 Three Available Food & Beverage Markets The Three Food & Non-Alcoholic Beverage Markets Market
STATE OF THE VITIVINICULTURE WORLD MARKET
 STATE OF THE VITIVINICULTURE WORLD MARKET April 2018 1 Table of contents 1. VITICULTURAL PRODUCTION POTENTIAL 3 2. WINE PRODUCTION 5 3. WINE CONSUMPTION 7 4. INTERNATIONAL TRADE 9 Abbreviations: kha: thousands
North America Grains Outlook
 banchero costa North America Grains Outlook (covering wheat and coarse grains) September 2018 bancosta blue studies volume DRY 2018/#12 banchero costa research www.bancosta.com ; research@bancosta.com
J / A V 9 / N O.
 July/Aug 2003 Volume 9 / NO. 7 See Story on Page 4 Implications for California Walnut Producers By Mechel S. Paggi, Ph.D. Global production of walnuts is forecast to be up 3 percent in 2002/03 reaching
Production and Export of Value Added tea in India and its Global Competitiveness
 Economic Affairs, Vol. 62, No. 4, pp. 705-710, December 2017 DOI: 10.5958/0976-4666.2017.00086.9 2017 New Delhi Publishers. All rights reserved Production and Export of Value Added tea in India and its