Russian wheat markets in a crazy 2017/18, and prospects for 2018/19
|
|
|
- Francine Johnson
- 5 years ago
- Views:
Transcription
1 Dmitri Rylko General director IKAR LLC Russian wheat markets in a crazy 2017/18, and prospects for 2018/19 TUSAF, March 10, 2018

2 IKAR It s not only about Russia and not only about wheat RUK and Russia on the world grain markets


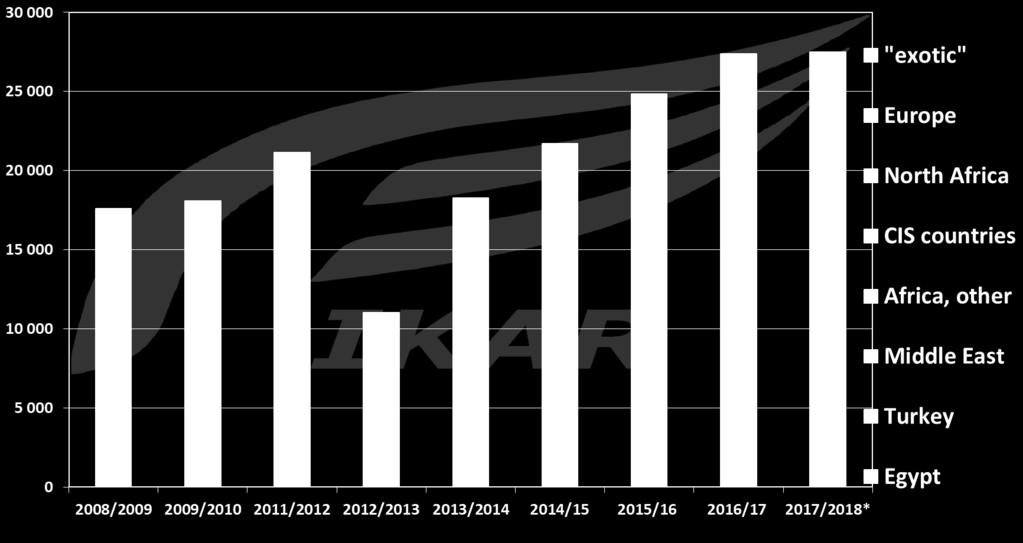
3 IKAR Russian volume/share on the world wheat market In 2017/18 Russia has finally arrived to the place of biggest world wheat exporter


4 FOB, CPT an exchange rate correlafon Due to growing export volumes and farm consolidaqon, South Russian farmers have become type of price makers on the world wheat market

5 Wheat yields per key exporfng nafons, tons/ha
6 Our (IKAR) virtual struggle with the USDA on the Russian wheat export figures Jun Jul Aug Sep Oct Nov Dec Jan Feb Mar USDA 29,0 30,5 31,5 32,5 32,5 33,0 33,5 35,0 36,0 37,5 IKAR 29,0 31,0 32,0 33,0 34,0 34,0 36,0 36,5 37,5 38,1
7 Monthly Russian all grains export dynamics, TMT Monthly Russian wheat export dynamics, TMT
8 27,6 38,1 38,1
9 What happens with Russia? Why grain/wheat producqon and export records? How sustainable is the story? Weather DevaluaQon FerQlizers/agrichemicals Government Farm management Infrastructure


10 Wheat outputs per key producqon regions, MMT 10
11 What happens with Russia? Why grain/wheat producqon and export records? How sustainable is the story? Weather DevaluaQon FerQlizers/agrichemicals Government Farm management Infrastructure


12 Exchange rate remains supporfve Ruble and brent in dollars 57 36

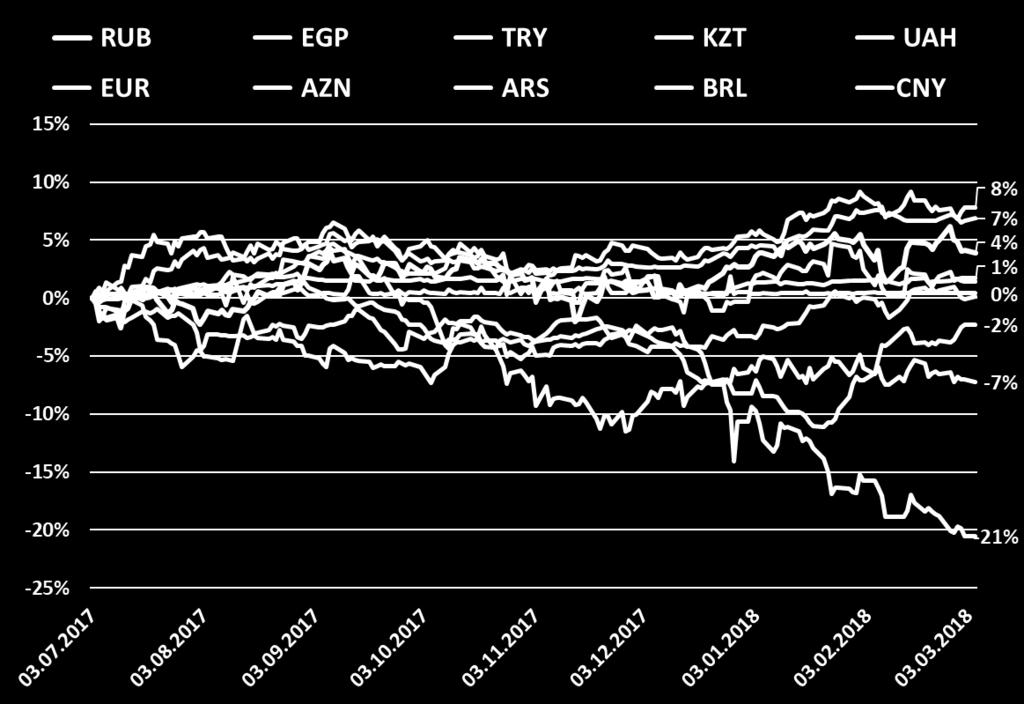
13 Ruble appreciated, but Euro even more

14 Winter/spring kill of winter crops ExcepQonally mild winters? Three out of four most recent seasons are featured with excepqonally mild winters and very modest winter kill

15 Russian pre- export railway transportaqon is record strong
16 Russian grains exports per main channels, July- February, TMT

17 The insights on the Azov- Don grains export shipments Anchor transshipping Anchor transshipping in Black Sea has become a vital for keeping alive Azov Sea terminals 2017/18: Open Sea transshipping has been under an administraqve pressure of port authoriqes

18 Azov Black Sea anchor transshipping
19 Black and Azov Sea export terminal 12.5% wheat export terminal Close to historical record high Spread (right axis) NOVO AZOV In the middle of the season Azov Sea CPT/FOB values were pressurized by informal prohibiqon of OPL transshipments and big demand on coal transportaqon
20 Russian wheat export desfnafons Jul- Feb
21 Russian wheat export desfnafons Jul- Feb Georgia 526, Tanzania 485, Oman 284, Korea 274, Mozambique 258, Venezuela 223, Ghana 195, Uganda 194, Philippines 174, etc.

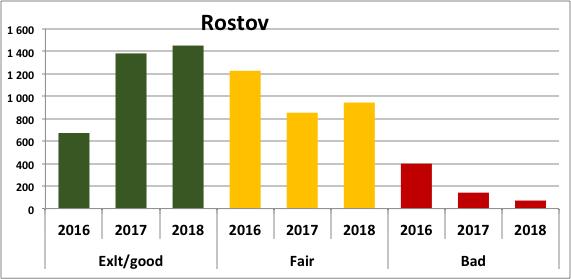
22 The dynamics of the Russian wheat quality, TMT (~13%+) ~11-12.% ~10.5%< Source: IKAR based on the Center of grain quality assessment

23 Wheat exports per classes, ТМТ «condiqonal milling» or feed 23


24 Wheat exports per classes, % 24

25 Russia export desfnafons


26 Russia export desfnafons
27 IKAR Russian wheat export to Turkey per classes: dramaqc shiqs of 2017/18 ~13%+ ~11-13% ~<10.5% F U L L S E A S O N S JUL- JAN 2017/18
28 IKAR Russian wheat export to Turkey per classes: dramaqc shiqs of 2017/18 ~13%+ ~11-13% ~<10.5% JUL- JAN 2017/18 WHY IS THE SHIFT? South Russian wheat quality structure: probably too wide protein price spreads South Russian W and shiq to import of hi- pro from BalQcs countries Probable shiq of wheat flour demand to lower priced flours
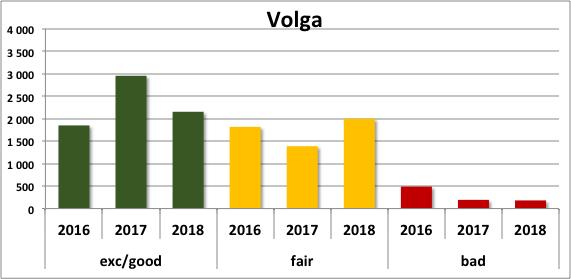
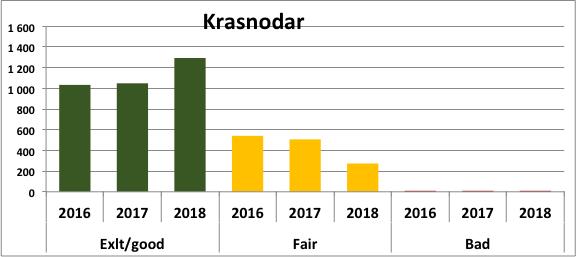
29 Wheat product markets

30 Wheat flour export, TMT Russia Ukraine Unlike Russia, Ukraine is strongly moving forward with its wheat flour exports


31 The break- downs of countries wheat flour exports (2017/18 Jul.- Jan.) Ukraine TMT Kazakhstan TMT Russia TMT Kazakhstan ships to its Central Asia belli Ukraine is most diversified with a focus on China and Africa Russia is focused on Fmr. USSR and made a break- through into China


32 Wheat bran export, TMT Russia Ukraine Turkey is a key buyer of wheat for both Russia and Ukraine
33 Flour and bran export dynamics, TMT

34 Could Russia export more bran? The esfmated share of export in wheat bran output, TMT
35 New season contours

36 State of winter wheat: so far, so good


37

38
39 All grains producqon balances, TMT 2018/19 All grains, MMT 2015/ / / / / /19 Beginning stocks 15,0 13,2 19,0 26,2 26,2 26,2 Gross output 104,8 120,7 135,1 110,0 120,0 130,0 Import 1,0 1,0 1,0 1,0 1,0 1,0 Resources, total 120,8 134,8 155,1 137,2 147,2 157,2 DomesQc disappearance 72,0 79,0 80,3 77,0 78,0 81,0 To export 35,6 36,9 49,6 42,5 45,0 50,0 Total disappearance 107,6 115,9 128,9 119,5 123,0 131,0 Carry- overs 13,2 19,0 26,2 17,7 24,2 26,2 39
40 Wheat balance, 2018/19, MMT Wheat, MMT 2015/ / / / / /19 Beginning stocks 7,9 8,4 13,0 18,2 18,2 18,2 Gross output 61,8 73,3 85,8 68,0 73,0 82,0 Import 0,7 0,7 0,7 0,7 0,7 0,7 Resources 70,4 82,4 99,5 86,9 91,9 100,9 DomesQc disappearance 36,9 42,0 43,8 43,8 43,8 43,8 To export 25,2 27,4 37,5 29,0 32,0 38,0 Total disappearance 62,1 69,4 81,3 72,8 75,8 81,8 Carry- overs 8,4 13,0 18,2 14,1 16,1 19,1 In 2018/19 Russia has chances to repeat its 2017/18 export story 40
41 Thank you! Teseccurler! Skype: Dimash457 Russian Weekly Grain and Middle of Week Reports Russian Weekly Oilseeds and products Russian grains/oilseeds export data
World Dairy Situation. IDF SC DPE, Paris April 11, 2013
 World Dairy Situation IDF SC DPE, Paris April 11, Current dairy situation Dairy production progressed in 2012 in supplying regions but is now stabilizing, even declining in some countries Export demand
Coffee market ends 2017/18 in surplus
 Coffee market ends 217/18 in surplus World coffee production in coffee year 217/18 is estimated 5.7% higher at 164.81 million bags as output of Arabica increased by 2.2% to 11.82, and Robusta grew 11.7%
Record exports in coffee year 2017/18
 Record exports in coffee year 2017/18 Total coffee exports increased each year since 2010/11 with a new record reached in 2017/18 at 121.86 million bags, 2% higher than 2016/17. In the twelve months ending
Coffee market continues downward trend
 Coffee market continues downward trend Since August 2017, the ICO composite indicator price has declined in each month except January 2018. The composite indicator decreased by 1.1% in March 2018 to an
July marks another month of continuous low prices
 July marks another month of continuous low prices In July 2018, the ICO composite indicator price decreased by 2.9% to an average of 107.20 US cents/lb, which is the lowest monthly average for July since
Role of RussiaandCIS on the world sugar market
 IKAR Dmitry Rylko General director Role of RussiaandCIS on the world sugar market Growing self-sufficiency and/or growing efficiency of the world s biggest sugar import market Brazil, October, 009 IKAR
2017 U.S. DISTILLERS GRAINS EXPORTS
 217 U.S. DISTILLERS GRAINS EXPORTS 14, Annual U.S. Distillers Grains Exports 12, 12,695 1, 8, 6, 4, 2, 2,358 4,532 5,651 9,5 7,676 7,421 9,67 11,284 11,314 11,77 U.S. exports of distillers grains (DG)
Coffee prices rose slightly in January 2019
 Coffee prices rose slightly in January 2019 In January 2019, the ICO composite indicator rose by 0.9% to 101.56 US cents/lb as prices for all group indicators increased. After starting at a low of 99.16
Prices for all coffee groups increased in May
 Prices for all coffee groups increased in May In May 2018, the ICO composite indicator increased by 0.7% to an average of 113.34 US cents/lb, following three months of declines. Prices for all coffee groups
WEEKLY OILSEED REPORT 27 JUNE 2018
 WEEKLY OILSEED REPORT 27 JUNE 218 Unigrain (Pty) Ltd Tel. No. : +27 11 692 44 Fax. No. : +27 11 412 1183 INTERNATIONAL MARKET Table 1: CME Soybean prices and weekly change (cents/bushel) Currently 2/6/218
Overview of the Manganese Industry
 39th Annual Conference Istanbul, Turkey 2013 Overview of the Manganese Industry International Manganese Institute Alberto Saavedra Market Research Manager June, 2013 Introduction Global Production Supply,
Growing divergence between Arabica and Robusta exports
 Growing divergence between Arabica and Robusta exports In April 218, the ICO composite indicator decreased by.4% to an average of 112.56, with the daily price ranging between 11.49 and 114.73. Prices for
THE GLOBAL PULSE MARKETS: recent trends and outlook
 THE GLOBAL PULSE MARKETS: recent trends and outlook CICILS/IPTIC 2004 CONVENTION 10-12 12 June 2004 Beijing, China Boubaker BENBELHASSEN Commodities and Trade Division United Nations Food and Agriculture
World coffee consumption increases but prices still low
 World coffee consumption increases but prices still low The coffee market stabilised slightly in February, but prices remain at very low levels. A lack of news regarding fundamentals with expectations
Coffee market settles lower amidst strong global exports
 Coffee market settles lower amidst strong global exports The ICO composite indicator price declined by 1.2% in February 2018 to an average of 114.19 US cents/lb. Indicator prices for all three Arabica
Seasonal trends in hectares planted, sales volumes on markets and market prices. Pieter van Zyl, Potatoes South Africa
 Seasonal trends in hectares planted, sales volumes on markets and market prices Pieter van Zyl, Potatoes South Africa Producers plant between 5 and 54 hectares of potatoes each year. According to Figure
LETTER FROM THE EXECUTIVE DIRECTOR
 E LETTER FROM THE EXECUTIVE DIRECTOR COFFEE MARKET REPORT December 2008 Price levels in December confirmed the downward trend recorded in the coffee market since September 2008. The monthly average of
Coffee market recovers slightly from December slump
 Coffee market recovers slightly from December slump After reaching its lowest level in 22 months in December 2017, the monthly average of the ICO composite indicator price increased by 1.4% to 115.60 US
Agricultural Exports, Economic Prospects and Jobs
 Agricultural Exports, Economic Prospects and Jobs West Hills Community College District Essential Elements Harris Ranch Inn and Conference Center November 6, 2014 Daniel A. Sumner University of California
Record Exports for Coffee Year 2016/17
 Record Exports for Coffee Year 2016/17 Total exports in September 2017 reached 8.34 million bags, compared to 9.8 million in September 2016. While coffee year 2016/17 registered a decrease in its final
WEEKLY MAIZE REPORT 30 OCTOBER 2018
 WEEKLY MAIZE REPORT 30 OCTOBER 2018 Unigrain (Pty) Ltd Tel. No. : +27 11 692 4400 Fax. No. : +27 11 412 1183 INTERNATIONAL MARKET Table 1: CME Maize prices and weekly changes (cents/bushel) Currently 23/10/2018
Networkers Business Update. December 2014
 Networkers Business Update December 2014 Agenda Forecast Milk Price Global markets V3 Strategy Growing our share of New Zealand milk Page 2 Forecast Milk Price 110 100 2012/13 2013/14 2014/15 Forecast
Corn and Soybean CORN OUTLOOK SOYBEAN OUTLOOK STATISTICS AND ANALYSIS
 Corn and Soybean CORN OUTLOOK SOYBEAN OUTLOOK STATISTICS AND ANALYSIS CLAL (and its officers, employees and auxiliary persons) shall not be liable to clients, web users or anyone else for any loss or injury
much better than in As may be seen in Table 1, the futures market prices for the next 12 months
 Dairy Outlook December 2009 By Jim Dunn Professor of Agricultural Economics, Penn State University Market Psychology prices are higher than last month, especially Class IV. The outlook for dairy prices
Soybean Oil and Palm Oil Account For An Increasing Share of World Vegetable Oil Consumption
 United States Department of Agriculture Foreign Agricultural Service Circular Series FOP 01-03 January 2003 Soybean Oil and Palm Oil Account For An Increasing Share of World Vegetable Oil Consumption Percent
WEEKLY OILSEED REPORT 31 OCTOBER 2018
 WEEKLY OILSEED REPORT 31 OCTOBER 218 Unigrain (Pty) Ltd Tel. No. : +27 11 692 44 Fax. No. : +27 11 412 1183 INTERNATIONAL MARKET Table 1: CME Soybean prices and weekly change (cents/bushel) Currently 24/1/218
WEEKLY MAIZE REPORT 28 NOVEMBER 2018
 WEEKLY MAIZE REPORT 28 NOVEMBER 2018 Unigrain (Pty) Ltd Tel. No. : +27 11 692 4400 Fax. No. : +27 11 412 1183 INTERNATIONAL MARKET Table 1: CME Maize prices and weekly changes (cents/bushel) Currently
WEEKLY MAIZE REPORT 13 JUNE 2018
 17/08/01 17/08/15 17/08/29 17/09/12 17/09/26 17/10/10 17/10/24 17/11/07 17/11/21 17/12/05 17/12/19 18/01/02 18/01/16 18/01/30 18/02/13 18/02/27 18/03/13 18/03/27 18/04/10 18/04/24 18/05/08 18/05/22 18/06/05
MONTHLY COFFEE MARKET REPORT
 E MONTHLY COFFEE MARKET REPORT July 2011 Downward corrections to coffee prices recorded in June continued during July 2011, as the monthly average of the ICO composite indicator price fell to 210.36 US
Fresh Deciduous Fruit (Apples, Grapes, & Pears): World Markets and Trade
: World Markets and Trade") Million MT United States Department of Agriculture Foreign Agricultural Service December 21 Fresh Deciduous Fruit (Apples, Grapes, & Pears): World Markets and Trade 21/11 Forecast: World Apple Trade Declines;
Million MT United States Department of Agriculture Foreign Agricultural Service December 21 Fresh Deciduous Fruit (Apples, Grapes, & Pears): World Markets and Trade 21/11 Forecast: World Apple Trade Declines;
Steel Market Report. AISI & WSA Data Charts. By Becky E. Hites
 Steel Market Report AISI & WSA Data Charts By Becky E. Hites April 4, 2015 Information included in this report is believed to be true and the author has exercised due diligence in obtaining the data from
Soft Commodity Markets - Upcoming Milestones, and How the Market Could Be Affected
 Soft Commodity Markets - Upcoming Milestones, and How the Market Could Be Affected September 15, 2014 Judith Ganes President J. Ganes Consulting, LLC Weather & Politics Current Weather Expectations El
For personal use only
 SEPTEMBER 216 GLOBAL DAIRY UPDATE European milk production has decreased for the first time since early 215, with volumes in June down 2 compared to last year. Last week we announced our annual results,
WEEKLY OILSEED REPORT 22 NOVEMBER 2018
 WEEKLY OILSEED REPORT 22 NOVEMBER 2018 Unigrain (Pty) Ltd Tel. No. : +27 11 692 4400 Fax. No. : +27 11 412 1183 INTERNATIONAL MARKET Table 1: CME Soybean prices and weekly change (cents/bushel) Currently
South American Soybean Stocks (Argentina and Brazil) Expected to Increase in 2001/02 to Record Level Despite Record Exports
 Expected to Increase in 2001/02 to Record Level Despite Record Exports") United States Department of Agriculture Foreign Agricultural Service Circular Series FOP 02-02 February 2002 South American Soybean Stocks (Argentina and Brazil) Expected to Increase in 2001/02 to Record
United States Department of Agriculture Foreign Agricultural Service Circular Series FOP 02-02 February 2002 South American Soybean Stocks (Argentina and Brazil) Expected to Increase in 2001/02 to Record
2018/19 expected to be the second year of surplus
 2018/19 expected to be the second year of surplus Coffee year 2018/19 is expected to be the second consecutive season of surplus, as global output, estimated at 167.47 million bags, exceeds world consumption,
Milk and Milk Products: Price and Trade Update
 Milk and Milk Products: Price and Trade Update June 217 * International dairy prices The FAO Dairy Price Index averaged 29 points in June, up 16 points (8.3 percent) from January 217 and 71 points (51.5
WEEKLY MAIZE REPORT 11 JULY 2018
 28 29 21 211 212 213 214 215 216 217 218 WEEKLY MAIZE REPORT 11 JULY 218 Unigrain (Pty) Ltd Tel. No. : +27 11 692 44 Fax. No. : +27 11 412 1183 INTERNATIONAL MARKET Table 1: CME Maize prices and weekly
WEEKLY MAIZE REPORT 06 FEBRUARY 2019
 WEEKLY MAIZE REPORT 06 FEBRUARY 2019 Unigrain (Pty) Ltd Tel. No. : +27 11 692 4400 Fax. No. : +27 11 412 1183 INTERNATIONAL MARKET Table 1: CME Maize prices and weekly changes (cents/bushel) Currently
Sugar scenario in CIS countries:
 Sugar scenario in CIS countries: on the way to self-sufficiency Andrey Bodin Eurasian Sugar Association Commonwealth of Independent States (CIS) consists of 11 countries CIS Moldova Belarus Population
Coffee market ends 2016/17 coffee year in deficit for the third consecutive year
 Coffee market ends 2016/17 coffee year in deficit for the third consecutive year The ICO composite indicator continued its downward trend that started at the end of August, averaging 124.46 US cents/lb.
Dairy Outlook. December By Jim Dunn Professor of Agricultural Economics, Penn State University. Market Psychology
 Dairy Outlook December 2015 By Jim Dunn Professor of Agricultural Economics, Penn State University Market Psychology The Class III market has taken a beating lately as cheese prices have drifted down and
MONTHLY COFFEE MARKET REPORT
 1 E MONTHLY COFFEE MARKET REPORT March 2014 Ongoing uncertainty over the Brazilian coffee crop has caused significant fluctuations in coffee prices during March, with monthly volatility of the International
MONTHLY COFFEE MARKET REPORT
 E MONTHLY COFFEE MARKET REPORT December 2011 In December 2011 Arabica prices underwent significant downward corrections while Robusta prices increased slightly. The average of the 2 nd and 3 rd positions
Volatility returns to the coffee market as prices stay low
 Volatility returns to the coffee market as prices stay low Daily coffee prices hit their lowest level in 19 months during August, as commodity markets worldwide were negatively affected by currency movements
CBH 2015/16 QUALITY REPORT
 CBH 2015/16 QUALITY REPORT CBH GROUP Our business OUR CUSTOMERS Flour millers, Maltsters Feed manufacturers Food processors OUR GROWERS 4500 members 10 million tonnes production average Largest Co-op in
MONTHLY COFFEE MARKET REPORT
 E MONTHLY COFFEE MARKET REPORT February 2012 Coffee prices presented a mixed performance in February, with Arabicas slipping and Robustas increasing by a similar amount. This resulted in a sharp narrowing
Record exports from Brazil weigh heavy on the coffee market
 Record exports from Brazil weigh heavy on the coffee market Coffee exports from Brazil reached a record high of 36.8 million bags in crop year 2014/15 (April to March), fuelled by domestic stocks and encouraged
Coffee prices maintain downward trend as 2015/16 production estimates show slight recovery
 Coffee prices maintain downward trend as 2015/16 production estimates show slight recovery The coffee market fell again in December 2015, reaching its second lowest monthly average of the year. This decrease
MONTHLY COFFEE MARKET REPORT
 E MONTHLY COFFEE MARKET REPORT July 2012 Coffee prices rebounded in July 2012, with the ICO composite indicator increasing by 9.5% compared to June, following nine consecutive months of price falls. The
World Agricultural Outlook Board Interagency Commodity Estimates Committee Forecasts. Lockup Briefing February 10, 2015
 World Agricultural Outlook Board Interagency Commodity Estimates Committee Forecasts Lockup Briefing World Wheat Production Country or Region Million Tons Percent Percent World 716.1 725.0 0.2 1.2 United
MONTHLY COFFEE MARKET REPORT
 E MONTHLY COFFEE MARKET REPORT June 2013 Coffee prices fell sharply in June 2013, as market fundamentals, combined with an uncertain macroeconomic outlook, drove the ICO composite indicator price to its
Fresh Deciduous Fruit (Apples, Grapes, & Pears): World Markets and Trade
: World Markets and Trade") United States Department of Agriculture Foreign Agricultural Service Fresh Deciduous Fruit (Apples, Grapes, & Pears): World Markets and Trade 9 1, MT Deciduous Fruit on Seasonal Cycles 6 Northern Hemisphere
United States Department of Agriculture Foreign Agricultural Service Fresh Deciduous Fruit (Apples, Grapes, & Pears): World Markets and Trade 9 1, MT Deciduous Fruit on Seasonal Cycles 6 Northern Hemisphere
Industry Advisory Panel Item 4c Trade of Stainless Steel Scrap
 Industry Advisory Panel Item 4c Trade of Stainless Steel Scrap Lisbon Tuesday 22 April 2008 Sven Tollin Chief Statistician 1 Stainless Steel Waste & Scrap Comparison calendar with Except Kazakhstan only
India. Oilseeds and Products Update. August 2012
 THIS REPORT CONTAINS ASSESSMENTS OF COMMODITY AND TRADE ISSUES MADE BY STAFF AND NOT NECESSARILY STATEMENTS OF OFFICIAL U.S. GOVERNMENT POLICY Required Report - public distribution Oilseeds and Products
Monitoring EU Agri-Food Trade: Development until March 2018
 Monitoring EU Agri-Food Trade: Development until March 2018 14.000 EU28: Export to Extra-EU of Agri-Food Products 13.000 12.000 11.000 10.000 2018 2017 2015 2016 2014 9.000 8.000 7.000 6.000 Jan Feb Mar
LETTER FROM THE EXECUTIVE DIRECTOR COFFEE MARKET REPORT. November 2004
 International Coffee Organization Organización Internacional del Café Organização Internacional do Café Organisation Internationale du Café E LETTER FROM THE EXECUTIVE DIRECTOR COFFEE MARKET REPORT November
GLOBAL DAIRY UPDATE KEY DATES MARCH 2017
 MARCH 2017 GLOBAL DAIRY UPDATE European milk production decreased for the seventh consecutive month, while the US remains strong. The rate of decline in New Zealand production is easing. US exports continue
Global Considerations
 What Does Being a Global Player Mean to the U.S. Dairy Sector? Global Considerations 2 1 A Decade of Change $8, 4,5 $7, 4, (Million $) $6, $5, $4, $3, $2, $1, 3,5 3, 2,5 2, 1,5 1, 5 (Million Lbs.) $ 23
Soybean Exports Top 66 MMT in 2005/06
 United States Department of Agriculture Foreign Agricultural Service Circular Series FOP 6-05 June 2005 Soybean Exports Top 66 MMT in 2005/06 35 30 Major Exporters Major Importers 25 MMT 20 15 10 5 0 Argentina
2007 Sonoma Research Associates - All rights reserved.
 2007 Sonoma Research Associates - All rights reserved. Practical Applications of the Price Elasticity of Demand Presented by Dan Karnowsky, President Sonoma Research Associates Presented at Competitive
What Does Being a Global Player Mean to the U.S. Dairy Sector?
 What Does Being a Global Player Mean to the U.S. Dairy Sector? Global Considerations Copyright of Daily Dairy Report, Inc. 2 A Decade of Change $8,000 4,500 $7,000 4,000 (Million $) $6,000 $5,000 $4,000
Part 1: California Ag Exports Main Points From 2008 to 2009 California agricultural exports declined about 5 percent.
 The Importance of California Agricultural Exports: Situation, Outlook and Policy Prospects, with emphasis on the Korea Free Trade Agreement California Fresh Carrot Advisory Board 11 Research hsymposium
SEP'17: 171 MAR'18: 182 SEP'18: 183 Daily Volume. Euronext milling wheat futures 20/05 30/05 09/06 19/06 29/06 09/07 19/07
 Trade Weekly volume - thousand tonnes Total MY - million tonnes Weekly volume - thousand tonnes Total MY - million tonnes Weekly volume - thousand tonnes Total MY - million tonnes Million tonnes Production
Becoming a Smarter Trader: The Market Impact of the Structure in the Sugar, Coffee, and OJ Markets
 Becoming a Smarter Trader: The Market Impact of the Structure in the Sugar, Coffee, and OJ Markets Judith Ganes March 12 th, 2014 Increasing Reliance on a Few Suppliers for Global Needs Efficiency gains
Coffee Season 2013/14 Finishes in Balance but Deficit Expected Next Year
 Coffee Season 2013/14 Finishes in Balance but Deficit Expected Next Year Coffee prices were volatile again over the course of September, mostly reacting to weather news from Brazil. Daily prices fell initially
Coffee market remains volatile but lacks direction
 Coffee market remains volatile but lacks direction Prices fluctuated significantly during August, with the ICO composite indicator dropping by 10 cents before jumping back up another 12 cents by the end
Downward correction as funds respond to increasingly positive supply outlook
 Downward correction as funds respond to increasingly positive supply outlook Coffee prices fell sharply at the end of April as institutional investors sold off their positions. The coffee market continues
Chinese Peanut Exports Hit Record High
 United States Department of Agriculture Foreign Agricultural Service Circular Series FOP 04-03 April 2003 Chinese Peanut Exports Hit Record High 600 500,000 MT 400 China US 300 Vietnam Argentina 200 India
MMT / / / / / /05* *Forecast. United States Department of Agriculture. Foreign Agricultural Service
 United States Department of Agriculture Foreign Agricultural Service Circular Series FOP 12-04 December 2004 Brazilian Soybean Exports Revised Higher in 2003/04, Gain in U.S. Dominated Markets Brazil s
World Palm Oil Imports
 United States Department of Agriculture Foreign Agricultural Service Circular Series FOP 11-03 November 2003 World Palm Oil Imports 20,000 1,000 MT 15,000 10,000 5,000 0 1999/00 2000/01 2001/02 2002/03
MONTHLY COFFEE MARKET REPORT
 E MONTHLY COFFEE MARKET REPORT August 2012 Coffee prices experienced negative corrections across the board in August 2012, with the ICO composite indicator falling by 6.6% compared to July. This continues
WEEKLY MAIZE REPORT 13 DECEMBER 2017
 90/91 91/92 92/93 93/94 94/95 95/96 96/97 97/98 98/99 99/00 00/01 01/02 02/03 03/04 04/05 05/06 06/07 07/08 08/09 09/10 10/11 11/12 12/13 13/14 14/15 15/16 16/17 17/18 WEEKLY MAIZE REPORT 13 DECEMBER 2017
Brazil. Coffee Annual. Coffee
 THIS REPORT CONTAINS ASSESSMENTS OF COMMODITY AND TRADE ISSUES MADE BY USDA STAFF AND NOT NECESSARILY STATEMENTS OF OFFICIAL U.S. GOVERNMENT POLICY Required Report - public distribution Date: 5/7/2015
Market Brief for Asia Fruit Logistica. Hong Kong & Macau, Makret Dynamic Markets for U.S. Exports
 Market Brief for Asia Fruit Logistica Hong Kong & Macau, Makret Dynamic Markets for U.S. Exports September 5, 2017 1 USDA Foreign Agricultural Service (FAS) - ATO Hong Kong - FAS offices are staffed by
World Soybean Stocks Rise Sharply
 United States Department of Agriculture Foreign Agricultural Service Circular Series FOP 08-04 August 2004 World Soybean Stocks Rise Sharply Million Tons 50 40 World Stocks U.S. Stocks Brazil Stocks 50
SFR Condo Residential Lot Sales Inventory Sales Inventory Sales Inventory. Month YTD Month Month YTD Month Month YTD Month
 Grand Strand Market Report 2016 Sales activity in the Grand Strand ended 2016 with a solid month of sales. SFR sales are up 2.0% for the month and up 4.1% for the year; setting a new market record for
U.S. Imports of Soybeans, Meal, and Oil
 United States Department of Agriculture Foreign Agricultural Service Circular Series FOP 03-04 March 2004 U.S. Imports of Soybeans, Meal, and Oil 1,000 MT 450 400 350 300 250 200 150 100 50 0 '99/00 '00/01
LETTER FROM THE EXECUTIVE DIRECTOR
 E LETTER FROM THE EXECUTIVE DIRECTOR COFFEE MARKET REPORT January 2010 The upward trend in coffee prices recorded in December2009 continued during the first fortnight of 2010, with the monthly average
Global Trade in Mangoes
 Global Trade in Mangoes October 2014 Jim Lang Managing Director TradeData International Pty Ltd jim.lang@tradedata.net www.tradedata.net COUNTRIES WITH MONTH IMPORT STATISTICS 1. The global market is just
Strong U.S. Soybean Exports to Date Should Lead to Marketing Year Record
 United States Department of Agriculture Foreign Agricultural Service Circular Series FOP 04-01 April 2001 Strong U.S. Soybean Exports to Date Should Lead to Marketing Year Record U.S. Soybean Exports to
SEP'16: 162 MAR'17: 169 SEP'17: 176 Daily Volume. Euronext milling wheat futures 14/05 24/05 03/06 13/06 23/06 03/07 13/07
 Trade Weekly volume - thousand tonnes Total for MY - million tonnes Weekly volume - thousand tonnes Total f or MY - million tonnes Weekly volume - thousand tonnes Total f or MY - million tonnes TRQs Thousand
THIS REPORT CONTAINS ASSESSMENTS OF COMMODITY AND TRADE ISSUES MADE BY USDA STAFF AND NOT NECESSARILY STATEMENTS OF OFFICIAL U.S.
 THIS REPORT CONTAINS ASSESSMENTS OF COMMODITY AND TRADE ISSUES MADE BY USDA STAFF AND NOT NECESSARILY STATEMENTS OF OFFICIAL U.S. GOVERNMENT POLICY Required Report - public distribution Date: 5/7/2014
The Changing Landscape of Dairy: A Regional Outlook. Mark Stephenson Director of Dairy Policy Analysis
 The Changing Landscape of Dairy: A Regional Outlook Mark Stephenson Director of Dairy Policy Analysis Millions of Pounds Let s remember when 32,000 30,000 28,000 Wisconsin Annual Milk Production It s the
P E C A N R E P O R T
 P E C A N R E P O R T Agricultural Marketing Service 16 Forest Parkway Specialty Crops Programs Building 1-218 Market News Division Forest Park, Georgia 30297 Phone (404) 361-1376 FAX (404) 363-2523 Pecan
Market Brief for Seafood Expo Asia. Hong Kong & Macau, Makret Dynamic Markets for U.S. Exports
 Market Brief for Seafood Expo Asia Hong Kong & Macau, Makret Dynamic Markets for U.S. Exports September 4, 2017 1 USDA Foreign Agricultural Service (FAS) - ATO Hong Kong - FAS offices are staffed by Foreign
SFR Condo Residential Lot Sales Inventory Sales Inventory Sales Inventory. Month YTD Month Month YTD Month Month YTD Month
 Grand Strand Market Report 2018 was a strong month for sales activity in the Grand Strand with SFR and condo sales volume up 5.11% and 19.14%, respectively, for the month. Residential lot sales are also
DEC'17: 163 MAY'18: 172 DEC'18: 177 Daily Volume. Euronext milling wheat futures 03/09 13/09 23/09 03/10 13/10 23/10 02/11
 Trade Weekly volume - thousand tonnes Total MY - million tonnes Weekly volume - thousand tonnes Total MY - million tonnes Weekly volume - thousand tonnes Total MY - million tonnes Million tonnes Production
Price monitoring of key food items in Donetsk and Luhansk Oblasts
 Market update Issue (October ) UKRAINE Price monitoring of key food items in Donetsk and Luhansk Oblasts Fighting hunger worldwide Highlight Cost of food basket remained higher at national level throughout
Coffee market ends 2014 at ten month low
 Coffee market ends 2014 at ten month low Coffee prices continued to slide downwards in December 2014, with the monthly average of the ICO composite indicator at its lowest level since February. Recent
MONTHLY COFFEE MARKET REPORT
 E MONTHLY COFFEE MARKET REPORT June 2012 In June 2012 coffee prices, particularly those of Arabicas, continued the fall recorded in recent months. The drop in Robusta prices was less marked than in the
World apple juice market production and consumption trends
 World apple juice market production and consumption trends Klaus Heitlinger Association of the German fruit juice industry In 2013 I asked you: Who will be the next world soccer champion? Germany is the
MONTHLY COFFEE MARKET REPORT
 E MONTHLY COFFEE MARKET REPORT February 2014 February 2014 has seen significant developments in the coffee market, with prices shooting upwards at a startling rate. The ICO composite daily price has increased
MGEX Spring Wheat 2013
 MGEX Spring Wheat 213 The Minneapolis Grain Exchange, Inc. (MGEX) has been the principal market for hard red spring (HRS) wheat since 1881, offering futures and options contracts based on this unique commodity.
Stocks Build as Soybean Supply Rises in 2004/05
 United States Department of Agriculture Foreign Agricultural Service Circular Series FOP 06-04 June 2004 Stocks Build as Soybean Supply Rises in 2004/05 Percent Change from 2003/04 14% 12% 10% 8% 6% 4%
India: Soybean Oil Forecast to Gain Larger Share of Import Market in 2004/05
 United States Department of Agriculture Foreign Agricultural Service Circular Series FOP 3-5 March 25 India: Soybean Oil Forecast to Gain Larger Share of Import Market in 8 Percentage 6 4 2 2/1 21/2 22/3
JUL'16: 172 DEC'16: 181 JUL'17: 185 Daily volume. Euronext milling wheat futures 09/04 19/04 29/04 09/05 19/05 29/05 08/06
 Trade Weekly volume - thousand tons Total f or MY - million tons Weekly volume - thousand tons Total f or MY - million tons Weekly volume - thousand tons Total f or MY - million tons TRQs Thousand tons
China Importing Record Levels of Soybeans
 United States Department of Agriculture Foreign Agricultural Service Circular Series FOP 10-03 October 2003 China Importing Record Levels of Soybeans 25,000 20,000 1,000 MT 15,000 10,000 5,000 0 1997/98
Coffee Market Outlook
 Coffee Market Outlook 15 th Asia International Coffee Conference Ho Chi Minh City, Vietnam 7-9 December 2009 Néstor Osorio Executive Director ICO composite indicator price Monthly: January 2000 to November
Brazil. Citrus Semi-annual. Fresh Oranges and Orange Juice
 THIS REPORT CONTAINS ASSESSMENTS OF COMMODITY AND TRADE ISSUES MADE BY USDA STAFF AND NOT NECESSARILY STATEMENTS OF OFFICIAL U.S. GOVERNMENT POLICY Required Report - public distribution Date: GAIN Report