The substitutability among Japanese, Taiwanese and South Korean fronzen tuna
|
|
|
- Stella Oliver
- 6 years ago
- Views:
Transcription
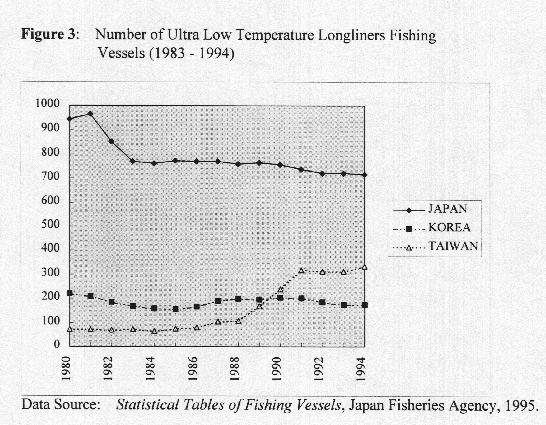
1 The substitutability among Japanese, Taiwanese and South Korean fronzen tuna By: Lih-Chyun Sun * Hsi-Chiang Liu** Li-Fen Lei * Wann-ChangShyu**** * Associate Professor. Department of Agricultural economics, National Taiwan University, No. 1, Sec. 4. Roosevelt R-d.. Taipei. Taiwan. R. 0. C. ** Professor. Institute of Oceanography. National Taiwan University- No, 1. Sec. 4, Roosevelt Rd.. Taipei. Taiwan. R. 0. C. *** Graduate Student. Institute of Oceanography, National Taiwan University, No. 1, Sec. 4. Roosevelt Rd., Taipei. Taiwan. R. 0. C. The substitutability among Japanese, Taiwanese and South Korean Frozen tuna Lih-Chvun Sun. Hsi-Chianc Liu. Li-Fen Lei-Wann-Chang Shyu I- Introduction Japan is the number 1 country in the world in terms of tuna harvest[1]. For example, it started from about 294,961 tons in 75, then reached its peak at 371,103 tons in 85. Although the harvest declined since 85, it bounced back for the recent years and reached 343,611 tons in 93 (Table 1 and Figure I). While Japan has the largest tuna harvest in the world, it relies on import for both fresh and frozen tuna to meet its domestic demand. The amount imported has increased from about 84,703 tons in 81 to around 273,399 tons in 93 (Table 2) of which the frozen tuna has increased from about 73,000 tons to about 184,000 tons. For domestically demanded frozen tuna, Thunnus albacares (i.e. Yellow Fin tuna) and Thunnus obsess (i.e. Big Eye tuna) are the two major categories. Other than domestic supply, Taiwan and South Korea are the two major suppliers among about fifty countries. Starting 90, Taiwan exceeded South Korea and became the largest foreign frozen tuna supplier to Japan. The Taiwanese tuna deep-sea long-line fisheries has been an important part of its fishery industry. Compared to Taiwanese deep-sea fishery, the Tuna fishery took about 50% of the value before 91. Recently, the ratio increased to 62.9% (92), (75.0) (93) and dropped a little bit to 68.3% in 94 (Table 3). As compared to the fishery industry as a whole, Taiwanese tuna fishery took more than 20% of the total value for the past several years (Table 4). In order to develop the Japanese tuna sashimi market, the ultra low temperature long-liners was promoted in the Taiwanese tuna fishery industry at 76, and the number of ultra low temperature long-liners fishing vessels had reached 334 at 94. Although the number of Taiwanese ultra low temperature long-liners fishing
2 vessels is still far less than Japanese (716 in 94), it exceeded South Korean since 90 (Table 5 and Figure 3). In order to keep the reasonable profit level for all Japanese, Taiwanese and South Korean tuna fishery industries, protect the welfare of the Japanese consumers, maintain the sustainable harvest rate and the stability of the Japanese tuna sashimi market, it is very important to understand the Japanese tuna sashimi market, especially the demand side of the market. Although the demand for tuna sashimi can be divided into "fresh'' and "frozen" tuna sashimi, it is the frozen tuna sashimi that had been imported the most. Among the imported frozen tuna, Big Eye and Yellow Fin tuna are the two major categories which are also the major harvest for both Taiwanese and South Korean ultra low temperature long-liners fishing vessels. In this study, we concentrate on the Japanese tuna sashimi demand. To be more specific, the Japanese demand for Japanese, Taiwanese and South Korean produced Yellow Fin and Big Eye Tuna. Our goal is to study the substitutability among Japanese, Taiwanese as well as South Korean produced Yellow Fin and Big Eye tuna. The rest of this study is arranged in the following way. The theoretical demand system model and its empirical specifications are described in the second section. The third section presents the data description and the estimation results. Some of the important findings are also summarized in the section. Finally, a brief conclusion is given in the last section. 2. Demand system specification The main purpose of this study is to understand the substitutability among Japanese, Taiwanese and South Korean produced frozen tuna in the market of Japan. In order to achieve this goal, a demand system that describes the Japanese demand behavior among Japanese, Taiwanese and South Korean produced frozen tuna has to be constructed and estimated. In the following section, an ordinary demand system model will be briefly discussed. 2.1 Ordinary Demand System Following Huang and Hahn (95) and Huang 93, 91), let q been mx1 column vector which represents the quantities demanded for a consumer, p an 1 X m rowvector of the corresponding prices, y = p.q the consumer expenditure which is the inner product of p and q. and u(q) the utility function which is assumed to be quasiconcave in q. The utility maximization under constraint can be set up by the a Lagrangean function with the multiplier A : Max L=u(q)+ (y-p.q) q. According to the first order condition (FOC) of the above maximization problem, it is shown that
 for the maximization problem implies that the Hessian matrix H = ui(q)= 2 u / 2 qi u 2 qj is, symmetric and negative definite.")

3 ui(q)= pi and y=p.q, where u,(c/) is the marginal utility of the ith commodity, I=1, 2,, m, and is known as the marginal utility of income. The second order condition (SOC) for the maximization problem implies that the Hessian matrix H = ui(q)= 2 u / 2 qi u 2 qj is, symmetric and negative definite. The ordinary demand system is obtained by solving the FOC: With the unknown utility structure, an ordinary demand system model can be approached by applying The above equation can be rewritten by the expression of price and income elasticities : where is the price elasticity of by the commodity with respect to a price change of the j commodity, and is the expenditure elasticity showing the effect of the quantity in reponse to a change in per capita expenditure. To ensure theoretical consistency in applying the differential-form demand model, given wi=piqi / y the expenditure weight of the commodity and e*ij a compensated elasticity, the following parametric constraints should be applied (Hicks. 36):
4 Negativity: eii +wi i <0, i =1,2,m. Linkage condition: e*ij = eij + wj, i, j=1,2 m. The Engel aggregation states that the sum of the expenditure elasticities weighted by the expenditure shares of corresponding commodities equals 1. The homogeneity condition implies that a consumer has no money illusion, and thus a proportional change in both price and expenditure leaves quantity demanded unchanged. The symmetry condition is derived from the symmetry of the Slutsky income compensated substitution terms. The negativity condition which implies that an increase in price with utility held constant must cause demand for that good to fall. Finally, the linkage condition is an expression of the Slutsky equation in terms of elasticity. 2.2 Empirical Models Specification Based on the derivation from the previous section, a theoretically consistent empirical differential-form demand system could be specified as Where q i,p i and y' are the relative changes in quantity, price, and per capita expenditure which can be defined as the first-order difference of the natural logarithm form[2]. The parameters ci,, eij and i, are constant term, price and expenditure elasticities respectively. In order to ensure the internal consistency with the demand structure provided by the demand theory, the parametric constraints of Engel aggregation
![and symmetry which described in the previous section should also be imposed into the estimation procedure[3] 3.](/docs-images/77/74658679/images/5-0.jpg "Estimation Results According to Huang (94), the demand for tuna as a whole are not related to the demand for beef, pork, chicken as well as to other kinds of fresh fishes.")
5 and symmetry which described in the previous section should also be imposed into the estimation procedure[3] 3. Estimation Results According to Huang (94), the demand for tuna as a whole are not related to the demand for beef, pork, chicken as well as to other kinds of fresh fishes. Huang's results suggested that the demand for different kinds of tuna can be modeled separately without considering the demand for other kinds of food, namely, beef, pork, chicken and other kinds of fresh fishes in the Japanese market. 3.1 Description of the Data Set To avoid modeling the short term shocks from the Japanese Tuna sashimi market, e.g. seasonably, storage, and stocking etc.. annual data ranged from 80 to 93 are adopted in the empirical model. Since the tuna sashimi consumption data are not fully available, Japanese tuna harvest and tuna import data are used to replace the consumption data. The average tuna prices are generated as the total value of the annual harvest (import) divided by the total quantities of the annual harvest (import). Variables used in estimating the demand for Japanese, Taiwanese, South Korean, and other countries produced Yellow Fin and Big Eye tuna are: DFJYFQ: quantity of Japanese produced frozen Yellow Fin tuna in log-difference form (unit:: Kg.)[4]. DFTYFQ: quantity of Taiwanese produced frozen Yellow Fin tuna in log-difference form (unit: Kg.)[5] DFKYFQ: quantity of South Korean produced frozen Yellow Fin tuna in logdifference form (unit: Kg.). DFOYFQ: quantity of other countries produced frozen Yellow Fin tuna in logdifference form (unit: Kg.). DFJBEQ: quantity of Japanese produced frozen Big Eye tuna in log-difference form (unit: Kg.). DFTBEQ: quantity of Taiwanese produced frozen Big Eye tuna in log-difference form (unit: Kg.). DFKBEQ: quantity of South Korean produced frozen Big Eye tuna in logdifference form (unit: Kg.). DFOBEQ: quantity of other countries produced frozen Big Eye tuna in logdifference form (unit: Kg.).
6 DFJYFP: price of Japanese produced frozen Yellow Fin tuna in log-difference form (unit: Japanese Yen / Kg.). DFTYFP: price of Taiwanese produced frozen Yellow Fin tuna in log-difference form (unit: Japanese Yen / Kg.). DFKYFP: price of South Korean produced frozen Yellow Fin tuna in log-difference form (unit: Japanese Yen / Kg.). DFOYFP: price of other countries produced frozen Yellow Fin tuna in logdifference form (unit: Japanese Yen / Kg.). DFJBEP: price of Japanese produced frozen Big Eye tuna in log-difference form (unit: Japanese Yen / Kg.). DFTBEP: price of Taiwanese produced frozen Big Eye tuna in log-difference form (unit: Japanese Yen / Kg.). DFKBEP: price of South Korean produced frozen Big Eye tuna in log-difference form (unit: Japanese Yen / Kg.), DFOBEP: price of other countries produced frozen Big Eye tuna in log-difference form (unit: Japanese Yen / Kg.). DTV: total value of the Japanese produced and imported Yellow Fin and Big Eye tuna in log-difference form. [6] 3.2 Estimation Results The empirical model is specified by eight equations: d Qi = Ci + i,1 DFJYFP + i,2 DFTYFP + i,3 DFKYFP + i,4 DFOYFP + i,5 DFJBEP + i,6 DFTBEP + i,7 DFKBEP + i8j DFOBEP + i,9 DOTV, where d QI, represents DFJYFQ, DFTYFQ, DFKYFQ, DFOYFQ, DFJBEQ, DFTBEQ, DFKBEQ, and DFOBEQ for different value of i s. Due to the serious multi-colinearity among regressors, a theoretically more efficient estimator, i.e. a SUR (seemingly unrelated regression) model with restrictions could not be applied. Instead, an OLS estimator without any restriction is then adopted for each equation. Since the regressors are exactly the same for each of the eight equations, OLS and SIJR estimators will produced the same estimates for the parameters, though the OLS estimates are less efficient. Results of the estimation are presented in Table 6 for Yellow Fin tuna and in Table 7 for Big Eye tuna respectively. Some of the important OLS results can be summarized as following: 1. As the price of the Taiwanese produced Yellow Fin tuna increases by 1%, the demand for Japanese produced Yellow Fin will increase by 0.57%, which shows that Japanese and Taiwanese produced Yellow Fin tuna are substitutes, although the substitutability are not very strong.
7 2. As the price of the South Korean produced Yellow Fin tuna increases by 1%, the demand for Taiwanese produced Yellow Fin will decrease by 4.10%, which shows that they are sort of complements and the complementability are quite large. 3. As the price of the Japanese produced Yellow Fin tuna increases by 1%, the demand for South Korean produced Big Eye tuna will increase by 0.45%, which shows that they are somewhat substitutable. 4. As the price of the Taiwanese produced Yellow Fin tuna increase by 1%, the demand for South Korean produced Big Eye tuna will decrease by 1.04%, which denoted a complementability between these two kinds of tuna. 5. When total Japanese expenditure increase, the consumption of Japanese produced Yellow Fin tuna and South Korean produced Big Eye tuna will increase. However, the consumption of the Japanese produced Yellow Fin tuna is more elastic. 4. Conclusions Japan is the only significant market of tuna sashimi in the world. Although Japan has the largest tuna harvest in the world, it still rely on import to satisfy its domestic demand, especially for frozen Yellow Fin and Big Eye tuna. Among all the fifty, some Yellow Fin and Big Eye tuna producer countries, Taiwan and South Korea, are the two most important ones in terms of both value and quantities produced. Tuna fishery industry is a very important part of Taiwanese fishery industry. The value produced by the Taiwanese tuna industry took about 30% of the total value of the Taiwanese fishery and about 75% of the total value of the Taiwanese deepsea fishery industry in 93. Since frozen Yellow Fin and Big Eye tuna are the major harvest of the Taiwanese tuna fishery industry, and most of the harvest are exported to the Japanese sashimi market, it is important for the Taiwanese tuna fishery industry to understand the Japanese tuna sashimi market. Based on the concept of a demand system, this study studied the substitutability among the Japanese, Taiwanese and South Korean produced frozen Yellow Fin and Big Eye tuna sashimi. Empirical results suggested that the consumption of Japanese produced frozen Big Eye tuna sashimi is really not related at all to other kinds of tuna sashimi which produced by other countries. There is no substitutability even between the Japanese produced Big Eye and Yellow Fin tuna sashimi. As for the Yellow Fin tuna sashimi, there is an interesting result. Unlike the case of the Big Eye tuna sashimi, it was shown that when the price of the Taiwanese produced Yellow Fin tuna sashimi increases, some of its demand will shirt to the Japanese produced Yellow Fin tuna sashimi (with the cross elasticity equal 0.57). However, when the price of the Japanese produced Yellow Fin tuna sashimi changes, the demand won't shift to the Taiwanese produced Yellow Fin tuna sashimi at all. Due to the serious multi-colinearity among regressors, a theoretically more efficient estimator. SUR model, with restriction estimated by FGES, could not be applied. OES was then used to estimate the empirical models. Although the 01.S
8 would produce the same parameters estimates as the SUR did. It was less efficient and all the theoretically consistent restrictions could not be applied. A SUR model with restrictions which estimated by MEE shall be adopted in the future in order to acquire more efficient parameters estimates. References Association of Agriculture and Forestry Statistics. Japan (March 95),Annual Statistics on Marketing of Fishery Product. Taiwan Fisheries Bureau (June 95). Fishery Yearbook. Taiwan Area. 94. Department of Agriculture and Forestry, Provincial Government of Taiwan. R. 0. C. Hicks, J. R. (36), Value and Capital. Oxford. U. K.: Oxford University Press. Huang, H. W. (94). "The Demand of Tuna in Japan and the Demand of Taiwanese Frozen Tuna Exported to Japan." M. S. thesis. Institute of Oceanography. National Taiwan University, Taipei, Taiwan. R, 0. C. Huang. K. S. And W. F. Hahn (95), "U. S. Quarterly Demand for Meats, "U. S. Department of Agriculture- Economic Research Service. Technical Bulletin No, Huang, K. S. (t993), "A Complete System of U.S. Demand for Food." U. S. Department of Agriculture. Economic Research Service. Technical Bulletin No Huang. K. S. (91), "U. S. Demand for Food: A Complete System of Quantity Effects on Prices" U. S. Department of Agriculture. Economic Research Service. Technical Bulletin No Japan Tariff Association. Japan Exports & Imports Country by Commodity, various issues. Japan Fisheries Agency (95), Statistical Tables of Fishing Vessels.
9 TABLE 1: Japanese Tuna Harvest (75-93) Unit : Tons Ye ar Blu e Fin BIG Eye Yello w Fin ! I42I Data Source: Annual Statistics on Marketing of Fishery Products. 93, Association of Agriculture and Forestry Statistics. Japan. March 95. Albac ore Total
10 Table 2: Japanese Imported Tuna (81-93) Ye ar Total Imported , Imported from Taiwan Imported from South Korea , ) H Data Source: Japan Exports & Imports Country by Commodity, Japan Tariff Association. Imported from other Countries ,
11 Table 3: Taiwanese Deep-sea Fishery Vs. Tuna Fishery (80-94) Deep-sea Fishery Tuna Fishery Year Quantity (1000 tons) value (N.T.$ ) Quantity (1000 tons) (2) Value (N.T.$ ) (2)/(1) % % % % ,6% % % % % % % % % % % Data Source: Fishery yearbook. Taiwan Area. 94. Taiwan Fisheries Bureau- Department of Agriculture and Forestry. Provincial Government of Taiwan. R. 0. C- June 95-
12 Table 4: Taiwanese Fishery Industry Vs. Tuna Fishery (83-94) Year (1) Total Fishery Industry (N.T.$1.000) (2) Tuna Fishery (N.T.$ 1,000) (2)/(I) (%) Ut ,376, ,707 12, S9.154.i , , , Data Source: Fishery Yearbook. Taiwan Area, 94. Taiwan Fisheries Bureau. Department of Agriculture and Forestry, Provincial Government of Taiwan. R. 0. C., June 95. Table 5: Number of Ultra Low Temperature Long-liners Fishing Vessels (83-94) SOUTH Year JAPAN TAIWAN KOREA Data Source: Statistical Tables of Fishing Vessels, Japan Fisheries Agency- 05
13 Table 6: OLS Results: Frozen Yellow Fin Tuna Consumption Dependent Variable DFJYFQ DFTYFQ DFKYFQ DFOYFQ CONSTANT * 0.18 (0.11) (0.06) (0.03) (0.65) DFJYFP -0.98* (0.16) (0.51) (0.28) (3.03) DFTYFP 0,57* 1.96* (0.181) (0.58) (0.32) (3.45) DFKYFP * -2.91* 2.57 (0.32) (1.04) (0.57) (6.13) DFOYFP * 0.25 (0.04) (0.14) (0.08) (0.82) DFTBEP (1.43) (1.39) (0.76) (8.2;1) DFKBEP (0.46) (1.48) (0.81) (8.73) DFOBEP (0.44) (1.43) (0.78) (8.46) D1V 1.60* (0.40) (1.31) (0.72) (7.76) R 2 Adj. R 2 F-Value Annual data Number in parentheses are standard errors. 3.* indicates significant at 90% level.
14 Table 7: OLS Results: Frozen Big Eye Tuna Consumption Dependent Variable DFJBEQ DFTBEQ DFKBEQ DFOBEQ CONSTANT (0.05) 0.04 (0.07) -0.16* (0.02) 0.05 (0.14) DFJYFP 0.18 (0.23) (0.34) 0.45* (0.09) 0.05 (0.65) DFKYFP -0. (0.26) -1.24* (0.39) -1.04* (0.11) (0.73) DFKYFP 0.30 (0.46) 0.46 (0.70) -0.61* (0.) 1.05 (1.31) DFOYFPP (0.06) (0.09) -0.23* (0.03) (0.17) DFJBEP (0.42) 0.23 (0.64) 0.07 (0.17) (1.20) DFTBEP (0.62) (0.93) 0.71 (0.25) (1.75) DFKBEP 0.09 (0.65) (0.99) 0.79* (0.27) 0.94 (1.86) DFOBEP (0.63) 1.04 (0.96) -0.84* (0.26) (1.80) DTV 1.45 (0.58) 1.35 (0.88) 0.84* (0.24) 2.17 (1.65) R 2 Adj. R 2 F-Value Annual data Number m parentheses are standard errors, 3.* indicates significant al 90% level.

15
16
17 [1] Including Blue Fin Tuna (Thunnus thunnus). Big Eye tuna (Thunnus obesus), Yellow Fin tuna (Thunnus albacares), and Albacore (Thunnus alaunga). [2] for example [3] Since there is neither efficiency gain nor refunction in the number of parameters the number estimated, the negativity condition is not incorporated. Because the compensated demand is not an issue in this study, the linkage condition is also ignored. [4] All the quantities and prices which related to the Japanese produced tuna are from Annual Statistics in Marketing of Fishery Products, 93. Association of Agriculture and Forestry Statistics. Japan. March 95. [5] All the quantities and prices which related to imported tuna are compiled from Japan Exports & Imports Country by Country. Japan Tariff Association. [6] A model which replaces DTV by DTTEXP, the Japanese total final expenditure of the private sector, are also estimated. The result are similar to what will be provided in the next section.
Analysis of Fruit Consumption in the U.S. with a Quadratic AIDS Model
 Analysis of Fruit Consumption in the U.S. with a Quadratic AIDS Model Dawit Kelemework Mekonnen Graduate Student Department of Agricultural & Applied Economics University of Georgia, 305 Conner Hall Athens,
DERIVED DEMAND FOR FRESH CHEESE PRODUCTS IMPORTED INTO JAPAN
 PBTC 05-04 PBTC 02-6 DERIVED DEMAND FOR FRESH CHEESE PRODUCTS IMPORTED INTO JAPAN By Andreas P. Christou, Richard L. Kilmer, James A. Stearns, Shiferaw T. Feleke, & Jiaoju Ge PBTC 05-04 September 2005
Taiwan Fishery Trade: Import Demand Market for Shrimps. Bith-Hong Ling
 International Symposium Agribusiness Management towards Strengthening Agricultural Development and Trade III : Agribusiness Research on Marketing and Trade Taiwan Fishery Trade: Import Demand Market for
FACTORS DETERMINING UNITED STATES IMPORTS OF COFFEE
 12 November 1953 FACTORS DETERMINING UNITED STATES IMPORTS OF COFFEE The present paper is the first in a series which will offer analyses of the factors that account for the imports into the United States
DRY BEANS PRICES AND INCOME DISTRIBUTION IN RWANDA: A NON- PARAMETRIC ANALYSIS
 Research article DRY BEANS PRICES AND INCOME DISTRIBUTION IN RWANDA: A NON- PARAMETRIC ANALYSIS Odunga, Pius Ongoro Jaramogi Oginga Odinga University of Science and Technology (JOOUST, Kenya) Kigali Institute
U.S. Demand for Fresh Fruit Imports
 U.S. Demand for Fresh Fruit Imports Mr. Hovhannes Mnatsakanyan M.S. Student, School of Agriculture, Texas A&M University-Commerce hmnatsakany@leomail.tamuc.edu Dr. Jose A. Lopez Associate Professor of
Since the cross price elasticity is positive, the two goods are substitutes.
 Exam 1 AGEC 210 The Economics of Agricultural Business Spring 2013 Instructor: Eric Belasco Name Belasco KEY 1. (15 points, 5 points each) The following questions refer to different elasticity measures
Appendix A. Table A.1: Logit Estimates for Elasticities
 Estimates from historical sales data Appendix A Table A.1. reports the estimates from the discrete choice model for the historical sales data. Table A.1: Logit Estimates for Elasticities Dependent Variable:
OF THE VARIOUS DECIDUOUS and
 (9) PLAXICO, JAMES S. 1955. PROBLEMS OF FACTOR-PRODUCT AGGRE- GATION IN COBB-DOUGLAS VALUE PRODUCTIVITY ANALYSIS. JOUR. FARM ECON. 37: 644-675, ILLUS. (10) SCHICKELE, RAINER. 1941. EFFECT OF TENURE SYSTEMS
Chapter 3: Labor Productivity and Comparative Advantage: The Ricardian Model
 Chapter 3: Labor Productivity and Comparative Advantage: The Ricardian Model Krugman, P.R., Obstfeld, M.: International Economics: Theory and Policy, 8th Edition, Pearson Addison-Wesley, 27-53 1 Preview
MARKET ANALYSIS REPORT NO 1 OF 2015: TABLE GRAPES
 MARKET ANALYSIS REPORT NO 1 OF 215: TABLE GRAPES 1. INTRODUCTION The following text is a review of the table grapes marketing environment. This analysis is updated on a quarterly 1 basis. The interval
Recent U.S. Trade Patterns (2000-9) PP542. World Trade 1929 versus U.S. Top Trading Partners (Nov 2009) Why Do Countries Trade?
 PP542. World Trade 1929 versus U.S. Top Trading Partners (Nov 2009) Why Do Countries Trade?") PP542 Trade Recent U.S. Trade Patterns (2000-9) K. Dominguez, Winter 2010 1 K. Dominguez, Winter 2010 2 U.S. Top Trading Partners (Nov 2009) World Trade 1929 versus 2009 4 K. Dominguez, Winter 2010 3 K.
PP542 Trade Recent U.S. Trade Patterns (2000-9) K. Dominguez, Winter 2010 1 K. Dominguez, Winter 2010 2 U.S. Top Trading Partners (Nov 2009) World Trade 1929 versus 2009 4 K. Dominguez, Winter 2010 3 K.
Chapter 3. Labor Productivity and Comparative Advantage: The Ricardian Model
 hapter 3 Labor Productivity and omparative Advantage: The Ricardian Model Preview Opportunity costs and comparative advantage Production possibilities Relative supply, relative demand & relative prices
Panel A: Treated firm matched to one control firm. t + 1 t + 2 t + 3 Total CFO Compensation 5.03% 0.84% 10.27% [0.384] [0.892] [0.
![Panel A: Treated firm matched to one control firm. t + 1 t + 2 t + 3 Total CFO Compensation 5.03% 0.84% 10.27% [0.384] [0.892] [0.](/thumbs/90/101398922.jpg "Panel A: Treated firm matched to one control firm. t + 1 t + 2 t + 3 Total CFO Compensation 5.03% 0.84% 10.27% [0.384] [0.892] [0.") Online Appendix 1 Table O1: Determinants of CMO Compensation: Selection based on both number of other firms in industry that have CMOs and number of other firms in industry with MBA educated executives
Online Appendix 1 Table O1: Determinants of CMO Compensation: Selection based on both number of other firms in industry that have CMOs and number of other firms in industry with MBA educated executives
Labor Supply of Married Couples in the Formal and Informal Sectors in Thailand
 Southeast Asian Journal of Economics 2(2), December 2014: 77-102 Labor Supply of Married Couples in the Formal and Informal Sectors in Thailand Chairat Aemkulwat 1 Faculty of Economics, Chulalongkorn University
Structural Reforms and Agricultural Export Performance An Empirical Analysis
 Structural Reforms and Agricultural Export Performance An Empirical Analysis D. Susanto, C. P. Rosson, and R. Costa Department of Agricultural Economics, Texas A&M University College Station, Texas INTRODUCTION
Dietary Diversity in Urban and Rural China: An Endogenous Variety Approach
 Dietary Diversity in Urban and Rural China: An Endogenous Variety Approach Jing Liu September 6, 2011 Road Map What is endogenous variety? Why is it? A structural framework illustrating this idea An application
Preview. Introduction (cont.) Introduction. Comparative Advantage and Opportunity Cost (cont.) Comparative Advantage and Opportunity Cost
 Introduction. Comparative Advantage and Opportunity Cost (cont.) Comparative Advantage and Opportunity Cost") Chapter 3 Labor Productivity and Comparative Advantage: The Ricardian Model Preview Opportunity costs and comparative advantage A one-factor Ricardian model Production possibilities Gains from trade Wages
Chapter 3 Labor Productivity and Comparative Advantage: The Ricardian Model Preview Opportunity costs and comparative advantage A one-factor Ricardian model Production possibilities Gains from trade Wages
THE ECONOMIC IMPACT OF BEER TOURISM IN KENT COUNTY, MICHIGAN
 THE ECONOMIC IMPACT OF BEER TOURISM IN KENT COUNTY, MICHIGAN Dan Giedeman, Ph.D., Paul Isely, Ph.D., and Gerry Simons, Ph.D. 10/8/2015 THE ECONOMIC IMPACT OF BEER TOURISM IN KENT COUNTY, MICHIGAN EXECUTIVE
Preview. Introduction. Chapter 3. Labor Productivity and Comparative Advantage: The Ricardian Model
 Chapter 3 Labor Productivity and Comparative Advantage: The Ricardian Model. Preview Opportunity costs and comparative advantage A one-factor Ricardian model Production possibilities Gains from trade Wages
An Empirical Analysis of the U.S. Import Demand for Nuts
 An Empirical Analysis of the U.S. Import Demand for Nuts by Sona Grigoryan M.S. Student, College of Agricultural Sciences and Natural Resources, Texas A&M University-Commerce sgrigoryan@leomail.tamuc.edu
Senarath Dharmasena Department of Agricultural Economics Texas A&M University College Station, TX
 Consumer Demand for Nut Products in the United States: Application of Semi-parametric Estimation of Censored Quadratic Almost Ideal Demand System (C-QUAIDS) with Household-Level Micro Data Senarath Dharmasena
Comparative Analysis of Fresh and Dried Fish Consumption in Ondo State, Nigeria
 Comparative Analysis of Fresh and Dried Fish Consumption in Ondo State, Nigeria Mafimisebi, T.E. (Ph.D) Department of Agricultural Business Management School of Agriculture & Natural Resources Mulungushi
Chapter 3. Labor Productivity and Comparative Advantage: The Ricardian Model. Pearson Education Limited All rights reserved.
 Chapter 3 Labor Productivity and Comparative Advantage: The Ricardian Model 1-1 Preview Opportunity costs and comparative advantage A one-factor Ricardian model Production possibilities Gains from trade
The Demand for Wines: Variety and Region Effects
 The Demand for Wines: Variety and Region Effects Steven Buccola Lore Vander Zanden Presented at Western Agricultural Economics Association 1997 Annual Meeting July 13-16, 1997 Reno/Sparks, Nevada The Demand
Impacts of Crawfish, Catfish, and Shrimp Imports on U.S. Domestic Prices. Young-Jae Lee P. Lynn Kennedy
 Impacts of Crawfish, Catfish, and Shrimp Imports on U.S. Domestic Prices Young-Jae Lee P. Lynn Kennedy Common Market Issues Imports increasing (relatively higher marginal cost of production in U.S.) Low
An Almost Ideal Demand System Analysis of Orange and Grapefruit Beverage Consumption in the United States
 Clemson University TigerPrints All Theses Theses 12-2014 An Almost Ideal Demand System Analysis of Orange and Grapefruit Beverage Consumption in the United States Catrice Taylor Clemson University, catrict@clemson.edu
International Journal of Business and Commerce Vol. 3, No.8: Apr 2014[01-10] (ISSN: )
![International Journal of Business and Commerce Vol. 3, No.8: Apr 2014[01-10] (ISSN: )](/thumbs/86/94457514.jpg "International Journal of Business and Commerce Vol. 3, No.8: Apr 2014[01-10] (ISSN: )") The Comparative Influences of Relationship Marketing, National Cultural values, and Consumer values on Consumer Satisfaction between Local and Global Coffee Shop Brands Yi Hsu Corresponding author: Associate
The Comparative Influences of Relationship Marketing, National Cultural values, and Consumer values on Consumer Satisfaction between Local and Global Coffee Shop Brands Yi Hsu Corresponding author: Associate
Chapter 3. Labor Productivity and Comparative Advantage: The Ricardian Model
 Chapter 3 Labor Productivity and Comparative Advantage: The Ricardian Model Preview Opportunity costs and comparative advantage A one-factor Ricardian model Production possibilities Gains from trade Wages
Preview. Chapter 3. Labor Productivity and Comparative Advantage: The Ricardian Model
 Chapter 3 Labor Productivity and Comparative Advantage: The Ricardian Model Preview Opportunity costs and comparative advantage A one-factor Ricardian model Production possibilities Gains from trade Wages
Food Additive Produced by IAR Team Focus Technology Co., Ltd
 Food Additive 2012.03 Produced by IAR Team Focus Technology Co., Ltd Contents 1. 2009-2011 Chinese Citric Acid Export Data Analysis... 3 2009-2011 Major Importers of Chinese Citric Acid...4 2. 2009-2011
Red wine consumption in the new world and the old world
 Red wine consumption in the new world and the old world World red wine market is expanding. In 2012, the total red wine trade was over 32 billion dollar,most current research on wine focus on the Old World:
International Trade CHAPTER 3: THE CLASSICAL WORL OF DAVID RICARDO AND COMPARATIVE ADVANTAGE
 International Trade CHAPTER 3: THE CLASSICAL WORL OF DAVID RICARDO AND COMPARATIVE ADVANTAGE INTRODUCTION The Classical economist David Ricardo introduced the comparative advantage in The Principles of
Update to A Comprehensive Look at the Empirical Performance of Equity Premium Prediction
 Update to A Comprehensive Look at the Empirical Performance of Equity Premium Prediction Amit Goyal UNIL Ivo Welch UCLA September 17, 2014 Abstract This file contains updates, one correction, and links
Relationships Among Wine Prices, Ratings, Advertising, and Production: Examining a Giffen Good
 Relationships Among Wine Prices, Ratings, Advertising, and Production: Examining a Giffen Good Carol Miu Massachusetts Institute of Technology Abstract It has become increasingly popular for statistics
Economics 452 International Trade Theory and Policy Fall 2012
 Name FIRST EXAM Economics 452 International Trade Theory and Policy Fall 2012 WORLD TRADE 1. The United States trades (exports plus imports) the third most with a. China b. Canada c. France d. Mexico e.
Figure 1: Quartely milk production and gross value
 Million Litres Million Rands QUARTERLY DAIRY MARKET ANALYSIS BULLETIN 1 OF 215 1. INTRODUCTION The following discussion is a review of the dairy market environment. The analysis is updated on a quarterly
STA Module 6 The Normal Distribution
 STA 2023 Module 6 The Normal Distribution Learning Objectives 1. Explain what it means for a variable to be normally distributed or approximately normally distributed. 2. Explain the meaning of the parameters
STA Module 6 The Normal Distribution. Learning Objectives. Examples of Normal Curves
 STA 2023 Module 6 The Normal Distribution Learning Objectives 1. Explain what it means for a variable to be normally distributed or approximately normally distributed. 2. Explain the meaning of the parameters
Online Appendix to. Are Two heads Better Than One: Team versus Individual Play in Signaling Games. David C. Cooper and John H.
 Online Appendix to Are Two heads Better Than One: Team versus Individual Play in Signaling Games David C. Cooper and John H. Kagel This appendix contains a discussion of the robustness of the regression
Multiple Imputation for Missing Data in KLoSA
 Multiple Imputation for Missing Data in KLoSA Juwon Song Korea University and UCLA Contents 1. Missing Data and Missing Data Mechanisms 2. Imputation 3. Missing Data and Multiple Imputation in Baseline
1/17/manufacturing-jobs-used-to-pay-really-well-notanymore-e/
 http://www.washingtonpost.com/blogs/wonkblog/wp/2013/0 1/17/manufacturing-jobs-used-to-pay-really-well-notanymore-e/ Krugman s Trade Policy History Course: https://webspace.princeton.edu/users/pkrugman/wws%205
The aim of the thesis is to determine the economic efficiency of production factors utilization in S.C. AGROINDUSTRIALA BUCIUM S.A.
 The aim of the thesis is to determine the economic efficiency of production factors utilization in S.C. AGROINDUSTRIALA BUCIUM S.A. The research objectives are: to study the history and importance of grape
3. If bundles of goods A and B lie on the same indifference curve, one can assume the individual b. prefers bundle B to bundle A.
 1. Indifference curves a. are nonintersecting. b. are contour lines of a utility function. c. are negatively sloped. d. All of the above. 2. For an individual who consumes only two goods, X and Y, the
FIRST MIDTERM EXAM. Economics 452 International Trade Theory and Policy Fall 2010
 Name FIRST MIDTERM EXAM Economics 452 International Trade Theory and Policy Fall 2010 WORLD TRADE 1. Which of the following is NOT one of the three largest trading partners of the United States? a. China
THE ECONOMICS OF TEA AND COFFEE CONSUMPTION IN AUSTRALIA
 THE ECONOMICS OF TEA AND COFFEE CONSUMPTION IN AUSTRALIA by M.A.B.. Siddique DISCUSSION PAPER 90.15 JULY 1990 ISSN 0811-6067 ISBN 0-86422-622-5 2 TABLE OF CONTENTS 1. Introduction 3 2. The Basic Data 4
and the World Market for Wine The Central Valley is a Central Part of the Competitive World of Wine What is happening in the world of wine?
 The Central Valley Winegrape Industry and the World Market for Wine Daniel A. Sumner University it of California i Agricultural l Issues Center January 5, 211 The Central Valley is a Central Part of the
Preview. Introduction. Chapter 3. Labor Productivity and Comparative Advantage: The Ricardian Model
 Chapter 3 Labor Productivity and Comparative Advantage: The Ricardian Model 1-1 Preview Opportunity costs and comparative advantage A one-factor Ricardian model Production possibilities Gains from trade
Economics 452 International Trade Theory and Policy Fall 2013
 Name FIRST EXAM Economics 452 International Trade Theory and Policy Fall 2013 WORLD TRADE 1. Approximately what percent of all world production of goods and services is exported to other countries? a.
Monthly Economic Letter
 Monthly Economic Letter Cotton Market Fundamentals & Price Outlook RECENT PRICE MOVEMENT NY futures experienced volatility recently, with the net effect being a slight increase in prices. The A Index also
ICC September 2018 Original: English. Emerging coffee markets: South and East Asia
 ICC 122-6 7 September 2018 Original: English E International Coffee Council 122 st Session 17 21 September 2018 London, UK Emerging coffee markets: South and East Asia Background 1. In accordance with
Consistently higher production and more exportable supplies from Thailand are major factors in the decline in world rice prices in 2014 and continued
 Rice Consistently higher production and more exportable supplies from Thailand are major factors in the decline in world rice prices in 2014 and continued lower levels over the next ten years. Part of
Derived Demand for Disaggregated Cheese Products Imported Into Japan
 Derived Demand for Disaggregated Cheese Products Imported Into Japan Andreas P. Christou Food and Resource Economics Department, Institute of Food and Agricultural Sciences, University of Florida, Gainesville,
Presentation from the USDA Agricultural Outlook Forum 2017
 Presentation from the USDA Agricultural Outlook Forum 2017 United States Department of Agriculture 93 rd Annual Agricultural Outlook Forum A New Horizon: The Future of Agriculture February 23-24, 2017
Monthly Economic Letter
 Monthly Economic Letter Cotton Market Fundamentals & Price Outlook RECENT PRICE MOVEMENT After some upward movement in April, most benchmark prices turned lower in early May. After climbing to the upper
Overview of the Manganese Industry
 39th Annual Conference Istanbul, Turkey 2013 Overview of the Manganese Industry International Manganese Institute Alberto Saavedra Market Research Manager June, 2013 Introduction Global Production Supply,
Chapter 1: The Ricardo Model
 Chapter 1: The Ricardo Model The main question of the Ricardo model is why should countries trade? There are some countries that are better in producing a lot of goods compared to other countries. Imagine
Problem Set #15 Key. Measuring the Effects of Promotion II
 Problem Set #15 Key Sonoma State University Business 580-Business Intelligence Dr. Cuellar Measuring the Effects of Promotion II 1. For Total Wine Sales Using a Non-Promoted Price of $9 and a Promoted
Vegetable Imports Approaching 20% of Total
 Vegetable Imports Approaching 20% of Total Domestic Supply The taste of imported vegetables has become more familiar to the palates of Japanese consumers in recent years. According to the Ministry of Finance,
QUARTELY MAIZE MARKET ANALYSIS & OUTLOOK BULLETIN 1 OF 2015
 QUARTELY MAIZE MARKET ANALYSIS & OUTLOOK BULLETIN 1 OF 2015 INTRODUCTION The following discussion is a review of the maize market environment. The analysis is updated on a quarterly 1 basis and the interval
Preview. Introduction. Chapter 3. Labor Productivity and Comparative Advantage: The Ricardian Model
 Chapter 3 Labor Productivity and Comparative Advantage: The Ricardian Model Copyright 2012 Pearson Addison-Wesley. All rights reserved. Preview Opportunity costs and comparative advantage A one-factor
WORLD OILSEEDS AND PRODUCTS
 WORLD OILSEEDS AND PRODUCTS 218 / World Oilseeds and Products: FAPRI 2004 Agricultural Outlook World Soybean and Soybean Products The world soybean price climbed strongly in 2003/04, driven by robust demand
Appendix A. Table A1: Marginal effects and elasticities on the export probability
 Appendix A Table A1: Marginal effects and elasticities on the export probability Variable PROP [1] PROP [2] PROP [3] PROP [4] Export Probability 0.207 0.148 0.206 0.141 Marg. Eff. Elasticity Marg. Eff.
Economic Role of Maize in Thailand
 Economic Role of Maize in Thailand Hnin Ei Win Center for Applied Economics Research Thailand INTRODUCTION Maize is an important agricultural product in Thailand which is being used for both food and feed
FIRST MIDTERM EXAM. Economics 452 International Trade Theory and Policy Spring 2011
 Name FIRST MIDTERM EXAM Economics 452 International Trade Theory and Policy Spring 2011 WORLD TRADE 1. What is true for the United States with most of its largest trading partners? a. Trade balance is
Economic Contributions of the Florida Citrus Industry in and for Reduced Production
 Economic Contributions of the Florida Citrus Industry in 2014-15 and for Reduced Production Report to the Florida Department of Citrus Alan W. Hodges, Ph.D., Extension Scientist, and Thomas H. Spreen,
DETERMINANTS OF GROWTH
 POLICY OPTIONS AND CHALLENGES FOR DEVELOPING ASIA PERSPECTIVES FROM THE IMF AND ASIA APRIL 19-20, 2007 TOKYO DETERMINANTS OF GROWTH IN LOW-INCOME ASIA ARI AISEN INTERNATIONAL MONETARY FUND Paper presented
What does radical price change and choice reveal?
 What does radical price change and choice reveal? A project by YarraValley Water and the Centre for Water Policy Management November 2016 CRICOS Provider 00115M latrobe.edu.au CRICOS Provider 00115M Objectives
Monthly Economic Letter
 Monthly Economic Letter Cotton Market Fundamentals & Price Outlook RECENT PRICE MOVEMENT After falling in the days surrounding the release of last month s USDA report, NY futures and the A Index were mostly
DEVELOPMENTS IN TURKISH STEEL INDUSTRY AND OUTLOOK
 DEVELOPMENTS IN TURKISH STEEL INDUSTRY AND OUTLOOK Dr. Veysel YAYAN Secretary General Turkish Iron and Steel Producers Association OECD Steel Commitee Meeting 17-18 May 2007, İstanbul 1 Crude steel production
Valuation in the Life Settlements Market
 Valuation in the Life Settlements Market New Empirical Evidence Jiahua (Java) Xu 1 1 Institute of Insurance Economics University of St.Gallen Western Risk and Insurance Association 2018 Annual Meeting
Gasoline Empirical Analysis: Competition Bureau March 2005
 Gasoline Empirical Analysis: Update of Four Elements of the January 2001 Conference Board study: "The Final Fifteen Feet of Hose: The Canadian Gasoline Industry in the Year 2000" Competition Bureau March
The Development of the Pan-Pearl River Delta Region and the Interaction Between the Region and Taiwan
 The Development of the Pan-Pearl River Delta Region and the Interaction Between the Region and Taiwan LIN, Yuh Jiun Associate Research Fellow, Mainland China Division, CIER This paper is divided into five
Table A.1: Use of funds by frequency of ROSCA meetings in 9 research sites (Note multiple answers are allowed per respondent)
") Appendix Table A.1: Use of funds by frequency of ROSCA meetings in 9 research sites (Note multiple answers are allowed per respondent) Daily Weekly Every 2 weeks Monthly Every 3 months Every 6 months Total
Appendix Table A.1: Use of funds by frequency of ROSCA meetings in 9 research sites (Note multiple answers are allowed per respondent) Daily Weekly Every 2 weeks Monthly Every 3 months Every 6 months Total
THIS REPORT CONTAINS ASSESSMENTS OF COMMODITY AND TRADE ISSUES MADE BY USDA STAFF AND NOT NECESSARILY STATEMENTS OF OFFICIAL U.S.
 THIS REPORT CONTAINS ASSESSMENTS OF COMMODITY AND TRADE ISSUES MADE BY USDA STAFF AND NOT NECESSARILY STATEMENTS OF OFFICIAL U.S. GOVERNMENT POLICY Required Report - public distribution Date: GAIN Report
United States Sugar Trade
 University Avenue Undergraduate Journal of Economics Volume 8 Issue 1 Article 5 2003 United States Sugar Trade Jeremy R. Meiners Illinois State University Recommended Citation Meiners, Jeremy R. (2003)
Zeitschrift für Soziologie, Jg., Heft 5, 2015, Online- Anhang
 I Are Joiners Trusters? A Panel Analysis of Participation and Generalized Trust Online Appendix Katrin Botzen University of Bern, Institute of Sociology, Fabrikstrasse 8, 3012 Bern, Switzerland; katrin.botzen@soz.unibe.ch
INTERNATIONAL DAIRY PRODUCTS COUNCIL. Reply to Questionnaire 4. Australia (1988/89) I. Milk. A. Production and Utilization of Milk
 I. Milk. A. Production and Utilization of Milk") GENERAL AGREEMENT ON TARIFFS AND TRADE ACCORD GENERAL SUR LES TARIFS DOUANIERS ET LE COMMERCE ACUERDO GENERAL SOBRE ARANCELES ADUANEROS Y COMERCIO RESTRICTED DPC/STAT/12/Add.20 29 September 198 9 International
GENERAL AGREEMENT ON TARIFFS AND TRADE ACCORD GENERAL SUR LES TARIFS DOUANIERS ET LE COMMERCE ACUERDO GENERAL SOBRE ARANCELES ADUANEROS Y COMERCIO RESTRICTED DPC/STAT/12/Add.20 29 September 198 9 International
Comparison of the OTAKE and SATAKE Rice Mills Performance on Milled Rice Quality
 Research article erd Comparison of the OTAKE and SATAKE Rice Mills Performance on Milled Rice Quality MENG BUN* Email: mengbun99@gmail.com DYNA THENG LYHOUR HIN VARY VUN SAVATH SENG Department of Agricultural
Grape Growers of Ontario Developing key measures to critically look at the grape and wine industry
 Grape Growers of Ontario Developing key measures to critically look at the grape and wine industry March 2012 Background and scope of the project Background The Grape Growers of Ontario GGO is looking
SOME ASPECTS OF FOREIGN TRADE RELATIONS
 SOME ASPECTS OF FOREIGN TRADE RELATIONS OF THE AMUR-OKHOTSK REGION S COUNTRIES MISHINA NATALIAV. Pacific Institute of Geography, Far Eastern Branch, Russian Academy of Sciences Present-day transformation
Flexible Working Arrangements, Collaboration, ICT and Innovation
 Flexible Working Arrangements, Collaboration, ICT and Innovation A Panel Data Analysis Cristian Rotaru and Franklin Soriano Analytical Services Unit Economic Measurement Group (EMG) Workshop, Sydney 28-29
Efficacy of U.S. Antidumping Duties: The Case of Freshwater Crawfish Tail Meat. Mohamed Sebaq
 Efficacy of U.S. Antidumping Duties: The Case of Freshwater Crawfish Tail Meat by Mohamed Sebaq A thesis submitted to the Graduate Faculty of Auburn University in partial fulfillment of the requirements
Internet Appendix for CEO Personal Risk-taking and Corporate Policies TABLE IA.1 Pilot CEOs and Firm Risk (Controlling for High Performance Pay)
") TABLE IA.1 Pilot CEOs and Firm Risk (Controlling for High Performance Pay) OLS regressions with annualized standard deviation of firm-level monthly stock returns as the dependent variable. A constant is
TABLE IA.1 Pilot CEOs and Firm Risk (Controlling for High Performance Pay) OLS regressions with annualized standard deviation of firm-level monthly stock returns as the dependent variable. A constant is
Chile. Tree Nuts Annual. Almonds and Walnuts Annual Report
 THIS REPORT CONTAINS ASSESSMENTS OF COMMODITY AND TRADE ISSUES MADE BY USDA STAFF AND NOT NECESSARILY STATEMENTS OF OFFICIAL U.S. GOVERNMENT POLICY Required Report - public distribution Date: GAIN Report
THE EXPORT PERFORMANCE OF INDONESIAN DRIED CASSAVA IN THE WORLD MARKET
 Agricultural Socio-Economics Journal P -ISSN: 1412-1425 Volume 17, Number 3 (2017): 134-139 E-ISSN: 2252-6757 THE EXPORT PERFORMANCE OF INDONESIAN DRIED CASSAVA IN THE WORLD MARKET Nico Adi Putra Hutabarat
Fair Trade and Free Entry: Can a Disequilibrium Market Serve as a Development Tool? Online Appendix September 2014
 Fair Trade and Free Entry: Can a Disequilibrium Market Serve as a Development Tool? 1. Data Construction Online Appendix September 2014 The data consist of the Association s records on all coffee acquisitions
ECONOMIC IMPACTS OF THE FLORIDA CITRUS INDUSTRY IN
 ECONOMIC IMPACTS OF THE FLORIDA CITRUS INDUSTRY IN 2007- Mohammad Rahmani and Alan W. Hodges Food and Resource Economics Department Institute of Food and Agricultural Sciences FLORIDA CITRUS INDUSTRY HIGHLIGHTS
Appendix Table A1 Number of years since deregulation
 Appendix Table A1 Number of years since deregulation This table presents the results of -in-s models incorporating the number of years since deregulation and using data for s with trade flows are above
Mexico Milk Cow Numbers and Milk Production per Cow,
 TABLE OF CONTENTS 1. Mexico 1.1. Mexico Milk Market Introduction 1.1.1. Dairy Market Structure and Supply Chain in Mexico 1.1.2. Mexico Cow Milk Market Production and Fluid Milk Consumption by Volume,
Nuclear reactors construction costs: The role of lead-time, standardization and technological progress
 Nuclear reactors construction costs: The role of lead-time, standardization and technological progress Lina Escobar Rangel and Michel Berthélemy Mines ParisTech - Centre for Industrial Economics CERNA
CHAPTER I BACKGROUND
 CHAPTER I BACKGROUND 1.1. Problem Definition Indonesia is one of the developing countries that already officially open its economy market into global. This could be seen as a challenge for Indonesian local
Perspective of the Labor Market for security guards in Israel in time of terror attacks
 Perspective of the Labor Market for security guards in Israel in time of terror attacks 2000-2004 By Alona Shemesh Central Bureau of Statistics, Israel March 2013, Brussels Number of terror attacks Number
The Financing and Growth of Firms in China and India: Evidence from Capital Markets
 The Financing and Growth of Firms in China and India: Evidence from Capital Markets Tatiana Didier Sergio Schmukler Dec. 12-13, 2012 NIPFP-DEA-JIMF Conference Macro and Financial Challenges of Emerging
The Japanese Market for Oranges
 United States Department of Agriculture FTS-33-1 March 28 A Report from the Economic Research Service The Japanese Market for Oranges www.ers.usda.gov Hiroshi Mori, John Dyck, Susan Pollack, and Kimiko
Test Bank for Intermediate Microeconomics and Its Application with CourseMate 2 Semester Printed Access Card 12th edition by Nicholson and Snyder
 Test Bank for Intermediate Microeconomics and Its Application with CourseMate 2 Semester Printed Access Card 12th edition by Nicholson and Snyder Link download Test Bank for Intermediate Microeconomics
Tanzania. Coffee Annual. Tanzania Coffee Annual Report
 THIS REPORT CONTAINS ASSESSMENTS OF COMMODITY AND TRADE ISSUES MADE BY USDA STAFF AND NOT NECESSARILY STATEMENTS OF OFFICIAL U.S. GOVERNMENT POLICY Required Report - public distribution Date: GAIN Report
International Table Grape Symposium November 2014 Australian Table Grapes Jeff Scott Chief Executive Officer
 International Table Grape Symposium November 2014 Australian Table Grapes Jeff Scott Chief Executive Officer Australian Table Grape Industry - Snapshot There are approximately 900 table grape growers throughout
THIS REPORT CONTAINS ASSESSMENTS OF COMMODITY AND TRADE ISSUES MADE BY USDA STAFF AND NOT NECESSARILY STATEMENTS OF OFFICIAL U.S.
 THIS REPORT CONTAINS ASSESSMENTS OF COMMODITY AND TRADE ISSUES MADE BY USDA STAFF AND NOT NECESSARILY STATEMENTS OF OFFICIAL U.S. GOVERNMENT POLICY Voluntary - Public Date: 4/24/2013 GAIN Report Number:
Learning Connectivity Networks from High-Dimensional Point Processes
 Learning Connectivity Networks from High-Dimensional Point Processes Ali Shojaie Department of Biostatistics University of Washington faculty.washington.edu/ashojaie Feb 21st 2018 Motivation: Unlocking