DG AGRI DASHBOARD: WINE. EU Prices. Production. EU Trade. Consumption. Last update: Place of Consumption. Stocks Jan 2015.
|
|
|
- Karin Wilkerson
- 6 years ago
- Views:
Transcription

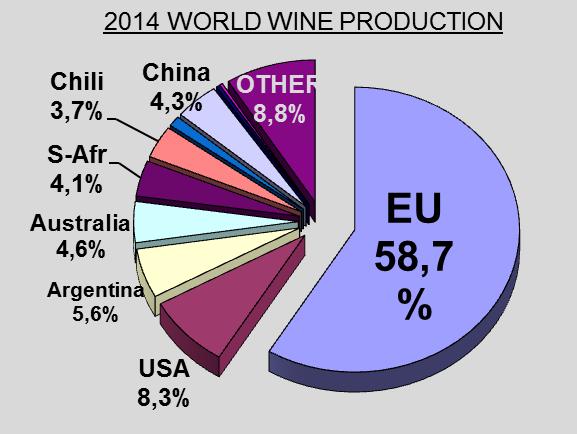
 60 000 50 000 Wine Must Production by MS (1000 Hl) 180 000 150 000 EU-28 Wine Production (1000Hl) Non Vinified Chili 3,7% 2014 WORLD WINE PRODUCTION China 4,3%")

 France Italy Germany Spain United Kingdom NMS")
1 EU Prices EU Trade Production Consumption DG AGRI DASHBOARD: WINE Stocks Last update: EVOLUTION OF BASIC RED WINE PRICES Eur/ Vol/Hl Jan 2016 Dec 2015 Jan FRANCE 6,10 1,50% -4,24% 10,42% ITALY 3,44-0,54% -2,15% -14,15% SPAIN 2,93 2,09% 6,55% -8,36% EU-28 Wine Must Production (1000 Hl) Wine Must Production by MS (1000 Hl) EU-28 Wine Production (1000Hl) Non Vinified Chili 3,7% 2014 WORLD WINE PRODUCTION China 4,3% OTHER 8,8% Italy France Spain Other MS Autres Vins Cépage sans AOP/IGP Vins I.G.P. Vins A.O.P. S-Afr 4,1% Australia 4,6% Argentina 5,6% USA 8,3% EU 58,7% Human Consumption (1000 Hl) France Italy Germany Spain United Kingdom NMS Place of Consumption Local Consumption 50 % Transformed 9% Extra EU 13% Intra Eu 28% Opening Stocks by MS (1000 hl) FR IT ES DE PT NMS AT EL Opening Stocks by Category (1000 Hl) Other VAR PGI PDO at TRADE CN2204 Wine EU28 exports (1000Hl) Other Origines United States Russian Federation China Canada Switzerland CN2204 Wine EU28 imports (1000Hl) Australia Chile 3000 South Africa United States 2000 Other Origines 1000 Argentina New Zealand CN2204 Wine EU28 exports Mio Eur Other Origines United States Switzerland Japan Canada China Russian Federation EU28 Wine trade balance (Mio Eur) Sparkling Bottled Bulk Sources: Member State communicationsaccording Art.19 of Regulation (EU) 436/2009, OIV elements de conjoncture mondiale 2014 & Eurostat COMEXT Trade database

2 / VoL/HL Jan 2016 Dec 2015 Jan year avg France 6,10 6,01 1,50% 6,37-4,24% 5,52 10,42% Italy 3,44 3,46-0,54% 3,52-2,15% 4,01-14,15% Spain 2,93 2,87 2,09% 2,75 6,55% 3,20-8,36% Source: Price calculations elaborated by DG AGRI C2 based on FranceAgrimer, La semana vitivinícola, Il corriere vinicolo publications Page 2
3 Page Source: Franceagrimer communication following Art of Regulation (EU) 2009/436, elaborated by DG AGRI C2 3
 2009/436, elaborated by DG")
4 Page Source: Magrama communication following Art of Regulation (EU) 2009/436, elaborated by DG AGRI C2 4
5 Page Source: MiPAAF communication following Art of Regulation (EU) 2009/436, elaborated by DG AGRI C2 5
6 Total EU-28 Wine Must Production Hl Page Source: Member state communication following Art. 19 1a,b of Regulation (EU) 2009/436, elaborated by DG AGRI C2 DATA 6


7 Source: Member state communication following Art. 19 1a,b of Regulation (EU) 2009/436, elaborated by DG AGRI C2 Vinified production Graph 7


8 Source: Member state communication following Art. 19 1a,b of Regulation (EU) 2009/436, elaborated by DG AGRI C2 Total production Graph 8
 2009/436, elaborated by DG AGRI C2")
9 Page Source: Member state communication following Art. 19 1a,b of Regulation (EU) 2009/436, elaborated by DG AGRI C2 DATA 9
 2009/436, elaborated by DG AGRI C2")
10 Page Source: Member state communication following Art. 19 1a,b of Regulation (EU) 2009/436, elaborated by DG AGRI C2 DATA 10
11 Page 11
 2009/436, elaborated by DG AGRI")
12 Source: Member state communication following Art. 19 1a,b of Regulation (EU) 2009/436, elaborated by DG AGRI C2 Page 12
 2009/436, elaborated by DG AGRI")
13 Source: Member state communication following Art. 19 1ab of Regulation (EU) 2009/436, elaborated by DG AGRI C2 Page 13
14 Opening Stocks by vintage year by MS (1000 hl) FR IT ES DE PT NMS AT EL Page Source: Member state communication following Art. 19 1b of Regulation (EU) 2009/436, elaborated by DG AGRI C2 DATA 14
 2009/436, elaborated by DG AGRI")
15 Source: Member state communication following Art. 19 1b of Regulation (EU) 2009/436, elaborated by DG AGRI C2 Graph 15
 2009/436, elaborated by DG AGRI C2")
16 Page Source: Member state communication following Art. 19 1b of Regulation (EU) 2009/436, elaborated by DG AGRI C2 DATA 16
 2009/436, elaborated by DG AGRI")
17 Source: Member state communication following Art. 19 1b of Regulation (EU) 2009/436, elaborated by DG AGRI C2 Graph 17
18 7 000 Evolution of CN2204 Wine exports from EU28 in volume (Hl) Other Origines United States Russian Federation China Canada Switzerland Japan Page Source: EC-EUROSTAT COMEXT external trade DataBases, elaborated by DG AGRI C2 DATA 18
19 CN2204 WINE EXPORT Evolution 1000 HL CN2004 in HL Canada Switzerland Japan Russian Federation China United States Other Origines Source: EC-EUROSTAT COMEXT external trade DataBases, elaborated by DG AGRI C2 Full report Graph 19
20 Evolution of CN2204 Wine imports into EU28 in volume (1000 Hl) Australia Chile South Africa United States Other Origines Argentina New Zealand Page Source: EC-EUROSTAT COMEXT external trade DataBases, elaborated by DG AGRI C2 DATA 20
21 CN2204 WINE IMPORT Evolution 1000 HL CN2004 in HL Australia Chile South Africa United States Argentina New Zealand Other Origines Source: EC-EUROSTAT COMEXT external trade DataBases, elaborated by DG AGRI C2 Full report Graph 21
22 3 500 Evolution of CN2204 Wine exports from EU28 in value (Mio Eur) Other Origines United States Switzerland Japan Canada China Russian Federation Page Source: EC-EUROSTAT COMEXT external trade DataBases, elaborated by DG AGRI C2 DATA 22
23 CN2204 WINE EXPORT Evolution Mio Eur CN2004 in MIO Canada Switzerland Japan Russian Federation China United States Other Origines Source: EC-EUROSTAT COMEXT external trade DataBases, elaborated by DG AGRI C2 Full report Graph 23
24 Evolution of CN2204 Wine imports into EU28 in value (Mio Eur) Australia Chile South Africa United States New Zealand Argentina Other Origines Source: EC-EUROSTAT COMEXT external trade DataBases, elaborated by DG AGRI C2 Page DATA 24

25 CN2204 WINE IMPORT Evolution Mio Eur CN2004 in MIO Australia Chile South Africa United States Argentina New Zealand Other Origines Source: EC-EUROSTAT COMEXT external trade DataBases, elaborated by DG AGRI C2 Full report Graph 25
26 EU28 trade balance ( Mio Eur) Sparkling Bottled Bulk Source: EC-EUROSTAT COMEXT external trade DataBases, elaborated by DG AGRI C2 Page 26
% of Reference Price 190% Jan Feb Mar Apr May Jun Jul Aug Sep Oct Nov Dec Beef & Veal Production (E28 Slaughtering) - Tonnes
 - Tonnes") Trade Prices Production Production & Stocks DG AGRI DASHBOARD: BEEF AND VEAL Last update: 23.11217 Carcasse Live Animals 2.2% 9.3% -6.3% -4.% -1.9% -6.2% 5.2% /1 kg Tonnes cw /head /kg 14.2% 1.1% -1.7%
Trade Prices Production Production & Stocks DG AGRI DASHBOARD: BEEF AND VEAL Last update: 23.11217 Carcasse Live Animals 2.2% 9.3% -6.3% -4.% -1.9% -6.2% 5.2% /1 kg Tonnes cw /head /kg 14.2% 1.1% -1.7%
EU COP balance sheets 2014/2015 and forecasts 2015/16. AGRI C 4 22 September 2015
 EU COP balance sheets 2014/2015 and forecasts 2015/16 AGRI C 4 22 September 2015 2014/2015 Marketing Year Cereals 2 EU TRADE 2014/2015 EU net exporter 1. + Common wheat export new record : 1. - Russian
The state of the European GI wines sector: a comparative analysis of performance
 The state of the European GI wines sector: a comparative analysis of performance Special Report November 2017 1. Overview of a growing global wine market Wine is one of the most globalised products. The
Value of production of agricultural products and foodstuffs, wines, aromatised wines and spirits protected by a geographical indication (GI)
") Value of production of agricultural products and foodstuffs, wines, aromatised wines and spirits protected by a geographical indication (GI) TENDER N AGRI 2011 EVAL 04 Executive summary October 2012 Authors:
Value of production of agricultural products and foodstuffs, wines, aromatised wines and spirits protected by a geographical indication (GI) TENDER N AGRI 2011 EVAL 04 Executive summary October 2012 Authors:
EU Cereals Trade 2017/18 Marketing Year July - March. AGRI G 4 Committee for the Common Organisation of Agricultural Markets 31 May 2018
 EU Cereals Trade 217/18 Marketing Year July - March AGRI G 4 Committee for the Common Organisation of Agricultural Markets 31 May 218 Content 1. EU trade data for total cereals 2. EU trade data for soft
Handbook for Wine Supply Balance Sheet. Wines
 EUROPEAN COMMISSION EUROSTAT Directorate E: Sectoral and regional statistics Unit E-1: Agriculture and fisheries Handbook for Wine Supply Balance Sheet Wines Revision 2015 1 INTRODUCTION Council Regulation
2018 World Vitiviniculture Situation. OIV Statistical Report on World Vitiviniculture
 2018 World Vitiviniculture Situation OIV Statistical Report on World Vitiviniculture Introduction This report has been prepared by the Statistics department of the International Organisation of Vine and
Cereals, Oilseeds and Protein Crops. Market Situation. CROPS Market Observatory 12 th April 2018
 Cereals, Oilseeds and Protein Crops Market Situation CROPS Market Observatory 12 th April 2018 CONTENTS EU market situation Cereals Oilseeds Protein crops Cereals EU Soft Wheat Exports and Imports (July-December)
EU Cereals Trade 2014/15 Marketing Year July - June. AGRI C 4 Committee for the Common Organisation of Agricultural Markets 27 August 2015
 EU Cereals Trade Marketing Year July - June AGRI C 4 Committee for the Common Organisation of Agricultural Markets 27 August 215 mio t 6 5 4 3 EU 28 - Cereals exports and imports from 2/1 to including
Wine Intelligence for Vinisud
 Wine Intelligence for Vinisud Economic observatory of Mediterranean wines in international markets 19 th February 2018 Wine Intelligence 2018 1 I. Objectives and methodology II. Focus on the market (production
World vitiviniculture situation
 World vitiviniculture situation Surface area Grape Wine Global grape production Production Consumption Trade 2016 FAO-OIV Focus: Table and Dried Grapes 2 Global area under vines Area under vines in the
Fruit & vegetable preparations 2 558
 United States: Main Exported Agricultural products average 2008-2010 (million US 2 558 $) Bovine meat Oilcakes Pork meat Poultry meat Fruits - fresh or dried (excl. citrus) Tropical - fruits & spices Cotton
STATE OF THE VITIVINICULTURE WORLD MARKET
 STATE OF THE VITIVINICULTURE WORLD MARKET April 2015 1 Table of contents 1. 2014 VITIVINICULTURAL PRODUCTION POTENTIAL 3 2. WINE PRODUCTION 5 3. WINE CONSUMPTION 7 4. INTERNATIONAL TRADE 9 Abbreviations:
Monitoring EU Agri-Food Trade: Development until March 2018
 Monitoring EU Agri-Food Trade: Development until March 2018 14.000 EU28: Export to Extra-EU of Agri-Food Products 13.000 12.000 11.000 10.000 2018 2017 2015 2016 2014 9.000 8.000 7.000 6.000 Jan Feb Mar
World vitiviniculture situation
 World vitiviniculture situation Surface area Grape Wine Global grape production Table and dried grapes Production Consumption Trade 2017 OIV Focus: Vine varietal distribution in the world 2 Global area
AGRI-FOOD TRADE STATISTICAL FACTSHEET. European Union - OECD (excl EU incl US Virgin Isl)
") European Commission Directorate-General for Agriculture and Rural Development AGRI-FOOD TRADE STATISTICAL FACTSHEET European Union - OECD (excl EU incl US Virgin Isl) Notes to the reader: The data used
European Commission Directorate-General for Agriculture and Rural Development AGRI-FOOD TRADE STATISTICAL FACTSHEET European Union - OECD (excl EU incl US Virgin Isl) Notes to the reader: The data used
State of the Vitiviniculture World Market
 Punta del Este, November 19th, 2018 State of the Vitiviniculture World Market Jean-Marie Aurand Director General Topics Potential of viticultural production Production of grapes Production of wine Consumption
Monitoring EU Agri-Food Trade: Development until December 2016
 Monitoring EU Agri-Food Trade: Development until December 2016 EU agri-food exports at highest annual level ever: EUR 130.7 billion The annual value of EU agri-food exports in 2016 reached a new record
3.7.1 World exports and EU external trade in all products, agricultural products ( 1 ) and other products 10/01/2014 EU-27 (Mrd EUR)
 and other products 10/01/2014 EU-27 (Mrd EUR)") 3.7.1 World exports and EU external trade in all products, agricultural products ( 1 ) and other products 10/01/2014 EU-27 (Mrd EUR) 2007 2008 2009 2010 2011 2012 1 2 3 4 5 6 7 World exports ( 2 ) - All
3.7.1 World exports and EU external trade in all products, agricultural products ( 1 ) and other products 10/01/2014 EU-27 (Mrd EUR) 2007 2008 2009 2010 2011 2012 1 2 3 4 5 6 7 World exports ( 2 ) - All
Australian wine sales update
 Australian wine sales update Mark Rowley, Senior Analyst Wine Sector Intelligence June 2015 Australian supply and demand Murray Valley s key varieties Summary Billion litres Global wine supply has tightened
STATE OF THE VITIVINICULTURE WORLD MARKET
 STATE OF THE VITIVINICULTURE WORLD MARKET April 2018 1 Table of contents 1. VITICULTURAL PRODUCTION POTENTIAL 3 2. WINE PRODUCTION 5 3. WINE CONSUMPTION 7 4. INTERNATIONAL TRADE 9 Abbreviations: kha: thousands
JUL'16: 172 DEC'16: 181 JUL'17: 185 Daily volume. Euronext milling wheat futures 09/04 19/04 29/04 09/05 19/05 29/05 08/06
 Trade Weekly volume - thousand tons Total f or MY - million tons Weekly volume - thousand tons Total f or MY - million tons Weekly volume - thousand tons Total f or MY - million tons TRQs Thousand tons
EU-28: Main imported Agricultural products (average in million Euro)
") EU-28: Main imported Agricultural products (average 2011-2013 - in million Euro) Oilcakes Soyabeans Cocoa Oilseeds, other than soyabeans Raw tobacco Cereals, other than wheat and rice Beet and cane sugar
EU-28: Main imported Agricultural products (average 2011-2013 - in million Euro) Oilcakes Soyabeans Cocoa Oilseeds, other than soyabeans Raw tobacco Cereals, other than wheat and rice Beet and cane sugar
Monitoring EU Agri-Food Trade: Development until December 2015
 Monitoring EU Agri-Food Trade: Development until December 2015 December 2015 - EU agri-food exports again higher than in previous years EU agri-food exports in December 2015 achieved a value of EUR 11.2
EU Oilseeds trade 2011/12. AGRI C 5 Management Committee for the Common Organisation of Agricultural Markets 20 December 2012
 EU Oilseeds trade 2011/12 AGRI C 5 Management Committee for the Common Organisation of Agricultural Markets 20 December 2012 EU MS importing soybeans EU Soybeans imports by MS Campaign 2011-12: 11.9 mio
Monitoring EU Agri-Food Trade: Development until September 2018
 Monitoring EU Agri-Food Trade: Development until September 2018 September 2018: Slowdown in EU export performance; imports from Brazil and US still on the rise The monthly value of EU agri-food trade in
Monitoring EU Agri-Food Trade: Development until January 2016
 Monitoring EU Agri-Food Trade: Development until January 2016 January 2015 - EU agri-food exports in line with seasonal trend EU agri-food exports in January 2016 were worth EUR 9.3 billion, thus just
Dairy sector: production and exports to Russia
 Dairy sector: production and exports to Russia Summary In 2013, the EU produced close to 153 million tonnes of milk, i.e. around 20% of the world production. Close to 40% of the production takes place
Monitoring EU Agri-Food Trade: Development until November 2016
 Monitoring EU Agri-Food Trade: Development until November 2016 November 2016 EU agri-food exports again at record level The monthly value of EU agri-food exports in November 2016 reached a new record level
World Dairy Situation. IDF SC DPE, Paris April 11, 2013
 World Dairy Situation IDF SC DPE, Paris April 11, Current dairy situation Dairy production progressed in 2012 in supplying regions but is now stabilizing, even declining in some countries Export demand
PHILIPPINES. 1. Market Trends: Import Items Change in % Major Sources in %
 PHILIPPINES A. MARKET OF FRESH FRUITS & VEGETABLES 1. Market Trends: Import Items 2003 2007 Change in % Major Sources in % Value Quantity Value Quantity Value Quantity USD '000 Tons USD '000 Tons Grapes
Monitoring EU Agri-Food Trade: Development until August 2017
 Monitoring EU Agri-Food Trade: Development until August 2017 August 2017: Agri-food exports continue strong The monthly value of EU agri-food exports rose slightly to EUR 11.5 billion in August 2017, a
Weather conditions / sowings
 Trade Weekly volume - thousand tonnes Total MY - million tonnes Weekly volume - thousand tonnes Total MY - million tonnes Weekly volume - thousand tonnes Total MY - million tonnes Million tonnes Production
SEP'16: 154 MAR'17: 163 SEP'17: 173 Daily Volume. Euronext milling wheat futures 07/05 17/05 27/05 06/06 16/06 26/06 06/07
 Trade Weekly volume - thousand tonnes Total for MY - million tonnes Weekly volume - thousand tonnes Total f or MY - million tonnes Weekly volume - thousand tonnes Total f or MY - million tonnes TRQs Thousand
SEP'16: 162 MAR'17: 169 SEP'17: 176 Daily Volume. Euronext milling wheat futures 14/05 24/05 03/06 13/06 23/06 03/07 13/07
 Trade Weekly volume - thousand tonnes Total for MY - million tonnes Weekly volume - thousand tonnes Total f or MY - million tonnes Weekly volume - thousand tonnes Total f or MY - million tonnes TRQs Thousand
DEC'17: 163 MAY'18: 172 DEC'18: 177 Daily Volume. Euronext milling wheat futures 03/09 13/09 23/09 03/10 13/10 23/10 02/11
 Trade Weekly volume - thousand tonnes Total MY - million tonnes Weekly volume - thousand tonnes Total MY - million tonnes Weekly volume - thousand tonnes Total MY - million tonnes Million tonnes Production
An insight into the viticulture sector
 An insight into the viticulture sector Business Analysis Pio De Gregorio Head Luca Schianchi Senior analyst Brescia, 12 June 2015 World production of wine Billion of liters 2007 2008 2009 2010 2011 2012
An overview of the European flour milling industry. Gary SHARKEY, European Flour Millers Vice-President
 An overview of the European flour milling industry Gary SHARKEY, European Flour Millers Vice-President 24 + 5 national member associations The European flour millers on their internal market A large variety
Monitoring EU Agri-Food Trade: Development until April 2017
 Monitoring EU Agri-Food Trade: Development until April 2017 April 2017: Agri-food exports back to average values The monthly value of EU agri-food exports in April 2017 reached a value of EUR 10.6 billion,
Monitoring EU Agri-Food Trade: Development until August 2018
 Monitoring EU Agri-Food Trade: Development until August 2018 August 2018: Export performance remains stable; imports from US continue to increase The value of EU agri-food trade in the month of August
Monitoring EU Agri-Food Trade: Development until October 2018
 Monitoring EU Agri-Food Trade: Development until October 2018 October 2018: best EU agri-food export performance ever The monthly value of EU agri-food trade in October 2018 was second biggest ever recorded
and the World Market for Wine The Central Valley is a Central Part of the Competitive World of Wine What is happening in the world of wine?
 The Central Valley Winegrape Industry and the World Market for Wine Daniel A. Sumner University it of California i Agricultural l Issues Center January 5, 211 The Central Valley is a Central Part of the
Comparison across international sources of the value of exports for top 25 countries, 1992 (US$ billion )
") Table 1 Comparison across international sources of the value of exports for top 25 countries, 1992 (US$ billion ) FAO WB IFS UN WB b.o.p. United States 448.2 448.0 448.2 444.2 440.4 Germany 429.7 422.0
Table 1 Comparison across international sources of the value of exports for top 25 countries, 1992 (US$ billion ) FAO WB IFS UN WB b.o.p. United States 448.2 448.0 448.2 444.2 440.4 Germany 429.7 422.0
Monitoring EU Agri-Food Trade: Development until January 2018
 Monitoring EU Agri-Food Trade: Development until January 2018 January 2018: good start of a year for EU agri-food exports The value of EU agri-food exports in January 2018 kept its very high level, now
Industry Advisory Panel Item 4c Trade of Stainless Steel Scrap
 Industry Advisory Panel Item 4c Trade of Stainless Steel Scrap Lisbon Tuesday 22 April 2008 Sven Tollin Chief Statistician 1 Stainless Steel Waste & Scrap Comparison calendar with Except Kazakhstan only
Export prices FOB. Export prices FOB. $/t. Meals export prices - monthly average
 DG AGRI DASHBOARD: OILSEEDS -1% 1% % 3% -3% % -1% -1% -1% % -3% soyoil Argentina - Up River -7% sunoil Ukraine -5% canola oil EU (Rotterdam) -5% palm oil Indonesia % 4% Export prices FOB -1% % soymeal
Oilseeds and Protein Crops market situation. Committee for the Common Organisation of Agricultural Markets. 27 September 2018
 Oilseeds and Protein Crops market situation Committee for the Common Organisation of Agricultural Markets 27 September 2018 1. World Oilseeds Contents 2. EU Oilseeds & Protein crops: areas & production
SINGAPORE. Summary Table: Import of Fresh fruits and Vegetables in Fresh fruit and Vegetables Market Value $000 Qty in Tons
 SINGAPORE A. MARKET FOR FRESH FRUIT AND VEGETABLES 1. Market Trend and Opportunities Summary Table: Import of Fresh fruits and Vegetables in Fresh fruit and Vegetables Market Products/ Other Info. Product
SEP'17: 170 MAR'18: 177 SEP'18: 178 Daily Volume. Euronext milling wheat futures 04/03 14/03 24/03 03/04 13/04 23/04 03/05
 Trade Weekly volume - thousand tonnes Total MY - million tonnes Weekly volume - thousand tonnes Total MY - million tonnes Weekly volume - thousand tonnes Total MY - million tonnes Million tonnes Production
THE GLOBAL PULSE MARKETS: recent trends and outlook
 THE GLOBAL PULSE MARKETS: recent trends and outlook CICILS/IPTIC 2004 CONVENTION 10-12 12 June 2004 Beijing, China Boubaker BENBELHASSEN Commodities and Trade Division United Nations Food and Agriculture
AGRITECH WINE INDUSTRY KEY INFO IN POINTS
 AGRITECH WINE INDUSTRY KEY INFO IN 10 POINTS 1 FRANCE: 2 THE 3 HIGH-QUALITY 4 GLOBAL THE LAND OF WINE France produces more than 3,200 varieties of wine across 80 departments and 16 large vineyards (Vin
OIV Revised Proposal for the Harmonized System 2017 Edition
 OIV Revised Proposal for the Harmonized System 2017 Edition TABLE OF CONTENTS 1. Preamble... 3 2. Proposal to amend subheading 2204.29 of the Harmonized System (HS)... 4 3. Bag-in-box containers: a growing
Finnish foreign trade 2015 Figures and diagrams FINNISH CUSTOMS Statistics 1
 Finnish foreign trade 215 Figures and diagrams 8.2.216 FINNISH CUSTOMS Statistics 1 IMPORTS, EXPORTS AND TRADE BALANCE 199-215 7 billion e 6 5 4 3 2 1-1 9 91 92 93 94 95 96 97 98 99 1 2 3 4 5 6 7 8 9 1
Ex-post evaluation of the. Common Market Organisation for wine. Annex
 Ex-post evaluation of the Common Market Organisation for wine Annex Prepared for: European Commission - DG Agriculture Tender AGRI / EVALUATION / 2002 / 6 This study has been financed by the Commission
JAPANESE WINE MARKET. June Market Data Japan, June 2016, Wines of Germany, Japan
 JAPANESE WINE MARKET June 2016 1 JAPANESE WINE MARKET Japan is a growing market with 55.2 million wine drinkers and a total volume of 3,600,000hL of wine Growing wine culture Annual per capita consumption
MARKET NEWSLETTER No 93 April 2015
 Focus on OLIVE OIL IMPORT TRENDS IN RUSSIA Russian imports of olive oil and olive pomace oil grew at a constant rate between 2/1 and 213/14 when they rose from 3 62 t to 34 814 t (Chart 1). The only exceptions
Monitoring EU Agri-Food Trade: Development until March 2017
 Monitoring EU Agri-Food Trade: Development until March 2017 March 2017: record value in monthly agri-food exports at EUR 12.7 billion The monthly value of EU agri-food exports in March 2017 reached a value
MARKET NEWSLETTER No 111 December 2016
 On 1 January 2017 the new International Agreement on Olive Oil and Table Olives, 2015, came into force, being the sixth International Agreement of the Organisation. This new Agreement will allow the IOC
Monitoring EU Agri-Food Trade: Development until October 2016
 Monitoring EU Agri-Food Trade: Development until October 2016 October 2016 EU agri-food exports stabilise at high level The monthly value of EU agri-food exports in October 2016 stabilised at EUR 11.4
CASE STUDY PROCESSED ANCHOVY IN ITALY PRICE STRUCTURE IN THE SUPPLY CHAIN FEBRUARY Maritime Affairs and Fisheries
 CASE STUDY PROCESSED ANCHOVY IN ITALY PRICE STRUCTURE IN THE SUPPLY CHAIN FEBRUARY 2018 WWW.EUMOFA.EU Maritime Affairs and Fisheries Contents SUMMARY... 1 0 TASK REMINDER SCOPE AND CONTENT... 2 0.1 CASE
EU Wine production: THEORETICAL YIELDS (Hl/Ha.) evolution
 evolution") EU Wine production: THEORETICAL YIELDS (Hl/Ha.) evolution 2003-2007 en HA. en 1000 HL. VQPRD VQPRD 26.056 70 19.046 18.853 18.829 17.468 17.468 308 305 648 1.091 1.152 1.195 1.195 1.195 5 7 7 102.827 102.479
EU Wine production: THEORETICAL YIELDS (Hl/Ha.) evolution 2003-2007 en HA. en 1000 HL. VQPRD VQPRD 26.056 70 19.046 18.853 18.829 17.468 17.468 308 305 648 1.091 1.152 1.195 1.195 1.195 5 7 7 102.827 102.479
AGRI-FOOD TRADE STATISTICAL FACTSHEET. European Union - Australia And New Zealand
 European Commission Directorate-General for Agriculture and Rural Development AGRI-FOOD TRADE STATISTICAL FACTSHEET European Union - Australia And New Zealand Notes to the reader: The data used in this
AGRI-FOOD TRADE STATISTICAL FACTSHEET. European Union - BRICS
 European Commission Directorate-General for Agriculture and Rural Development AGRI-FOOD TRADE STATISTICAL FACTSHEET European Union - BRICS Notes to the reader: The data used in this factsheet were provided
The Italian Wine Sector
 The Italian Wine Sector 28 Feb 2017 The Italian wine sector is the world s largest wine producer and its second largest exporter by volume behind Spain. This paper gives an overview of wine production,
Italy. Italian Wine Overview 2017
 THIS REPORT CONTAINS ASSESSMENTS OF COMMODITY AND TRADE ISSUES MADE BY USDA STAFF AND NOT NECESSARIY STATEMENTS OF OFFICIA U.S. GOVERNMENT POICY Voluntary - Public Date: //7 GAIN Report Number: IT7 Italy
Export market trends and outlook
 Export market trends and outlook Much better! 28 th July 2017 Tim Hunt General Manager Food & Agribusiness Research Rabobank Food & Agribusiness Research Rabobank s unique global team of 90 analysts supporting
Outlook for the World Coffee Market
 Outlook for the World Coffee Market International Coffee Council 26-3 September 211 London, England José Sette Executive Director a.i. ICO composite indicator price Daily: 1 October 29 to 26 September
World Beer Cup Overview
 Date and location 2012 World Beer Cup judging took place May 1-2, 2012 at the Town and Country Resort in San Diego, California. Awards were presented May 5, 2012 at the Town and Country Resort in San Diego,
OPPORTUNITIES IN THE EUROPEAN MARKET FOR SRI LANKAN FOOD & BEVERAGES
 OPPORTUNITIES IN THE EUROPEAN MARKET FOR SRI LANKAN FOOD & BEVERAGES Prepared by: Export Development Board (EDB), Sri Lanka November, 2012 CONTENTS 1. MARKET OVERVIEW... 3 2. TRENDS IN THE EUROPEAN MARKET
Wine Australia providing insights for Australian. Wine. Barossa Valley. Export Report: Bottled wine. MAT March 2018
 Wine Australia providing insights for Australian Barossa Valley Export Report: Bottled wine MAT March 2018 Wine Important reading This report provides an overview of bottled wine exports where there is
Global Wine Report SAN JOAQUIN VALLEY WINE GROWERS ASSOCIATION NOVEMBER 29, 2017 DEDICATED BROKERS IN 8 COUNTRIES
 Global Wine Report SAN JOAQUIN VALLEY WINE GROWERS ASSOCIATION NOVEMBER 29, 2017 DEDICATED BROKERS IN 8 COUNTRIES GLOBALLY BASED TO BUILD YOUR BUSINESS WORLDWIDE 1 INTRODUCTION Ciatti Co à 8 Regional Offices
Monitoring EU Agri-Food Trade: Development until June 2017
 Monitoring EU Agri-Food Trade: Development until June 2017 June 2017: Agri-food exports again above previous years level After a rebound in May, the monthly value of EU agri-food exports went down to EUR
MAR'17: 172 SEP'17: 174 MAR'18: 178 Daily Volume. Euronext milling wheat futures 24/12 03/01 13/01 23/01 02/02 12/02 22/02
 Trade Weekly volume - thousand tonnes Total MY - million tonnes Weekly volume - thousand tonnes Total MY - million tonnes Weekly volume - thousand tonnes Total MY - million tonnes Million tonnes Production
Global Considerations
 What Does Being a Global Player Mean to the U.S. Dairy Sector? Global Considerations 2 1 A Decade of Change $8, 4,5 $7, 4, (Million $) $6, $5, $4, $3, $2, $1, 3,5 3, 2,5 2, 1,5 1, 5 (Million Lbs.) $ 23
LITHUANIA MOROCCO BILATERAL TRADE
 LITHUANIA MOROCCO BILATERAL TRADE Review 2018.04.06 1 SUMMARY In 2017 the Morocco was Lithuania s 60th largest export partner and 69th largest import partner. Since 2010 Lithuania had a trade deficit with
Evaluation of Common Agricultural Policy measures applied to the wine sector
 Evaluation of Common Agricultural Policy measures applied to the wine sector COGEA S.r.l. October 2012 EVALUATION FRAMEWORK Council Regulation (EC) n 479/2008 of 29 April 2008 Council Regulation (EC) n
World wine tendencies
 World wine tendencies VITICULTURALE SURFACE World wine trends Until the end of the 70th years world's vineyards has increased steadily over 10 million hectares Early 80s: crisis of overproduction 25% decrease
Outline. Long-term Outlook for Cotton Consumption. World End-Use Consumption of Textile Fibers. World Consumption of Textile Fibers
 World Cotton Supply and Use International Cotton Advisory Committee Secretariat Outline! Long-term Outlook for Consumption! Outlook for /! Developments in World Cotton Trade Fifth Open Session: Cotton
Blow Molding Machine Produced by IAR Team Focus Technology Co., Ltd
 Blow Molding Machine 2012.08 Produced by IAR Team Focus Technology Co., Ltd Contents 1. 2009-2011 Chinese Blow Molding Machines Export Trend Analysis...3 2009-2011 Chinese Blow Molding Machines Export
What Does Being a Global Player Mean to the U.S. Dairy Sector?
 What Does Being a Global Player Mean to the U.S. Dairy Sector? Global Considerations Copyright of Daily Dairy Report, Inc. 2 A Decade of Change $8,000 4,500 $7,000 4,000 (Million $) $6,000 $5,000 $4,000
ANALYSIS ON THE STRUCTURE OF HONEY PRODUCTION AND TRADE IN THE WORLD
 ANALYSIS ON THE STRUCTURE OF HONEY PRODUCTION AND TRADE IN THE WORLD GU G., ZHANG Ch., HU F.* Department of Sericulture and Apiculture, College of Animal Science Zhejiang University, Hangzhou 310029, CHINA
Wine Australia providing insights for Australian. Wine. Eden Valley. Export Report: Bottled wine. MAT December 2016
 Wine Australia providing insights for Australian Eden Valley Export Report: Bottled wine MAT December 16 Wine Important reading This report provides an overview of bottled wine exports where there is a
EU28: Main exported Agricultural products (average in million Euro)
") EU28: Main exported Agricultural products (average 2011-2013 - in million Euro) Agricultural products Spirits and liqueurs Wine and vermouth Wheat Pork meat (fresh, chilled or frozen), w/o preparations
EU28: Main exported Agricultural products (average 2011-2013 - in million Euro) Agricultural products Spirits and liqueurs Wine and vermouth Wheat Pork meat (fresh, chilled or frozen), w/o preparations
SEP'17: 171 MAR'18: 182 SEP'18: 183 Daily Volume. Euronext milling wheat futures 20/05 30/05 09/06 19/06 29/06 09/07 19/07
 Trade Weekly volume - thousand tonnes Total MY - million tonnes Weekly volume - thousand tonnes Total MY - million tonnes Weekly volume - thousand tonnes Total MY - million tonnes Million tonnes Production
The IWSR Global LOCAL KNOWLEDGE, GLOBAL INTELLIGENCE
 2008 The IWSR Global Wine Handbook LOCAL KNOWLEDGE, GLOBAL INTELLIGENCE 2008 The IWSR Disclaimer: While at all times The IWSR tries to ensure that the information presented in the database and reports
AMAZONIA (BRAZIL) NUTS MACADAMIAS HAZELNUTS PISTACHIOS WALNUTS PINE NUTS PECANS
 NUTS MACADAMIAS HAZELNUTS PISTACHIOS WALNUTS PINE NUTS PECANS") HAZELNUTS MACADAMIAS PECANS PINE NUTS INTRODUCTION WORLD PRODUCTION PRODUCTION AND CONSUMPTION TRENDS SUPPLY VALUE ALMONDS AMAZONIA (BRAZIL) NUTS CASHEWS PISTACHIOS WALNUTS PEANUTS DATES 05 06 09 13 14
HAZELNUTS MACADAMIAS PECANS PINE NUTS INTRODUCTION WORLD PRODUCTION PRODUCTION AND CONSUMPTION TRENDS SUPPLY VALUE ALMONDS AMAZONIA (BRAZIL) NUTS CASHEWS PISTACHIOS WALNUTS PEANUTS DATES 05 06 09 13 14
CBI MARKET SURVEY THE FRESH FRUIT AND VEGETABLES MARKET IN ITALY
 CBI MARKET SURVEY THE FRESH FRUIT AND VEGETABLES MARKET IN ITALY Publication date: October 2006 Report summary This market survey presents, among other things, the following highlights for the fresh fruit
Corporate Presentation
 Corporate Presentation January 2014 1 1 / 1 million liters Wine Industry: Top 10 wine producers Global Production Decreasing 0.9% per year. 5.6% decrease in 2012. 7,000 6,000 CAGR: -2.7% CAGR: -2.1% 5,000
GLOBAL SUPPLY UPDATE GLENN PROCTOR FEBRUARY 7, 2018
 GLOBAL SUPPLY UPDATE GLENN PROCTOR FEBRUARY 7, 2018 21 DEDICATED BROKERS IN 8 COUNTRIES GLOBALLY BASED TO BUILD YOUR BUSINESS WORLDWIDE INTRODUCTION - CIATTI CO 8 REGIONAL OFFICES WORLDWIDE - WINE, GRAPES,
WINE EXPORTS. February Nadine Uren. tel:
 WINE EXPORTS February 2012 Nadine Uren tel: +27 21 807 5707 e-mail: nadine@sawis.co.za OVERVIEW OF WINE EXPORTS HIGHLIGHTS Exports as a percentage of wine production decreased from 48.5% in 2010 to 43.2%
C O R P O R AT E S T R AT E G Y U P D AT E. October, 2018
 C O R P O R AT E S T R AT E G Y U P D AT E October, 2018 FORWARD LOOKING STATEMENTS This presentation contains forward-looking statements, that should be considered as good faith estimates. Such statements
Deliveries to dairies 198/86 GENERAL AGREEMENT ON TARIFFS AND TRADE. Consurption of fresh milk (including exports) 1985/86. Industrial uses 1985/86
 1985/86. Industrial uses 1985/86") GENERAL AGREEMENT ON TARIFFS AND TRADE RESTRICTED DPC/STAT/12/Add. 14 23 September 1986 International Dairy Arrangement INTERNATIONAL DAIRY PRODUCTS Reply to Questionnaire 4 AUSTRALIA COUNCIL (Financial
GENERAL AGREEMENT ON TARIFFS AND TRADE RESTRICTED DPC/STAT/12/Add. 14 23 September 1986 International Dairy Arrangement INTERNATIONAL DAIRY PRODUCTS Reply to Questionnaire 4 AUSTRALIA COUNCIL (Financial
Milk and Milk Products: Price and Trade Update
 Milk and Milk Products: Price and Trade Update June 217 * International dairy prices The FAO Dairy Price Index averaged 29 points in June, up 16 points (8.3 percent) from January 217 and 71 points (51.5
Global sparkling wine market trends. June Peter Bailey. Manager - Market Insights. Wine Australia
 Global sparkling wine market trends June 2018 Peter Bailey Manager - Market Insights Wine Australia Presentation Outline 1. Who are the biggest sparkling wine producers? 2. Where are the biggest markets?
TRENDS IN SALES OF MILK & DAIRY PRODUCTS A RETAIL PERSPECTIVE. Milk Market Observatory 26 September 2017
 TRENDS IN SALES OF MILK & DAIRY PRODUCTS A RETAIL PERSPECTIVE Milk Market Observatory 26 September 2017 Belgium Product August 2017 vs. August 2016 Consumer Price Index Total 2016 vs. 2015 Consumer Price
Angela Mariani. University of Naples Parthenope
 Angela Mariani University of Naples Parthenope Workshop Mediterranean products in the global market Section 6: The global market for wine: issues and prospects p 17 June 2008 BRIEF COMMENTS ON THE FOLLOWING
MMO Economic Board. Milk Market Observatory. Meeting of 28 November 2017
 Milk Market Observatory Last update : 29.11.2017 MMO Economic Board Meeting of 28 November 2017 o The 24th meeting of the MMO Economic Board took place on 28/11/2017, with the participation of experts
Coffee Market Outlook
 Coffee Market Outlook 15 th Asia International Coffee Conference Ho Chi Minh City, Vietnam 7-9 December 2009 Néstor Osorio Executive Director ICO composite indicator price Monthly: January 2000 to November
Bearing Produced by IAR Team Focus Technology Co., Ltd.
 Bearing 2013.06 Produced by IAR Team Focus Technology Co., Ltd. Contents 1. Bearing Industry Exports of 2012... 3 1.1. China Bearing Industry Export Classification Tables of 2012... 3 1.2. China Ball or
Lecture 4 - Wine Market
 Lecture 4 - Market UGSCCS - Autumn 2013 WINE MARKET LECTURE STRUCTURE Section 1 Global Market WIDE RANGE OF WINE TYPES Table wines Sparkling wines Fortified wines For each type there may be a different