THUNDER BAY + AREA FOOD + AGRICULTURE MARKET STUDY SECTION PREPARED FOOD SECTOR
|
|
|
- Marylou Jacobs
- 6 years ago
- Views:
Transcription

1 THUNDER BAY + AREA FOOD + AGRICULTURE MARKET STUDY OCTOBER 2017 SECTION PREPARED FOOD SECTOR Harry Cummings and Associates 96 Kathleen St. Guelph, Ontario, N1H 4Y3 T: (519) F: (519)

2 2 THUNDER BAY + AREA FOOD + AGRICULTURE MARKET STUDY
3 3.1.1 PREPARED FOOD SECTOR INTRODUCTION The prepared food sector was the largest group involved in the Thunder Bay and Area Food and Market Study. The majority of businesses in this sector are restaurants serving eat in or take out customers on a daily basis. Each establishment is unique and ranged from an establishment with a service counter and a few tables operated by the owner and his/her family to a larger upscale restaurant serving the dinner crowd. Only two of the businesses were affiliated with provincial/national chain restaurants or chain supported fast food as these operations tend to focus on franchise food brands. In general, the restaurants have a wide variety of needs that could possibly be served by local suppliers. This ranges from the meat, potatoes and vegetables associated with a meal to herbs and greens designed to enhance the variety, taste, quality and nutrition of the meal. The interviews revealed many unique menu items requiring small amounts of local product on a weekly or twice weekly basis. We also interviewed a small number of institution based operations that prepare/provide daily meal options for large numbers of students, patients, etc. The of food required by these organizations over the course of a year is significant and there is strong interest among these organizations in sourcing/utilizing more locally grown/ harvested food items. A total of 52 businesses / organizations were interviewed from the prepared food sector. The majority of these operations (42) are businesses from the restaurant / catering sector and the balance (10) are institution based operations (education, health, government sector). The businesses in the restaurant / catering sector represent a broad cross section of newer and older establishments. Approximately half of the businesses have been in operation for five years or less while several businesses have been in operation for more than 20 years. Many of the businesses employ 10 or more individuals and collectively the businesses have over 450 employees (full-time, part-time and seasonal combined). Many of the institution based operations have been in operation for more than 30 years. They typically employ 30 or more people and one institution is a major employer in the City of Thunder Bay. Almost all of the businesses (39 of 42) and many of the institutions (7 of 10) reported that they currently buy some amount of food grown / harvested within 100km of Thunder Bay (or food products made with ingredients grown within 100km of Thunder Bay). Approximately half of the businesses/organizations reported that a key motivation for buying locally grown/ harvested food items is that it benefits the local economy (54%). Other key motivators for buying local include the belief that locally grown/harvested food items are higher quality (35%) and fresher (24%) than non-local food items (Table 2). Table 2: Motivation of businesses / organizations for buying local (n=46) Motivation for buying local Number Percent Contributes to the local economy % Local is higher quality % Local is fresher % Important to have a relationship with farmers % Promotes environmental health % Using local foods as a marketing tool 4 8.7% Customers interested / demand local food 3 6.5% Local foods are cost comparable to non-local 3 6.5% Local foods are convenient to access 2 4.3% Respondents were allowed to identify more than one motivator. OCTOBER
4 With respect to the factors that dissuade businesses/organizations from buying locally grown/harvested food items, the most common concerns identified include cost, consistency in availability and/or seasonality, consistency in food standards, and delivery / access challenges (Table 3). Table 3: Motivation of businesses / organizations for not buying local (n=31) Motivation for not buying local Number Percent High cost concerns % Consistency in availability and/or seasonality concerns % Consistency in food standards / quality concerns % Delivery / accessibility challenges % Insufficient of product % Farmers are not producing the food items they want % Decisions limited by headquarters / franchise policies 3 9.7% Raw products need to be processed further 1 3.2% Unfamiliar with supplier locations 1 3.2% Respondents were allowed to identify more than one factor. Respondents were asked if they would consider purchasing a local product of higher quality at a higher cost than a non-local product of lesser quality. Of the 41 businesses/organizations that responded to this question, 56% indicated that they would and a further 22% reported that they would with some qualifications (mainly that local items cannot be priced significantly higher than non-local food items and that local producers need to consistently deliver high quality food items). Approximately 22% reported that they were not interested in purchasing local products of higher quality at higher costs and cited doubts that local producers could compete with non-local food items on price and that local producers could not provide high quality food items on a consistent basis. Businesses/organizations were asked to identify the key characteristics they think of when looking for higher quality food items. The most common features identified include freshness and flavourful and/or appealing appearance (Table 4). Table 4: Attributes that businesses / organizations associate with higher quality food (n=36) Attributes Number Percent Freshness % Flavourful and/or appealing appearance % Chemical free / no additives % Consistent quality / standard % Highest quality / standard % Locally grown 3 8.3% Consistent availability 2 5.6% Unique food product 2 5.6% Raised ethically 1 2.8% Minimal processing 1 2.8% Good baking / cooking performance 1 2.8% Respondents were allowed to identify more than one motivator. Approximately, 67% of the businesses/organizations that reported using locally grown/harvested food items believe that local foods add value to their operation. A further 18% reported that they don t feel the use of local food items adds value to their operation and 15% are unsure. 4 THUNDER BAY + AREA FOOD + AGRICULTURE MARKET STUDY
5 Businesses/organizations were asked to share their views on what would make it easier for them to purchase local food. The most common factor identified is to offer local foods at a price that is reasonably comparable to prices being offered through distributors (46%). A substantial proportion of businesses (36%) also suggested the need for improving local food access / delivery mechanisms in Thunder Bay to make it more convenient. An important priority for businesses/organizations is to have access to consistent s of food items throughout the year (34%). In some instances, it is crucial for suppliers to provide assurances that they meet certain food standards (e.g. audit / certification process) (Table 5). Table 5: What would make it easier for your business/organization to purchase local food? (n=44) Factors Number Percent Reasonably / competitively priced foods % Improved delivery / access mechanism (e.g. direct delivery, centralized location) % Consistency of food / availability % Maintaining supply out of season % Consistency of food quality / standards % Assurance of food standards and quantity (e.g. audit process) 4 9.1% Expand / variety of local food at grocery stores 2 4.5% Reduce the amount of wasteful packing to align with internal philosophy / policies 1 2.3% Must be chemical free 1 2.3% Processing before delivery (e.g. washing, dicing) 1 2.3% Respondents were allowed to identify more than one factor. CURRENT PROCUREMENT OF LOCAL / NON-LOCAL FOOD ITEMS Businesses/organizations were invited to share details on the amounts of food items they procure/source for their operations on an annual basis. They were advised to consider items that they use in considerable quantities and that could potentially be grown / harvested in the. They were also asked to distinguish between the amounts they currently source from the (local within a 100km) and from outside the area (non-local). The following sections provide a breakdown of these characteristics by food groups (e.g. vegetables, fruits/berries, proteins/meat, dairy products, grains and oils, flours and baked goods) and additional details are provided for select food items where considerable quantities are identified. All of the amounts (weights,, units) presented in the following sections are taken directly from the businesses / organizations that were surveyed as part of this study. PROCUREMENT / USE OF VEGETABLES With respect to the annual procurement of vegetables, fresh potatoes represent the single largest vegetable commodity by weight with over 100,000kgs being sourced annually of which 63,000kgs are sourced from local producers and almost 38,000kgs are sourced from outside the area (Table 6). Most of the businesses/ organizations are sourcing fresh, whole potatoes with russet potatoes being the most common sought variety. A very small number of businesses/organizations reported that they want their potatoes peeled and in at least once case, sliced. Most of the businesses/organizations expect potatoes to be cleaned/washed and they want local potatoes to be reasonably/competitively priced with what the large distributors/wholesalers can offer. A small number of businesses/organizations indicated that they would pay 10-15% more for local potatoes compared to non-local. It was noted that some distributors offer discounts on large sales and some businesses/organizations would be interested in the same discount pricing from local producers (this generally applies to all types of fresh produce). Carrots represent the second largest vegetable commodity by weight with over 15,000kgs being sourced annually of which 6,000kgs are sourced from local producers and almost 9,000kgs are sourced from outside the area. Most of the businesses/organizations are sourcing fresh, whole carrots washed and topped. One institution reported that they source a large of processed carrots (e.g. baby, coin, diced). Most of the businesses/ OCTOBER
6 organizations expect local carrots to be reasonably/competitively priced with what the large distributors/ wholesalers can offer. A small number of businesses/organizations indicated that they would pay 10-40% more for local carrots compared to non-local. Tomatoes represent the third largest vegetable commodity by weight with almost 13,000kgs being sourced annually of which close to 4,600kgs are sourced from local producers and over 8,300kgs are sourced from outside the area. Most of the businesses/organizations are sourcing fresh, whole tomatoes representing a range of tomato varieties including hothouse, beefsteak, Roma, cherry and field tomatoes. Several businesses/organizations reported that they source canned tomatoes in addition to fresh tomatoes. Most of the businesses/organizations expect local tomatoes to be reasonably/competitively priced with what the large distributors/wholesalers can offer. A small number of businesses/organizations indicated that they would pay % more for local tomatoes compared to non-local. There is considerable interest in high quality, flavourful tomatoes. Onions represent the fourth largest vegetable commodity by weight with over 9,900kgs being sourced annually of which just over 900kgs are sourced from local producers and almost 9,000kgs are sourced from outside the area. Most of the businesses/organizations are sourcing fresh, whole white / yellow / red onions. Several institutions are also sourcing diced frozen onions. Most of the businesses/organizations expect local onions to be reasonably/ competitively priced with what the large distributors/wholesalers can offer. A small number of businesses/ organizations indicated that they would pay 5-20% more for local onions compared to non-local. Various fresh lettuces / leafy greens are also being procured annually in sizable amounts. Almost 7,700kgs of spring mix greens are procured annually of which 2,000kgs are sourced from local producers and 5,600kgs are sourced from outside the area. Additionally, over 6,000 heads of iceberg lettuce, 6,000 heads of leafy lettuce and 11,000 heads of Romaine lettuce are procured annually with no to limited local procurement taking place for these commodities. Most of the businesses/organizations expect local lettuces to be reasonably/competitively priced with what the large distributors/wholesalers can offer. A small number of businesses/organizations indicated that they would pay 30-40% more for local spring mix greens, 5-30% more for local Romaine lettuce, and 10-20% more for local leafy lettuce compared to non-local. Businesses/organizations expect fresh lettuces to be unspoiled, clean and free of pest/insects and additionally in the case of spring mixes, most operations want this product to washed (in some cases they require triple washed). 6 THUNDER BAY + AREA FOOD + AGRICULTURE MARKET STUDY
7 Table 6: Amount of vegetables used by businesses / organizations in the prepared food sector Vegetables Total annual amount used Amount sourced locally Potatoes 101,297 63,520 37,777 kgs Frozen fries 7, ,855 kgs Carrots 15,225 6,324 8,901 kgs Frozen sliced carrots, string beans 1, ,636 kgs Onions 9, ,980 kgs Tomatoes 12,954 4,599 8,355 kgs English cucumber 8,703 4,671 4,032 units Bell peppers 2,796 2, kgs Spring mix greens 7,698 2,078 5,621 kgs Romaine lettuce 11, ,304 heads Iceberg lettuce 6, ,861 heads Kale kgs Leaf lettuce 6,138 1,125 5,013 heads Spinach kgs Napa cabbage 2, ,632 heads Cabbage 4,861 2,547 2,315 heads Broccoli 3, ,124 kgs Cauliflower heads Beets 3,250 1,182 2,068 kgs Zucchini kgs Celery bunches Rhubarb kgs Parsley 1, ,092 bunches Cilantro kgs Basil kgs Garlic kgs Mushrooms 1,234 1, kgs Businesses/organizations were invited to share details on vegetable product preferences related to packaging and processing. In general, the greatest demand is for fresh, whole vegetables. With respect to packaging preferences, the following specifications/units were most commonly identified: Whole potatoes washed: 22.5kg bag, 10kg bag, 2.3kg bag Whole carrots washed, topped: 22.5kg bag/box, 2.3kg bag Frozen, semi-processed carrots diced: no unit specified Whole onions clean of dirt: 22.5kg bag Frozen, semi-processed onions diced: no unit specified Whole tomatoes washed: 5kg case/flat Cucumbers washed: 12 per case Spring mix lettuce washed (in some cases triple washed): 1.5kg case/bag, 1kg bag Iceberg lettuce clean of dirt: 12 per case Romaine lettuce clean of dirt: 12 per case Beets clean of dirt: 11k bag OCTOBER
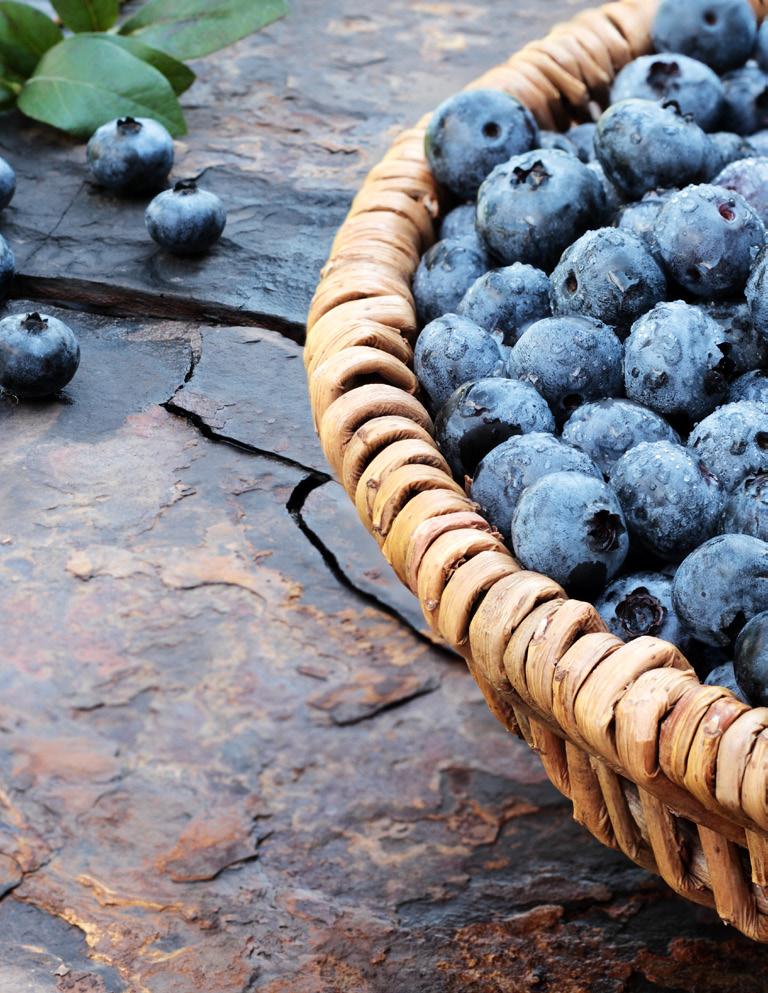
8 PROCUREMENT / USE OF FRUITS AND BERRIES With respect to the annual procurement of fruit, fresh and processed apples represent the single largest fruit commodity by weight with over 6,000kgs of fresh applies being sourced annually none of which is sourced from local producers (Table 7). Most of the businesses/organizations want local apples to be unblemished and reasonably/competitively priced with what the large distributors/wholesalers can offer. A small number of businesses/organizations indicated that they could accept blemished apples for use in baking and juicing. With respect to berries, strawberries represent the largest berry commodity by weight with over 5,200kgs being sourced annually of which 960kgs are sourced from local producers and over 4,200kgs are sourced from outside the area. Blueberries represent the second largest berry commodity by weight with close to 4,000kgs being sourced annually of which 960kgs are sourced from local producers and over 3,000kgs are sourced from outside the area. There is also a considerable amount of mixed berries (e.g. raspberries, blueberries, blackberries) being sourced each year (over 2,000kgs) with almost all of this being sourced from outside the area. In general, many of the businesses/organizations source a combination of fresh and frozen berries and a small number of operations freeze local berries to extend their availability out of season. Businesses/organizations expect berries to be unspoiled and most want the local berries to be reasonably/competitively priced with what the large distributors/wholesalers can offer. Table 7: Amount of fruits / berries used by businesses / organizations in the prepared food sector Fruits / berries Total annual amount used Amount sourced locally Apples 6, ,155 kgs Apple sauce 1, ,136 kgs Apple pie filling kgs Canned fruit cocktail 5, ,200 kgs Strawberries 5, ,265 kgs Blueberries 3, ,018 kgs Raspberries kgs Mixed berries 2, ,151 kgs Businesses/organizations were invited to share details on fruit / berry product preferences related to packaging and processing. In general, the greatest demand is for fresh, whole fruit but there is also interest in frozen berries as a way of stretching their use out of season. With respect to packaging preferences, the following specifications/units were most commonly identified: Apples washed: 18kg case Strawberries clean of dirt: pints, flats Strawberries clean of dirt frozen, sliced: no unit specified Raspberries clean of dirt: pints, flats Raspberries clean of dirt, frozen: no unit specified Blueberries clean of dirt: pints, flats Blueberries clean of dirt, frozen: no unit specified Mixed berries clean of dirt: pints, flats Mixed berries clean of dirt, frozen: no unit specified PROCUREMENT / USE OF PROTEINS With respect to the annual procurement of beef products, roast beef cuts represent the single largest beef commodity by weight with over 22,000kgs being sourced annually of which 3,400kgs are sourced from local producers and almost 19,000kgs are sourced from outside the area (Table 8). Most of the businesses/ organizations are sourcing fresh meat cuts for roasts. Most of the businesses/organizations want the meat cuts to be reasonably/competitively priced with what the large distributors/wholesalers can offer. A very small number of businesses/organizations indicated that they would pay 5% more for local beef meat cuts. 8 THUNDER BAY + AREA FOOD + AGRICULTURE MARKET STUDY
9 Ground beef represents the second largest beef commodity by weight with over 15,500kgs being sourced annually of which close to 10,000kgs are sourced from local producers and almost 5,600kgs are sourced from outside the area. Most of the businesses/organizations are sourcing fresh not frozen ground beef with a general preference for medium fat and/or lean meat. Most of the businesses/organizations want the product to be reasonably/competitively priced with what the large distributors/wholesalers can offer. Only one business suggested that they would pay a premium for local ground beef (20% more) compared to non-local. Table 8: Amount of beef products used by businesses / organizations in the prepared food sector Beef Total annual amount used Amount sourced locally Ground beef 15,572 9,996 5,576 kgs Roast beef 22,286 3,423 18,864 kgs Striploin kgs Beef patties 2,862 1,592 1,270 kgs Stewing beef kgs Whole beef side 1,718 1, kgs Beef ribs 3, ,055 kgs Beef tenderloin kgs Veal 1,864 1,864 0 kgs Ground veal kgs Wieners 1, ,080 kgs With respect to the annual procurement of pork products, pork loin cuts represent the single largest pork commodity by weight with over 13,000kgs being sourced annually of which 1,000kgs are sourced from local producers and 12,000kgs are sourced from outside the area (Table 9). Most of the businesses/organizations are sourcing fresh meat cuts and want the meat cuts to be reasonably/competitively priced with what the large distributors/wholesalers can offer. Bacon represents the second largest pork commodity by weight with over 11,600kgs being sourced annually of which just 236kgs are sourced from local producers and 11,400kgs are sourced from outside the area. Most of the businesses/organizations are sourcing fresh bacon and one organization is also procuring a small amount of pre-cooked bacon. Most of the businesses/organizations want the product to be reasonably/competitively priced with what the large distributors/wholesalers can offer. Only one business suggested that they would pay a premium for bacon (10% more) compared to non-local. Table 9: Amount of pork products used by businesses / organizations in the prepared food sector Pork Total annual amount used Amount sourced locally Ground pork 4,045 4,045 0 kgs Pork loin 13,093 1,025 12,067 kgs Butt roast 2, ,718 kgs Whole pork side kgs Bacon 11, ,416 kgs Pepperoni 4, ,136 kgs Ham 2, ,539 kgs Pork sausage 6, ,036 kgs Pork ribs 1, ,136 kgs The businesses/organizations identified substantial quantities of chicken and egg products that they procure on an annual basis and all of this product currently originates from outside the. The is largely the result of there being no commercial chicken processing facilities in Thunder Bay and there are no commercial egg producers in the area (although there is a local egg distributor). OCTOBER
10 Chicken breasts represent the single largest chicken commodity by weight with over 36,000kgs being sourced annually (Table 10). The highest demand is typically for boneless breasts and there is interest in both fresh and frozen products as well as skin on and skinless products. Most of the businesses/organizations want the product to be reasonably/competitively priced with what the large distributors/wholesalers can offer. Several businesses suggested that they would pay a premium for local chicken breasts (5-10% more) compared to nonlocal. The businesses/organizations procure close 43,000 dozen eggs annually. The highest demand is typically for Grade A eggs of medium or large size. Many of the businesses/organizations source their eggs through a local commercial distributor and at least one business is exploring sourcing free range eggs through a local producer. Most of the businesses/organizations want the eggs and egg products to be reasonably/competitively priced with what the large distributors/wholesalers can offer. Several businesses suggested that they would pay a premium for local whole shell eggs (5-10% more) compared to non-local. Table 10: Amount of chicken/egg products used by businesses / organizations in the prepared food sector Chicken / eggs Total annual amount used Amount sourced locally Chicken breast 36, ,474 kgs Chicken thighs 1, ,418 kgs Chicken wings kgs Whole chickens 1, ,630 kgs Chicken diced, fingers, etc. 11, ,464 kgs Turkey 4, ,751 kgs Whole turkeys 2, ,557 kgs Eggs whole shell 42, ,850 dozen Eggs pre-cooked peeled 4, ,160 kgs Liquid eggs 26, ,212 kgs With respect to the annual procurement of fish products, salmon represents the single largest fish commodity by weight with over 4,000kgs being sourced annually of which 800kgs are sourced from local producers and almost 3,300kgs are sourced from outside the area (Table 11). Walleye/pickerel and trout are also procured but in much smaller annual quantities. In all cases the businesses/organizations are sourcing fresh, not frozen fish and at least one business suggested that they would pay a premium for local trout (10% more) compared to non-local. Table 11: Amount of fish products used by businesses / organizations in the prepared food sector Fish Total annual amount used Amount sourced locally Trout sides kgs Walleye / pickerel fillets kgs Salmon whole 4, ,273 kgs Businesses/organizations were invited to share details on protein product preferences related to packaging and processing. In general, the greatest demand is for fresh, not frozen meat products. With respect to packaging preferences, the following specifications/units were most commonly identified: Ground beef medium-lean fat content: 5kg case Pork loin: 10kg case Bacon: 5kg case, 10kg case Whole chickens fresh and frozen: no unit specified Chicken breasts fresh and frozen, skinless, boneless: no unit specified Whole turkeys fresh and frozen: no unit specified Whole eggs medium-large size, Grade A: carton (12), tray (30), case (15 dozen) Fish (pickerel walleye, trout) fresh, chilled: no unit specified 10 THUNDER BAY + AREA FOOD + AGRICULTURE MARKET STUDY
11 PROCUREMENT / USE OF DAIRY PRODUCTS The businesses/organizations identified substantial quantities of fluid milk products that they procure on an annual basis but only a small proportion of this product appears to be locally sourced. It s important to note that many of the operations we spoke to are uncertain about exactly where the milk they purchase is produced and it was often assumed that the milk originates from outside the. The most common variety of milk sourced by is 2% milk with over 70,000 litres being sourced annually of which 1,800 litres are sourced from local producers and almost 69,000 litres are sourced from outside the area (Table 12). Most of the businesses/organizations want the fluid milk products to be reasonably/competitively priced with what the large distributors/wholesalers can offer. Several businesses suggested that they would pay a premium for local fluid milk products (5-10% more) compared to non-local. With respect to the annual procurement of cheese products, blended cheese products (e.g. brand specific for franchise) and mozzarella represent the largest cheese commodities by weight with a combined 35,600kgs being sourced annually and all of this product currently originates from outside the (Table 12). A variety of gouda products are also procured in large quantities and all of this appears to be sourced locally. Most of the businesses/organizations want the cheese products to be reasonably/competitively priced with what the large distributors/wholesalers can offer as this food item is normally a pricey item. Table 12: Amount of dairy products used by businesses / organizations in the prepared food sector Dairy / dairy substitute Total annual amount used Amount sourced locally Skim milk 3,744 3,744 0 litres Milk 2% 70,680 1,872 68,808 litres Milk 10% 1, ,820 litres Milk 35% 1, ,564 litres Buttermilk litres Milk combined fluid products - skim, 1%, 2%, chocolate 19, ,080 litres Butter 1, ,273 kgs Soy milk 1, ,820 litres Cheese - blended (content not specified) 17, ,960 kgs Cheese mozzarella 17, ,706 kgs Cheese gouda 2,647 2,647 0 kgs Cheese - gouda extra old 1,440 1,440 0 kgs Cheese - gouda curds 2,334 2,334 0 kgs Cheese - gouda smoked kgs Cheese cheddar 1, ,610 kgs Cheese swiss kgs Cheese feta kgs Cheese - other - brie, Havarti kgs Businesses/organizations were invited to share details on dairy product preferences related to packaging and processing. With respect to packaging preferences, the following specifications/units were most commonly identified: Fluid milk: 2 litre cartons Cheddar cheese blocks, sliced and shredded: no unit specified Gouda blocks: no unit specified Swiss cheese sliced and shredded: no unit specified Mozzarella cubed and shredded: 2kg bag OCTOBER
12 PROCUREMENT / USE OF PULSE CROPS, GRAINS & OILS With respect to the annual procurement of pulses and grains, lentils represent the single largest pulse commodity by weight with over 4,500kgs being sourced annually and rolled oats represent the single largest grain commodity by weight with over 3,400kgs being sourced annually. All of this product currently originates from outside the (Table 13). Most of the businesses/organizations want the pulse/grain products to be reasonably/competitively priced with what the large distributors/wholesalers can offer. Table 13: Amount of grain/pulse products used by businesses / organizations in the prepared food sector Grains / pulses Total annual amount used Amount sourced locally Lentils 4, ,514 kgs Oats 3, ,473 kgs Barley kgs Farro kgs Chickpeas kgs Navy beans kgs Split green peas kgs Split yellow peas kgs Quinoa kgs With respect to the annual procurement of oils, canola oil represents the single largest oil variety by with over 15,400 litres being sourced annually of which 8,300 litres are sourced from local producers and 7,000 litres are sourced from outside the area (Table 14). Most of the businesses/organizations want the oil products to be reasonably/competitively priced with what the large distributors/wholesalers can offer. Table 14: Amount of oil products used by businesses / organizations in the prepared food sector Oils Total annual amount used Amount sourced locally Vegetable oil 7, ,100 litres Canola oil 15,424 8,336 7,088 litres Olive oil litres Businesses/organizations were invited to share details on pulse / grain product preferences related to packaging and processing. In general, the greatest demand is for dried pulses / grains (no product units specified). With respect to oils, the greatest demand is for 19 litre pails of canola oil. PROCUREMENT / USE OF FLOUR AND BAKED GOODS With respect to the annual procurement of flour products, all-purpose flour represents the single largest flour commodity by weight with over 17,600kgs being sourced annually of which 530kgs are sourced from local producers and 17,000kgs are sourced from outside the area (Table 15). Most of the businesses/organizations want the all-purpose flour to be reasonably/competitively priced with what the large distributors/wholesalers can offer. Fine sifted all-purpose flour represents the second largest flour commodity by weight with almost 8,000kgs being sourced annually of which 2,300kgs are sourced from local producers and 5,600kgs are sourced from outside the area. Most of the businesses/organizations want the product to be reasonably/competitively priced with what the large distributors/wholesalers can offer. Rapid rise flour represents the third largest flour commodity by weight with 5,900kgs being sourced annually and all of this product currently originates from outside the. Most of the businesses/organizations want this product to be reasonably/competitively priced with what the large distributors/wholesalers can offer. 12 THUNDER BAY + AREA FOOD + AGRICULTURE MARKET STUDY
13 Table 15: Amount of flour products used by businesses / organizations in the prepared food sector Flour Total annual amount used Amount sourced locally Flour - all purpose 17, ,088 kgs Flour - fine sifted all purpose 7,964 2,364 5,600 kgs Flour - rapid rise 5, ,909 kgs Flour - whole wheat 2,920 2,920 0 kgs Flour semolina 2, ,340 kgs Flour rye kgs With respect to the annual procurement of baked goods, bread loaves (all varieties including white, whole wheat, rye) represent a substantial product by units with almost 18,700 loaves being sourced annually of which over 7,500 loaves are sourced from local bakers and 11,000 loaves are sourced from outside the area (Table 16). Most of the businesses/organizations want the loaves to be reasonably/competitively priced with what the large distributors/wholesalers can offer. Several businesses suggested that they would pay a premium for locally made loaves of bread (5-10% more) compared to non-local. Kaiser rolls are also procured in substantial quantities with over 17,600 rolls sourced annually and all of this product currently originates from local bakers in the. Most of the businesses/organizations want the Kaiser rolls to be reasonably/competitively priced with what the large distributors/wholesalers can offer. Several businesses suggested that they would pay a premium for locally made Kaiser rolls (5-10% more) compared to non-local. Table 16: Amount of baked goods used by businesses / organizations in the prepared food sector Baked goods Total annual amount used Amount sourced locally Kaiser rolls mixed white, whole wheat, rye 17,680 17,680 0 units Bread loaves mixed - white, whole wheat, rye 14,276 3,136 11,140 units Bread loaves rye 4,420 4,420 0 units Hot dog buns 31, ,200 units Hamburger buns 3, ,600 units Panini frozen kgs Wraps frozen kgs Businesses/organizations were invited to share details on flour product preferences related to packaging and processing. In general, the greatest demand is for flour in 10kg or 20kg bags. With respect to baked goods, there is demand for sliced and unsliced whole loaves of white, whole wheat, and rye bread (preferred packaged units of baked goods were not specified). PROCUREMENT / USE OF OTHER FOOD PRODUCTS A very small number of businesses/organizations reported on their honey and maple syrup procurement (Table 17). Businesses are very price sensitive to these commodities, especially maple syrup. One operation noted that they do not use the birch syrup that is produced locally because it does not meet their flavour needs. Preferred product units were not specified for these commodities. Table 17: Amount of other food products used by businesses / organizations in the prepared food sector Other food products Total annual amount used Amount sourced locally Honey kgs Maple syrup litres OCTOBER
14 CONCLUSIONS This sector has a varied set of requirements for local food. Reliability, dependability, quality and price are all very important. Some of the larger suppliers to this sector have adapted their deliveries and marketing to the needs of the sector. Providing menu suggestions would be an example. Personal connections are often important because of the particular needs of the business. The potential for expansion depends on the ability of the suppliers to connect with the owners/managers, to provide reliable dependable service and to have excellent/reliable communications between the business and the supplier. Where people are not purchasing locally it was often because of a past negative experience combined with an excellent relationship with a current supplier. 14 THUNDER BAY + AREA FOOD + AGRICULTURE MARKET STUDY
15
16 THUNDER BAY + AREA FOOD + AGRICULTURE MARKET STUDY OCTOBER 2017 This project was funded in part through Growing Forward 2 (GF2), a federal-provincial-territorial initiative. The Agricultural Adaptation Council assists in the delivery of GF2 in Ontario.
Providing Food Solutions.
 Meat Poultry Vegetables Potatoes Dairy Mondial Foods in Holland is one of the leading Dutch export companies working in the field of dry, fresh and frozen foods with worldwide coverage. Mondial Foods deals
Dr. Harlan Kilstein. CompletelyKeto FOR-KETO page 1 of 15. Speed Keto Shopping Lists
 G N I P P O SH S T S LI Dr. Harlan Kilstein 1-866-FOR-KETO page 1 of 15 FOR MORE SUPPORT, JOIN US AT http://completelyketo.com/support 201810155PSKSLE Copyright 2018 by Corp Table of Contents Disclaimer
The University of Georgia
 The University of Georgia Center for Agribusiness and Economic Development College of Agricultural and Environmental Sciences A Survey of Pecan Sheller s Interest in Storage Technology Prepared by: Kent
antipasto 57 cream 54 eggs 55 pastry butter 56 cream cheese 53 margarine 56 smallgoods cheese 48 dips noodles yogurt 53 fridge fridge
 fridge antipasto 57 cream 54 eggs 55 pastry 57 butter 56 cream cheese 53 margarine 56 smallgoods 58 cheese 48 dips 58 noodles 57 yogurt 53 fridge shredded mozzarella Perfect Italiano Mozzarella Cheese
The Environment on a Platter
 We are what we eat, and what we eat affects both our health and the wellbeing of the planet. The Environment on a Platter In fact, food is one of the three main culprits in the pollution of the environment,
CLEAN EATING CHALLENGE GROCERY LISTS
 CLEAN EATING CHALLENGE GROCERY LISTS You ll notice that Week 1 is a considerably bigger haul than Week 2. This is because you ll be stocking up on pantry items at the beginning, and so you won t have to
UNIVERSITY OF PLYMOUTH SUSTAINABLE FOOD PLAN
 UNIVERSITY OF PLYMOUTH SUSTAINABLE FOOD PLAN 2014 2020 Date Section Page Issue Modifications Approved (Print name) 28/03/2011 Issued. 1 First issue Procurement 09/07/2014 All All 2 Updated from original
Go for Green Guidelines: Salad Bar
 Go for Green Guidelines: Salad Bar Overview Many people assume the salad bar is a healthy option, but it also can contain less healthy, performance-limiting options. That means the kinds of items offered
GROCERY LIST week one
 week one - green beans - medium spaghetti squash - green bell pepper (2) - broccoli - red bell pepper (2) - 4 red potatoes - tomato - baby carrots - celery - head of garlic (2) - head of iceberg lettuce
Glycemic Index. Patient Education Diabetes Care Center. What is the glycemic index? Rise in Blood Sugar vs. Time
 Patient Education This handout explains the glycemic index (GI). It also lists low glycemic index foods to help you choose foods that will help you improve your blood glucose levels and the quality of
14- Day Build Meal Plan
 14- Day Build Meal Plan DAY 1 Prepare extra quinoa and Baked Lemon Chicken* for tomorrow s lunch DAY 2 Make extra brown rice and Turkey Chili* for tomorrow s lunch DAY 3 Want to Build Some Muscle? Your
14- Day Build Meal Plan
 14- Day Build Meal Plan Want to Build Some Muscle? Your 14- Day Meal Plan combines lean protein with high quality, complex carbs to support muscle growth. Use the pantry and shopping list at the end of
Results from the 2007 Survey of School Food Service Providers in Oregon
 Results from the 2007 Survey of School Food Service Providers in Oregon Prepared by: Michelle M. Ratcliffe, M.S.E.L., Ph.D. and Haley C. Smith, Maters Candidate, Portland State University I. Introduction
CONSUMER TRENDS Pulses In India
 International Markets Bureau MARKET INDICATOR REPORT DECEMBER 2009 CONSUMER TRENDS Pulses In India Consumer Trends Pulses in India EXECUTIVE SUMMARY While India is the largest producer of pulses in the
This packet provides information for your individual nutrition report as well as a food questionnaire.
 FOOD QUESTIONNAIRE This packet provides information for your individual nutrition report as well as a food questionnaire. First: Middle: Last: Company: Gender: Male Female Identification Number: Date of
Go for Green Guidelines: Salad Bar
 Go for Green Guidelines: Salad Bar Overview Many people assume the Salad Bar is a healthy option, but it also can contain performance-limiting options. That means the types and variety of items offered
MEMO CODE: SP (v.3), CACFP (v.3), SFSP (v.3) SUBJECT: Smoothies Offered in Child Nutrition Programs-Revised
, CACFP (v.3), SFSP (v.3) SUBJECT: Smoothies Offered in Child Nutrition Programs-Revised") United States Department of Agriculture Food and Nutrition Service DATE: MEMO CODE: SUBJECT: Smoothies Offered in Child Nutrition Programs-Revised 3101 Park Center Drive Alexandria, VA 22302-1500 TO: Regional
United States Department of Agriculture Food and Nutrition Service DATE: MEMO CODE: SUBJECT: Smoothies Offered in Child Nutrition Programs-Revised 3101 Park Center Drive Alexandria, VA 22302-1500 TO: Regional
Master Menu. Provided to you by: An efficient, time-saving method of tracking meals served in your child care home.
 Master Menu Provided to you by: An efficient, time-saving method of tracking meals served in your child care home. The Master Menu is a coding system designed to help ACD Providers save time while writing
FAIR TRADE WESTERN PURPLE PAPER
 FAIR TRADE WESTERN PURPLE PAPER Introduction What is Fair Trade? Fair Trade (FT) is a certification system which guarantees that the farmers and artisans creating the products we buy are getting a better
IAmMsPrissy Basic Food Groups (Vegetables, Fruits, Grains, Dairy, and Protein Foods) inspire healthy eating and a balanced diet.
 inspire healthy eating and a balanced diet.") Vegetables may be fresh, frozen, canned or dried/dehydrated and may be eaten whole, cut-up, or mashed. 100% Vegetable Juice is part of the vegetable group. Eat a variety of dark green, red and orange vegetables,
Vegetables may be fresh, frozen, canned or dried/dehydrated and may be eaten whole, cut-up, or mashed. 100% Vegetable Juice is part of the vegetable group. Eat a variety of dark green, red and orange vegetables,
Reducing Food Waste in TURKEY 23 February 2017 Ankara
 Reducing Food Waste in TURKEY 23 February 2017 Ankara 1 Food Loss and Waste (FLW) is a challenge all countries have to face Rough estimates suggest that the cost for producing food that is wasted amounts
Daniel Fast Meal Plan
 Daniel Fast Meal Plan Monday, August 21st - Tuesday, September 12th Need a little help planning meals? Below is a meal plan and grocery list for dinners. Go to www.danielfasting.com for cooking instructions,
An update from the Competitiveness and Market Analysis Section, Alberta Agriculture and Forestry.
 An update from the Competitiveness and Market Analysis Section, Alberta Agriculture and Forestry. The articles in this series includes information on what consumers are buying and why they are buying it.
Menu Planning: Healthy Summer Meals
 Menu Planning: Healthy Summer Meals The Summer Food Service Program (SFSP) was established to make sure that children continue to receive nutritious meals when school is not in session. SFSP can help children
Check us out at thunderviewfarms.com
 Your Source for Superior Local Angus Beef High Quality Registered Angus Genetics Dick Penny Ric, Karen, Patrick Becky (845)985-2189 Check us out at thunderviewfarms.com Phil Carolyn Seedstock, 4-H Prospects,
2017 Food Attitudes & Behaviors
 20 Food Attitudes & Behaviors Americans appetite for increased control and wellness is disrupting the tried and true QSR formula for success. With no traffic growth in 2016 and a growing stigma with key
Leverage the Rising Sustainability Wave
 Leverage the Rising Sustainability Wave New Research and Best Practices Fair Trade USA October 2016 Who is Fair Trade USA? 3 rd Party sustainable and ethical certification Apparel & Shoes Quinoa & Rice
ACOS ETHIOPIA CASE STUDY
 OUR HISTORY It was only 2005 when Acos Ethiopia came to light from a pioneering idea of forward thinking people, the Pedon family. Ethiopia then was an even more challenging environment than it is now,
Pantry: Cinnamon Coconut flakes Cocoa powder Pepper Cinnamon Paprika Cayenne
 METAMORPHOSIS GROCERY LISTS Week Power Juice Blueberry Applesauce Sweet Potato Corn Pudding Carrot Parsnip Puree Gazpacho Veggie Protein Soup Chocolate Pudding 7 bunches kale Spinach (enough for 7 juices)
DERIVED DEMAND FOR FRESH CHEESE PRODUCTS IMPORTED INTO JAPAN
 PBTC 05-04 PBTC 02-6 DERIVED DEMAND FOR FRESH CHEESE PRODUCTS IMPORTED INTO JAPAN By Andreas P. Christou, Richard L. Kilmer, James A. Stearns, Shiferaw T. Feleke, & Jiaoju Ge PBTC 05-04 September 2005
3. How do you store produce (not TCS) after receiving it, before use?
 after receiving it, before use?") As part of the Conference for Food Protection, Produce Wash Committee, we would greatly appreciate your feedback regarding the handling and washing of produce in your operation. Please mark all choices
As part of the Conference for Food Protection, Produce Wash Committee, we would greatly appreciate your feedback regarding the handling and washing of produce in your operation. Please mark all choices
At Smiths Quality Meats our craftsmen customize your meat innovations H.A.C.C.P. RECOGNIZED QUALITY MEATS FOR OVER 60 YEARS
 At Smiths Quality Meats our craftsmen customize your meat innovations H.A.C.C.P. RECOGNIZED QUALITY MEATS FOR OVER 60 YEARS Beef Products TOP SIRLOIN STEAKS (individually packed) Grain fed, imported (individually
Our catering staff is ready to assist you Monday-Saturday 8am-4pm. Please contact us at
 CATERING LOCATION AND HOURS Our catering staff is ready to assist you Monday-Saturday 8am-4pm. Please contact us at eat@lincolnpasadena.com. Orders are available to pick up at 1992 Lincoln Avenue Pasadena,
THE ECONOMIC IMPACT OF THE WINE AND GRAPE INDUSTRY IN CANADA 2015
 THE ECONOMIC IMPACT OF THE WINE AND GRAPE INDUSTRY IN CANADA 2015 Canada s Wine Economy Ripe, Robust, Remarkable A Report with special assistance from Rob Eyler, President, Economic Forensics and Analytics
Market Report provided by American Restaurant Associationwww.AmericanRestaurantAssociation.com-
 Beef, Veal and Lamb Report Beef, Veal & Lamb- Beef production last week rose 1.7% and was 1.3% larger than '11. The beef markets remain historically high but have shown signs of weakness as of late. In
HL/yr % HL/yr 0 0%
 dion@thebeerfarm.ca Edit this form 11 responses View all responses Summary What is the name of your brewery or brewpub? Beacon Brewing Co. Nelson BC brewbeacon@gmail.com 250-352-0094 Firehall Brewery Red
MEMO CODE: SP , CACFP , SFSP Smoothies Offered in Child Nutrition Programs. State Directors Child Nutrition Programs All States
 United States Department of Agriculture Food and Nutrition Service 3101 Park Center Drive Alexandria, VA 22302-1500 DATE: November 14, 2013 MEMO CODE: SP 10-2014, CACFP 05-2014, SFSP 10-2014 SUBJECT: TO:
RUDYMAWER S CELEBRITY GROCERYLIST
 RUDYMAWER S 20DAYHOLLYWOODREBOOT CELEBRITY GROCERYLIST LEGAL DISCLAIMER All information, programs and tools presented on this site, in ebooks and in 20 Day Hollywood Reboot (or other) programs are intended
LIFE HAS HEALTHY CHOICES
 LIFE HAS HEALTHY CHOICES 2015 Recipes Black Bean Soup y 1 Italian Broccoli and Pasta y 2 Sweet Potato Fries y 3 Zucchini and Tomatoes y 4 Easy Greek Salad y 5 Baked Chicken Nuggets y 6 Peach Crisp y 11
Eco-Schools USA Sustainable Food Audit
 Eco-Schools USA Sustainable Food Audit Learning Objectives Discuss the importance of health and nutrition and discover the impacts food can have on the body. Monitor their food choices, making healthier,
Nutri-Serve Food Management
 Nutri-Serve Food Management Dealing With Gluten Allergies in Your School District The number of kids on gluten-free diets has increased over the last couple of years. This is believed to be due to greater
Plant-Based Eating Toolkit
 Plant-Based Eating Toolkit Felicia Steger & Libby Macht, OSF Saint Francis Medical Center Dietetic Interns Katrina Sommer, RD, LDN Sharon Windsor, RD, CSO, LDN What Is Plant-Based Eating? Plant-based eating
MEAL PLAN Week 1 SHOPPING LIST (See staple ingredients on page 2.)
") MEAL PLAN Week 1 SHOPPING LIST (See staple ingredients on page 2.) 420 Calories 300 Calories Bacon burger Salad Spring Mix & Grilled Croutons Turkey Reuben Salad 230 Calories 450 Calories Penne with Arugula
MEAL PLAN Week 1 SHOPPING LIST (See staple ingredients on page 2.) 420 Calories 300 Calories Bacon burger Salad Spring Mix & Grilled Croutons Turkey Reuben Salad 230 Calories 450 Calories Penne with Arugula
THE ECONOMIC IMPACT OF MODEL WINERIES IN TEXAS. Industry Report
 THE ECONOMIC IMPACT OF MODEL WINERIES IN TEXAS Industry Report by Pati Mamardashvili, PhD International School of Economics at Tbilisi State University, Tbilisi, Georgia Tim Dodd, PhD Texas Tech University,
Photo by Ricki Van Camp (with permission). Introduction
. Introduction") How We Started A Farm-To-Cafeteria Program and How You Can Start One, Too OCTOBER 2009 Introduction Photo by Ricki Van Camp (with permission). This How To summarizes our recent success in establishing
How We Started A Farm-To-Cafeteria Program and How You Can Start One, Too OCTOBER 2009 Introduction Photo by Ricki Van Camp (with permission). This How To summarizes our recent success in establishing
FOOD IN-A-BOX CAFÉ ALL OF YOUR FOOD SERVED IN A BOX!
 : TAKING CHARGE OF YOUR CHOICES LESSON FOOD -MAKING 4: FOOD DINING IN-A-BOX DECISIONS CAFÉ ALL OF YOUR FOOD SERVED IN A BOX! ALL OF YOUR FOOD SERVED IN A BOX! MENU SANDWICHES & SOUPS ENTREES Double Battered
Phosphorus Content of Foods
 Northwestern Memorial Hospital Patient Education DIET AND NUTRITION Talk with your healthcare provider if you have questions about your diet. Phosphorus Content of Foods The foods you eat play an important
oz of Meat and Beans (Protein) You should choose lean options instead of fatty ones
 You should choose lean options instead of fatty ones") Name Go to Choosemyplate.gov Hover over online tools on the top banner. Select supertracker. Scroll down a bit and click on the blue words that say create a profile Do step 1 section and then step 3 submit
Name Go to Choosemyplate.gov Hover over online tools on the top banner. Select supertracker. Scroll down a bit and click on the blue words that say create a profile Do step 1 section and then step 3 submit
Host Catering Guide. Always moving forward. Host Catering Guide for ICF Competition
 Host Catering Guide Always moving forward Host Catering Guide for ICF Competition Contents 1/ Introduction... 3 2/ Specific Recommendation... 4 3/ Lunch/Dinner... 6 4/ Breakfast... 8 5/ Food Safety...
14- Day Burn Meal Plan
 14- Day Burn Meal Plan Ready to Burn Some Fat? Your 14- Day Meal Plan features nutrient- dense, complex carbohydrates and lean proteins to maintain lean muscle while burning fat. Use the pantry and shopping
14- Day Burn Meal Plan
 14- Day Burn Meal Plan Ready to Burn Some Fat? Your 14- Day Meal Plan features nutrient- dense, complex carbohydrates and lean proteins to maintain lean muscle while burning fat. Use the pantry and shopping
Get ready to change how you feel and look in just 10 days. The CoreBody Reformer
 Get ready to change how you feel and look in just 10 days. The CoreBody Reformer 10-Day Kick Start is the time to challenge yourself and create a new you. This is the most restrictive part of the program.
Retailing Frozen Foods
 61 Retailing Frozen Foods G. B. Davis Agricultural Experiment Station Oregon State College Corvallis Circular of Information 562 September 1956 iling Frozen Foods in Portland, Oregon G. B. DAVIS, Associate
Recipes for Homemade Lunches
 February 2011 Recipes for Homemade Lunches The following pages are the recipes for lunches prepared at school. If students require more or less food than specified, portions can be altered. Remember at
Lesson 5: FOOD IN OUR COMMUNITY. Objectives. Time Materials. Preparation. Background Information. Appendix 5A
 Lesson 5: FOOD IN OUR COMMUNITY Objectives Time Materials Students will examine the ways that the food environment can influence food choices and healthy eating. They will show awareness of various strategies
4 Meals + 1 Snack - OR - 3 Meals + 2 Snacks
 How it Works Choose a schedule to follow: 4 Meals + 1 Snack - OR - 3 Meals + 2 Snacks Are you Breastfeeding? Eat 4 meals a day, plus 2 snacks from the 200-300 Calorie Snack list. Include any additional
Fundraising Package. Page: 2. Introduction to V.I.P Food Services. 3. Fundraising information
 Fundraising Package Page: 2. Introduction to V.I.P Food Services 3. Fundraising information 4-5. Menu (will show you the products available along with a short description of each item and the price to
THIS REPORT CONTAINS ASSESSMENTS OF COMMODITY AND TRADE ISSUES MADE BY USDA STAFF AND NOT NECESSARILY STATEMENTS OF OFFICIAL U.S.
 THIS REPORT CONTAINS ASSESSMENTS OF COMMODITY AND TRADE ISSUES MADE BY USDA STAFF AND NOT NECESSARILY STATEMENTS OF OFFICIAL U.S. GOVERNMENT POLICY Voluntary - Public Date: 9/12/2012 GAIN Report Number:
RAINBOW PLATE CHALLENGE
 PURPLE Name Teacher Date STUDENT WORKSHEET GRADES K-12 RAINBOW PLATE CHALLENGE RAINBOW PLATE CHALLENGE WORKSHEET INSTRUCTIONS: Have students record foods consumed within a one week period. Challenge students
Sustainability Initiatives in Other Tropical Commodities Dr. Jean-Marc Anga Director, Economics and Statistics Division
 0 International Cocoa Organization Sustainability Initiatives in Other Tropical Commodities Dr. Jean-Marc Anga Director, Economics and Statistics Division 1 Sustainable Development 1983: Brundtland Commission
Phosphorus Content of Foods
 Northwestern Memorial Hospital Patient Education DIET AND NUTRITION Talk with your healthcare provider if you have questions about your diet. Phosphorus Content of Foods The foods you eat play an important
CODE BEEF CODE STEAK CUTS
 BEEF STEAK CUTS 163 Filet Mignon - any size PER LB 107 Fillet Mignon, Bacon Wrapped - any size PER LB 1005 NY Strip Steak-any size AA/AAA PER LB 103 NY Striploin AA/AAA (FRESH) PER LB 103F NY Striploin
*Note that foods marked with have no current tested ORAC value.
 Fruit/ Serving/ ORAC Value Blueberries 1 c= 9,700 Cranberries (raw) 1 c= 9,600 Red Delicious apple 1= 7,800 Blackberries 1 c= 7,700 Granny Smith apple 1= 7,100 Raspberries 1 c= 6,000 Strawberries 1 c=
Catering Menu. All orders for delivery require a minimum of $100. Any orders under $100 are eligible for pick-up
 Catering Menu V - Vegetarian VG - Vegan GF - Gluten Free All orders for delivery require a minimum of $100. Any orders under $100 are eligible for pick-up Breakfast Breakfast Combos Rise N Shine Continental
Serving High Quality Meals in Summer Meal Programs. June 2016
 Serving High Quality Meals in Summer Meal Programs June 2016 Importance of High Quality Meals Increase and retain participation Help children learn, grow, and stay healthy 2 What is a High Quality Meal?
Serving High Quality Meals in Summer Meal Programs
 Serving High Quality Meals in Summer Meal Programs June 2016 Importance of High Quality Meals Increase and retain participation Help children learn, grow, and stay healthy 2 What is a High Quality Meal?
SAMPLE. An initial trial of 1 to 3 months should allow enough time to assess whether the diet improves symptoms.
 Gluten- and Casein-Free Diet: A Trial Diet for Autism Some children with autism spectrum disorder have been reported to improve significantly when casein and gluten are removed from their diets. Casein
MIL print CORE Menus Updated - NFLD 1017.indd 1
 MIL print CORE Menus Updated - NFLD 1017.indd 1 COCONUT CALAMARI ON.3.0616 MIL print CORE Menus Updated - NFLD 1017.indd 2 STARTERS HOT SPINACH & ARTICHOKE DIP Spinach Artichoke Hearts Italian Cheeses
Eating Guidelines for Cancer Prevention Plant-Based Diet
 Eating Guidelines for Cancer Prevention Plant-Based Diet Eating well is one thing you can do to help lower your chance of getting cancer. Eating a mainly plant based diet, one that includes vegetables,
Helper. Sheets. For. School Nutrition Programs
 Helper Sheets For School Nutrition Programs 2016-2017 Child Nutrition Program Acronyms When planning how much to prepare or purchase: HELPFUL FORMULAS # of Servings Needed Helper Sheets Factor Amount
MyPlate: What Counts as a Cup?
 MyPlate: What Counts as a Cup? What Counts as a Cup of Fruit? In general, 1 cup of fruit or 100% fruit juice, or ½ cup of dried fruit can be considered as 1 cup from the Fruit Group. See the Chart 1 below.
Enjoy Pulses Kathy Savoie, Extension Educator
 Eat Well Nutrition Education Program Eat Well! A Newsletter for Healthy Eating Enjoy Pulses Kathy Savoie, Extension Educator Inside Fall 2016 Food Safety Corner Using Leftover Pulses Kid s Korner After
how? how food is produced Theme An introduction to the origins of food products, with videos showing the origins and production of different foods.
 how food is produced Theme An introduction to the origins of food products, with videos showing the origins and production of different foods. Aim For children to develop an understanding that different
Product varieties made from cereals simply because it s good!
 The SchapfenMühle coat of arms: The characteristic waterwheel in our coat of arms gave the SchapfenMühle its name. Instrumental in transporting the water and driving the wheel are not the blades but the
Commodity Calculators Lisa Melby, Rockford Public Schools #205
 Commodity Calculators Lisa Melby, Rockford Public Schools #205 USDA Foods - defined Commodities-items purchased by USDA through established mechanisms and offered to states to allocate to school food authorities
Top Ten ANDI Scores GREEN VEGETABLES NONGREEN VEGETABLES
 Top Ten ANDI Scores ANDI stands for "Aggregate Nutrient Density Index." An ANDI score shows the nutrient density of a food on a scale from 1 to 1000 based on nutrient content. ANDI scores are calculated
catering menu Business to Business
 catering menu Business to Business breakfast Minimum 8 people. All prices listed are per unit/person. RISE & SHINE $7 Each person receives 3 pieces. Freshly baked goods including bagels, butter croissants,
Fair Trade C E R T I F I E D
 Fair Trade C E R T I F I E D Every Purchase Matters. Apparel & Home Goods Program What is Fair Trade? Safe Working Conditions Guarantee of safe factory working conditions Advancement of People Direct mechanism
Thunder View Farms LLC Genuine Black Angus Beef The Coombe Family Grahamsville, NY
 The Coombe Family 845.985.2189 tvangus@thunderviewfarms.com 2011-2012 Dear Clients, As you have shown an interest in our natural Angus beef, we would like to provide you with some background information.
Week 5. Ultimate Weight Loss Protocol Continuum. Welcome to Week 5!
 Continuum Welcome to! We are now going to begin to transition off of the very low carbohydrate plan and begin to introduce more carbohydrates back into your diet. We do this very slowly and carefully to
McDONALD'S AS A MEMBER OF THE COMMUNITY
 McDONALD'S ECONOMIC IMPACT WITH REBUILDING AND REIMAGING ITS RESTAURANTS IN SOUTH LOS ANGELES, CALIFORNIA A Report to McDonald's Corporation Study conducted by Dennis H. Tootelian, Ph.D. November 2010
Ideal Low Glycemic Index
 Patient Education Section 4 Page 1 Ideal Low Glycemic Index Heart-healthy food choices The glycemic index compares the impact on blood sugar levels of the carbohydrate in foods to an equivalent amount
Roast Sirloin and Barley Made from slow roasted Canadian sirloin beef, hearty barley and garden vegetables
 FOUR COURSES Includes fresh baked dinner rolls with whipped butter, your choice of soup, salad and dessert, as well as your choice of entrée with coffee and tea (price is determined by your choice of entrée).
SMALLHOLDER TEA FARMING AND VALUE CHAIN DEVELOPMENT IN CHINA
 SMALLHOLDER TEA FARMING AND VALUE CHAIN DEVELOPMENT IN CHINA Intersessional Meeting of the Intergovernmental Group on Tea Rome, 5-6 May 2014 Cheng Fang, Economist, Trade and Markets Division, FAO Yanjiong
Canada-EU Free Trade Agreement (CETA)
") Canada-EU Free Trade Agreement (CETA) The Issue: Following 5-years of negotiation, CETA was signed in principle on October 18, 2013, and signed officially by Prime Minister Trudeau on October 29, 2016,
Canada-EU Free Trade Agreement (CETA) The Issue: Following 5-years of negotiation, CETA was signed in principle on October 18, 2013, and signed officially by Prime Minister Trudeau on October 29, 2016,
cheese fridge pts ctn pts ctn pts ctn pts ctn Tasty Cheese Slices 8 x 1.5kg 240 pts ctn Light Tasty Cheese Slices 8 x 1.
 antipasto 67 butter 63 cheese 58 chocolate 64 cream 65 cream cheese 62 dips 66 eggs 65 margarine 63 pastry 62 pesto 66 seafood 67 smallgoods 67 yogurt 66 fridge fridge 58 cheese 240 Tasty Slices 8 x 1.5kg
Response to Reports from the Acadian and Francophone Communities. October 2016
 Response to Reports from the Acadian and Francophone Communities October 2016 Crown copyright, Province of Nova Scotia, 2016 Message from the Minister of Acadian Affairs Acadian culture and heritage are
Professor Popcorn Grade 2, Lesson 3: Visual 2:3A Professor Popcorn
 Professor Popcorn Grade 2, Lesson 3: Visual 2:3A Professor Popcorn What s Protein Grains Dairy on your plate? Fruits Vegetables ChooseMyPlate.gov Make half your plate fruits and vegetables. Vary your protein
Consumer Perceptions: Dairy and Plant-based Milks Phase II. January 14, 2019
 Consumer Perceptions: Dairy and Plant-based s Phase II January 14, 2019 1 Background & Objectives DMI would like to deepen its understanding of consumer perceptions of milk and plant-based milk alternatives
The following summarises the key findings of the Fairtrade and Sustainable Food survey. The findings of the summary can be found in Appendix 1.
 UWTSD Fairtrade & Sustainable Food Survey The UWTSD Group is one of 12 Universities and Colleges from across the UK taking part in the new Fairtrade University & Colleges programme to pilot a set of new
Eat Well For Life Bingo
 GOAL To integrate the Canada s Food Guide in an interactive bingo game, making learning about healthy eating for healthy aging interesting and fun. Objectives: To become familiar with Canada s Food Guide
Master Menu. Provided to you by: An efficient, time saving method of tracking meals served in your child care home.
 Provided to you by: An efficient, time saving method of tracking meals served in your child care home. The is a time-saving coding system designed for ACD Providers to reduce time writing menus. The s
Provided to you by: An efficient, time saving method of tracking meals served in your child care home.
 Provided to you by: An efficient, time saving method of tracking meals served in your child care home. The Master Menu is a time-saving coding system designed for ACD Providers to reduce time writing menus.
BREAKFAST SERVED MON-SAT 6-11AM / SUN 6AM-NOON
 BREAKFAST SERVED MON-SAT 6-11AM / SUN 6AM-NOON Upgrade any hash browns to loaded hash browns (cheddar, green onion and sour cream) $1.50 Add bacon to loaded hash browns.50 OMELETS & SCRAMBLES Crossroads
Grape Growers of Ontario Developing key measures to critically look at the grape and wine industry
 Grape Growers of Ontario Developing key measures to critically look at the grape and wine industry March 2012 Background and scope of the project Background The Grape Growers of Ontario GGO is looking
Nutrition Education and Activity LESSON PLAN. Art Contest Preferred Meals
 Nutrition Education and Activity LESSON PLAN Healthy Lunch for a Healthier Me Art Contest Teacher Lesson Plan & Activity Build Your Lunch the Healthy Way! Overview: Studies show that children who eat school
Cuisine and Pizza. Family Restaurant Pizza * Pasta * Steaks * Burgers & Sandwiches Take out * Eat In. Fully Licenced
 Cuisine and Pizza Fully Licenced Family Restaurant Pizza * Pasta * Steaks * Burgers & Sandwiches Take out * Eat In RESTAURANT Mon - Sat 7am - 9pm PIZZA Mon - Sat 7am - 10pm SUNDAY Closed Holidays Closed
PEI School Nutrition Policies November 25, 2004
 Backgrounder PEI School Nutrition Policies November 25, 2004 Background In June 2003, the three school boards began to develop new school nutrition policies with the assistance of the PEI Healthy Eating
Comparative Analysis of Fresh and Dried Fish Consumption in Ondo State, Nigeria
 Comparative Analysis of Fresh and Dried Fish Consumption in Ondo State, Nigeria Mafimisebi, T.E. (Ph.D) Department of Agricultural Business Management School of Agriculture & Natural Resources Mulungushi
WHAT'S ON THE MENU? Monday Tuesday Wednesday Thursday Friday CREATE
 . FOOD FOCUS: Enter menu messages or food focus info here. Algonac Secondary Lunch Menu WHAT'S ON THE MENU? October 29 - November 2, 2018 Student Lunch Price: $2.75 Reduced Lunch Price: $.40 Adult Lunch