Date Target Buyer(s) Segment ($ in Mil) Rev EBITDA 3/20/2018 Green Chef Corp. HelloFresh SE Ingredients & Flavors - - -
|
|
|
- Melissa Carmella Bennett
- 5 years ago
- Views:
Transcription


1


2
3
4 Financial 14% Strategic 86% Amount Date Target Buyer(s) Segment Rev 3/20/2018 Green Chef Corp. HelloFresh SE Ingredients & Flavors /8/2018 Bravo Brio Restaurant Group, Inc. Spice Private Equity AG Restaurants x 3.79x 2/20/2018 Fogo de Chão, Inc. Rhône Capital LLC Restaurants /13/2018 Smashburger Master LLC Jollibee Worldwide Pte Ltd.; Bee Good, Inc. Restaurants /6/2018 Mann Packing Co., Inc. Del Monte Fresh Produce N.A., Inc. Produce x - 2/1/2018 Dole Food Co., Inc. Total Produce Plc Produce x 2.81x 1/30/2018 Minsa Corp. Bunge North America, Inc. Ingredients & Flavors /29/2018 Dr Pepper Snapple Group, Inc. Keurig Green Mountain, Inc. Non-Alcohol 25, x 16.05x 1/23/2018 Keg Restaurants Ltd. Cara Operations Ltd. Restaurants /17/2018 Avión Spirits LLC Pernod Ricard USA LLC Alcohol /17/2018 JBS Five Rivers Cattle Feeding LLC Ospraie Management LLC; Pinnacle Asset Proteins Management LP 1/16/2018 Nestle SA - US Confectionery BU Ferrero SpA CPG Foods 2,
5 Strategic Buyer Inv. Date Select Corporate Acquisitions Premium Brands Holdings Corp. 3/15/2018 Concord Premium Meats Ltd. 3/15/2018 The Meat Factory Ltd. 3/15/2018 Country Prime Meats Ltd. 3/15/2018 Frandon Seafood, Inc. MTY Food Group, Inc. 2/19/2018 Grabbagreen Franchsing LLC 2/15/2018 Threecaf Brands Canada, Inc. - Franchise Business 12/12/2017 Imvescor Restaurant Group, Inc. 11/14/2017 CB Franchise Systems LLC Four Foods Group Holdings LLC 12/1/2017 Swig Holdings LLC 7/1/2017 MO' Bettahs Hawaiian Style Food 3/29/2017 Little Caesar Enterprises Inc (48 Restaurants) 1/31/2017 The Soda Shop LLC Tyson Foods, Inc. 11/13/2017 Original Philly Holdings, Inc. 4/25/2017 AdvancePierre Foods Holdings, Inc. 10/10/2016 Savage River, Inc. 1/20/2014 Artinian, Inc. Nestlé 11/3/2017 Chameleon Cold Brew LLC 9/14/2017 Blue Bottle Coffee, Inc. 9/7/2017 Sweet Earth, Inc. 4/23/2012 Pfizer Nutrition Inc. Financial Buyer Inv. Date Select Corporate Investments Wind Point Advisors LLC 1/30/2018 California Natural Products Inc 12/6/2017 Pacifica Foods LLC 11/6/2017 Gaytan Foods Co. 4/11/2016 Evans Food Group Ltd. 3/27/2015 Gehl Foods, LLC Apollo Global Management 12/19/2017 Qdoba Restaurant Corp. 3/14/2016 The Fresh Market, Inc. 2/16/2011 Sprouts Farmers Market, Inc. (NasdaqGS:SFM) 1/30/2013 Hostess Brands, Inc. (Certain Snack Cake Brands) L Catterton 10/11/2017 Uncle Julio's Corp. 6/20/2017 Punch Bowl Social 9/2/2016 Front Burner Restaurants LP 9/2/2016 Velvet Taco 12/22/2015 The Piada Group, LLC 7/30/2015 Lily's Kitchen Limited Brynwood Partners 8/3/2017 Cold Spring Brewing Co. 12/7/2016 Nestle Healthcare Nutrition, Inc. (Nutrament Bus) 11/1/2016 Faribault Foods, Inc. (Beverage Business) 1/14/2016 Sunny Delight Beverages Co. 7/2/2014 Nestle USA, Inc. (Juicy Juice Business) Advent International Corp. 3/1/2018 Lentz Milling Co. 3/1/2018 Lentz Milling Co. 6/8/2016 ConAgra Foods, Inc., JM Swank Business 9/20/2012 Harvest Meat Company, Inc.
6 50% 40% 30% 20% 10% 0% -10% -20% Alcohol Non-Alcohol CPG Foods Natural & Organic Foods Dairy Proteins Produce Ingredients & Flavors Co-Packers Restaurants Digitally Native S&P 500 Price/ Margin Rev EPS $ -4.1% -4.1% 86.8% (5.4%) 39.1% 5.3x 14.1x 27.0x 5.7x 13.7x Anheuser-Busch InBev SA/NV ABI-BE $ 185, Diageo Plc DGE-GB 83, % -11.5% 91.0% 2.1% 36.4% 5.8x 17.3x 20.4x 5.8x 16.3x Constellation Brands, Inc. STZ-US 44, % -0.3% 98.3% 7.7% 33.8% 7.2x 20.4x 22.0x 7.5x 19.8x Brown-Forman Corp. BF.B-US 25, % -1.0% 95.8% 7.4% 36.5% 8.7x 24.1x 34.9x 8.1x 22.4x Molson Coors Brewing Co. TAP-US 14, % -8.2% 77.3% 2.2% 17.0% 2.5x 11.0x 11.5x 2.4x 10.5x Boston Beer Co., Inc. SAM-US 1, % -1.1% 93.4% 3.3% 13.9% 2.5x 12.6x 23.2x 2.5x 13.5x MGP Ingredients, Inc. MGPI-US 1, % 16.5% 98.9% 9.8% 15.2% 4.4x 28.2x 36.7x 4.0x 23.4x Craft Brew Alliance, Inc. BREW-US % -3.1% 92.5% 3.4% 9.4% 1.9x 25.7x 38.0x 1.8x 17.6x Castle Brands, Inc. ROX-US % 1.6% 55.9% 12.8% 7.4% 2.8x 54.2x NM 2.5x 27.4x Willamette Valley Vineyards, Inc. WVVI-US % -3.8% 89.6% NM 23.3% 2.5x 10.0x 17.3x NM NM Truett-Hurst, Inc. THST-US % -11.6% 76.3% NM (5.5%) 1.2x NM NM NM NM Segment Average 4.8% 20.6% 4.1x 21.8x 25.7x 4.5x 18.3x Segment Median 3.4% 17.0% 2.8x 18.8x 23.2x 4.0x 17.6x
7 Price/ Margin Rev EPS $ -5.3% -5.3% 89.3% (9.2%) 30.4% 6.1x 20.5x 149.8x 6.8x 18.6x The Coca-Cola Co. KO $ 185, PepsiCo, Inc. PEP 154, % -9.0% 89.1% 3.8% 17.5% 2.7x 13.5x 32.3x 2.7x 12.8x Monster Beverage Corp. MNST 32, % -9.6% 81.5% 14.7% 34.6% 9.3x 24.3x 40.3x 8.2x 22.0x Dr Pepper Snapple Group, Inc. DPS 21, % 22.0% 93.5% 4.3% 24.8% 3.8x 16.3x 20.1x 3.7x 15.5x Coca-Cola European Partners Plc CCE 20, % 4.5% 93.1% 14.1% 11.6% 2.1x 12.0x 26.0x 1.9x 10.4x Fomento Economico Mexicano SAB de CV FMX-US 19, % -2.6% 88.1% 16.9% 15.7% 1.6x 12.2x 14.5x 1.3x 10.2x National Beverage Corp. FIZZ 4, % -8.6% 68.6% 19.1% 21.1% 4.2x 19.0x 29.3x 3.6x 15.8x Coca-Cola FEMSA SAB de CV KOF 3, % -4.6% 72.3% 12.6% 21.6% 1.7x 8.8x NM 1.5x 7.6x Hain Celestial Group, Inc. HAIN 3, % -24.3% 70.3% 5.5% 7.7% 1.4x 15.3x 33.8x 1.3x 11.1x TreeHouse Foods, Inc. THS 2, % -22.6% 42.3% (3.9%) 8.5% 0.7x 7.6x NM 0.8x 8.2x SodaStream International Ltd. SODA 2, % 30.6% 95.3% 15.3% 19.5% 3.5x 18.5x 26.9x 3.1x 16.3x Cott Corp. (Canada) BCB-CA 2, % -9.7% 82.9% 4.5% 10.7% 1.8x 15.3x NM 1.8x 13.0x Coca-Cola Bottling Co. Consolidated COKE 1, % -19.8% 69.2% NM 4.3% 0.7x 10.5x 16.8x NM NM Primo Water Corp. PRMW % -6.8% 84.5% 6.8% 17.0% 2.2x 12.8x NM 2.1x 10.4x Reed's, Inc. REED % 9.7% 35.8% 14.8% (21.3%) 1.2x NM NM 0.7x NM Coffee Holding Co., Inc. JVA % 2.0% 87.0% 12.1% 4.1% 0.4x 13.7x 48.2x 0.4x NM Crystal Rock Holdings, Inc. CRVP % 16.3% 77.8% NM 1.8% 0.6x 8.0x 15.2x NM NM Leading Brands, Inc. LBIX % -25.1% 32.5% NM NM 2.3x NM NM NM NM Price/ Margin Rev EPS $ -2.5% -2.5% 88.4% 4.7% 18.3% 3.1x 15.0x 22.2x 3.0x 14.4x Mondelez International, Inc. MDLZ $ 61, General Mills, Inc. GIS 25, % -24.0% 74.2% 9.4% 19.2% 2.3x 11.4x 12.0x 2.1x 10.0x Kellogg Co. K 22, % -4.4% 87.5% 0.7% 25.7% 2.4x 7.5x 17.9x 2.4x 11.6x Hormel Foods Corp. HRL 18, % -5.7% 90.3% 7.9% 13.8% 2.0x 14.2x 20.3x 1.9x 13.2x Conagra Brands, Inc. CAG 14, % -2.1% 89.9% 1.8% 17.5% 2.3x 13.3x 17.2x 2.3x 12.0x McCormick & Co., Inc. MKC 13, % 4.4% 95.5% 10.1% 18.8% 3.8x 19.4x 17.3x 3.5x 16.5x Campbell Soup Co. CPB 13, % -10.0% 73.2% 25.0% 21.5% 2.1x 7.8x 12.5x 1.7x 8.3x Pinnacle Foods, Inc. PF 6, % -9.0% 81.2% 0.5% 25.2% 2.9x 13.5x 12.2x 2.9x 12.8x Post Holdings, Inc. POST 5, % -4.4% 85.1% 17.3% 17.9% 2.0x 11.2x 24.8x 1.8x 8.9x Flowers Foods, Inc. FLO 4, % 13.2% 99.6% 1.4% 9.5% 1.4x 14.2x 30.8x 1.4x 11.5x Lancaster Colony Corp. LANC 3, % -4.7% 90.6% 3.0% 17.0% 2.7x 15.9x 28.6x 2.6x 14.1x J&J Snack Foods Corp. JJSF 2, % -10.1% 86.8% 4.3% 12.5% 2.2x 14.6x 25.2x 2.1x 13.7x Cal-Maine Foods, Inc. CALM 1, % -1.7% 86.7% 8.2% 20.6% 1.4x 16.6x 71.6x 1.3x 10.3x B&G Foods, Inc. BGS 1, % -32.6% 55.0% 4.1% 16.1% 2.2x 11.0x 7.3x 2.1x 10.1x Dean Foods Co. DF % -25.4% 42.9% (7.9%) 4.2% 0.2x 5.2x 13.4x 0.2x 5.4x Farmer Brothers Co. FARM % -6.1% 80.9% 14.8% 7.1% 1.0x 15.1x NM 0.9x 9.5x Lifeway Foods, Inc. LWAY % -25.1% 54.4% 7.2% (9.1%) 0.8x 37.6x NM 0.8x NM Rocky Mountain Chocolate Factory, Inc. RMCF % 2.1% 90.9% NM NM 1.8x 10.8x NM NM NM
8 Quarter YTD % of 52 Week High Margin Rev Price/ EPS Pinnacle Foods, Inc. PF 6, % -9.0% 81.2% 0.5% 25.2% 2.9x 13.5x 12.2x 2.9x 12.8x Hain Celestial Group, Inc. HAIN 3, % -24.3% 70.3% 5.5% 7.7% 1.4x 15.3x 33.8x 1.3x 11.1x Sprouts Farmers Markets, Inc. SFM 3, % -3.6% 83.0% 15.5% 5.5% 0.8x 11.0x 20.4x 0.7x 10.4x Darling Ingredients, Inc. DAR 2, % -4.6% 88.7% 2.5% 11.5% 1.2x 10.6x 22.5x 1.2x 9.8x United Natural Foods, Inc. UNFI 2, % -12.8% 81.5% 8.6% 2.9% 0.3x 7.9x 14.0x 0.2x 7.4x Calavo Growers, Inc. CVGW 1, % 9.2% 96.3% 19.6% 5.6% 1.5x 22.3x 41.2x 1.3x 17.8x SunOpta, Inc. SOY-CA % -5.1% 69.9% (2.4%) 2.8% 0.9x 18.0x NM 0.9x 12.7x Limoneira Co. LMNR % 5.9% 91.1% (2.0%) 0.0% 3.8x 23.4x 20.5x 3.9x 19.0x Natural Grocers by Vitamin Cottage, Inc. NGVC % -19.8% 61.7% 8.4% 4.7% 0.3x 5.1x 15.9x 0.3x 4.9x Lifeway Foods, Inc. LWAY % -25.1% 54.4% 7.2% (9.1%) 0.8x 37.6x NM 0.8x NM AMCON Distributing Co. DIT % -0.9% 78.3% NM 0.6% 0.1x 10.3x 18.5x NM NM Reed's, Inc. REED % 9.7% 35.8% 14.8% (21.3%) 1.2x NM NM 0.7x NM RiceBran Technologies RIBT % 6.3% 94.8% 18.3% (51.1%) 1.6x NM NM 0.8x NM Tofutti Brands, Inc. TOF % 12.2% 66.4% NM 8.0% 0.7x 12.6x 14.4x NM NM Price/ Margin Rev EPS $ -6.0% -6.0% 91.7% 2.6% 19.2% 2.3x 12.5x 18.3x 2.2x 11.6x Danone SA BN-FR $ 54, Dean Foods Co. DF % -25.4% 42.9% (7.9%) 4.2% 0.2x 5.2x 13.4x 0.2x 5.4x Lifeway Foods, Inc. LWAY % -25.1% 54.4% 7.2% (9.1%) 0.8x 37.6x NM 0.8x NM Price/ Margin Rev EPS $ -9.7% -9.7% 86.5% 5.4% 11.7% 0.9x 8.7x 9.4x 0.9x 8.1x Tyson Foods, Inc. TSN $ 21, Hormel Foods Corp. HRL 18, % -5.7% 90.3% 7.9% 13.8% 2.0x 14.2x 20.3x 1.9x 13.2x Pilgrim's Pride Corp. PPC 6, % -20.8% 64.1% 3.4% 7.8% 0.8x 6.1x 8.8x 0.7x 6.0x Post Holdings, Inc. POST 5, % -4.4% 85.1% 17.3% 17.9% 2.0x 11.2x 24.8x 1.8x 8.9x Seaboard Corp. SEB 4,994 4, % -3.3% 90.9% NM 5.0% 0.7x 11.0x 20.2x NM NM Premium Brands Holdings Corp. PBH-CA 2, % 14.9% 99.6% 26.0% 8.1% 2.0x 22.5x 44.2x 1.5x 15.6x Nomad Foods Ltd. NOMD 2, % -6.9% 90.9% 17.1% 15.4% 1.9x 11.3x 17.9x 1.6x 9.5x Sanderson Farms, Inc. SAFM 2, % -14.2% 67.5% 2.4% 5.7% 0.7x 4.5x 8.8x 0.7x 5.8x Cal-Maine Foods, Inc. CALM 1, % -1.7% 86.7% 8.2% 20.6% 1.4x 16.6x 71.6x 1.3x 10.3x Pingtan Marine Enterprise, Ltd. PME % -1.6% 59.1% NM 48.8% 4.6x 14.3x 7.9x NM NM Bridgford Foods Corp. BRID % 19.2% 69.4% NM 7.2% 0.8x 8.6x 28.8x NM NM Renmin Tianli Group, Inc. ABAC % -22.7% 47.9% NM 20.0% (1.6x) NM 16.3x NM NM
9 Quarter YTD % of 52 Week High Margin Rev Price/ EPS Sysco Corp. SYY 31, % 9.7% 96.7% 5.8% 5.1% 0.7x 12.9x 27.2x 0.7x 11.7x US Foods Holding Corp. USFD 7, % 16.2% 99.5% 4.8% 4.4% 0.4x 11.0x 16.2x 0.4x 9.7x Nomad Foods Ltd. NOMD 2, % 76.7% 99.4% 17.1% 15.4% 1.9x 11.4x 19.2x 1.9x 10.6x United Natural Foods, Inc. UNFI 2, % 3.2% 93.5% 8.6% 2.9% 0.3x 9.1x 16.0x 0.3x 8.4x Fresh Del Monte Produce, Inc. FDP 2, % -21.4% 75.9% 13.8% 2.9% 0.7x 11.3x 19.9x 0.6x 9.3x Calavo Growers, Inc. CVGW 1, % 37.5% 99.4% 19.6% 5.6% 1.4x 21.3x 37.7x 1.1x 16.4x SpartanNash Co. SPTN % -32.5% 66.1% (0.1%) 2.1% 0.2x 8.0x NM 0.2x 6.9x SunOpta, Inc. ¹ SOY-CA % 1.1% 75.7% (2.4%) 2.8% 0.9x 18.5x NM 0.9x 12.5x Landec Corp. LNDC % -8.7% 84.3% 1.5% 4.3% 0.8x 14.3x 16.6x 0.7x 12.7x Limoneira Co. LMNR % 4.1% 86.0% (2.0%) 0.0% 3.6x 23.7x 19.3x 3.6x 18.0x Seneca Foods Corp. SENEA % -23.2% 74.1% NM 4.9% 0.6x 17.5x 73.2x NM NM Village Farms International, Inc. ¹ VFF-CA % 465.9% 96.3% (0.1%) 4.9% 1.8x 45.4x 61.0x 1.6x 41.6x Alico, Inc. ALCO % 8.7% 84.8% NM NM 3.4x 27.7x 245.8x NM NM Market Stats Operating Stats LTM Multiples Multiples Price/ Margin Rev EPS $ 4.4% 4.4% 95.5% 10.1% 18.8% 3.8x 19.4x 17.3x 3.5x 16.5x McCormick & Co., Inc. MKC $ 13, Ingredion, Inc. INGR 9, % -7.8% 88.1% 2.5% 18.4% 1.8x 9.7x 18.3x 1.8x 9.3x Sensient Technologies Corp. SXT 3, % -3.5% 83.1% 5.5% 18.9% 2.7x 14.3x 34.8x 2.6x 12.8x Darling Ingredients, Inc. DAR 2, % -4.6% 88.7% 2.5% 11.5% 1.2x 10.6x 22.5x 1.2x 9.8x SunOpta, Inc. SOY-CA % -5.1% 69.9% (2.4%) 2.8% 0.9x 18.0x NM 0.9x 12.7x Feronia, Inc. FRN-CA % -27.5% 64.3% NM NM 8.7x NM NM NM NM Price/ Margin Rev EPS $ -20.8% -20.8% 64.1% 3.4% 7.8% 0.8x 6.1x 8.8x 0.7x 6.0x Pilgrim's Pride Corp. PPC $ 6, John B. Sanfilippo & Son, Inc. JBSS % -8.5% 77.5% 5.3% 6.9% 0.9x 10.6x 21.2x 0.8x 9.2x Landec Corp. LNDC % 3.6% 87.3% 1.5% 4.3% 0.8x 21.7x 17.2x 0.8x 15.7x High Liner Foods, Inc. HLF-CA % -24.8% 54.5% 6.2% 4.2% 0.6x 11.8x 8.8x 0.6x 8.4x Amira Nature Foods Ltd. ANFI % 0.0% 59.1% NM 13.2% 0.7x 5.6x 4.8x NM NM Bridgford Foods Corp. BRID % 19.2% 69.4% NM 7.2% 0.8x 8.6x 28.8x NM NM RiceBran Technologies RIBT % 6.3% 94.8% 18.3% (51.1%) 1.6x NM NM 0.8x NM Coffee Holding Co., Inc. JVA % 2.0% 87.0% 12.1% 4.1% 0.4x 13.7x 48.2x 0.4x NM
10 Price/ Margin Rev EPS $ -11.2% -11.2% 85.2% 6.4% 14.6% 1.4x 11.3x 19.7x 1.4x 10.1x Darden Restaurants, Inc. DRI-US $ 10, Cracker Barrel Old Country Store, Inc. CBRL-US 3, % 0.2% 88.9% 4.5% 12.6% 1.4x 10.4x 16.1x 1.3x 9.9x Ruth's Hospitality Group, Inc. RUTH-US % 12.9% 95.9% 10.6% 19.5% 1.9x 11.8x 25.2x 1.7x 11.0x Fogo de Chão, Inc. FOGO-US % 35.8% 92.4% 10.1% 22.3% 1.7x 9.2x 15.8x 1.6x 9.1x Del Frisco's Restaurant Group, Inc. DFRG-US % 0.0% 80.9% 10.2% 13.7% 0.9x 8.1x NM 0.9x 8.0x J. Alexander's Holdings, Inc. JAX-US % 18.0% 93.1% 6.7% 13.6% 0.8x 8.1x 22.9x 0.7x 7.0x The ONE Group Hospitality, Inc. STKS-US % 15.1% 88.7% NM 12.5% 1.1x 13.7x NM 1.0x 9.7x Bravo Brio Restaurant Group, Inc. BBRG-US % 60.0% 75.5% NM 6.3% 0.2x 3.8x NM NM NM Price/ Margin Rev EPS $ -7.4% -7.4% 82.6% 8.6% 47.8% 6.0x 12.7x 34.4x 5.4x 11.5x Restaurant Brands International, Inc. QSR-US $ 13, Texas Roadhouse, Inc. TXRH-US 4, % 9.7% 95.6% 12.4% 12.4% 1.8x 12.8x 31.4x 1.6x 12.6x Bloomin' Brands, Inc. BLMN-US 2, % 13.8% 97.7% (0.8%) 8.8% 0.8x 8.4x 24.0x 0.8x 8.8x Cheesecake Factory, Inc. CAKE-US 2, % 0.1% 71.8% 4.9% 9.7% 1.0x 9.0x 14.7x 1.0x 9.8x Dave & Buster's Entertainment, Inc. PLAY-US 1, % -24.3% 56.8% 12.1% 26.2% 1.8x 6.9x 14.7x 1.7x 7.3x Brinker International, Inc. EAT-US 1, % -7.1% 78.8% 0.9% 13.2% 1.0x 7.1x 13.9x 1.0x 7.5x Dine Brands Global, Inc. DIN-US 1, % 29.3% 82.3% 6.9% 28.4% 4.0x 11.8x NM 3.7x 11.0x Denny's Corp. DENN-US % 16.5% 94.6% 21.7% 18.5% 2.4x 13.7x 27.6x 2.1x 12.7x BJ's Restaurants, Inc. BJRI-US % 23.4% 94.4% 5.3% 11.1% 1.0x 9.4x 21.8x 1.0x 9.4x Red Robin Gourmet Burgers, Inc. RRGB-US % 2.8% 78.3% 0.5% 10.4% 0.7x 7.3x 25.1x 0.7x 7.1x Fiesta Restaurant Group, Inc. FRGI-US % -2.6% 73.0% 1.4% 5.6% 0.9x 9.2x NM 0.8x 9.0x Chuy's Holdings, Inc. CHUY-US % -6.6% 81.6% 12.6% 11.4% 1.2x 9.5x 15.4x 1.0x 10.0x Carrols Restaurant Group, Inc. TAST-US % -7.8% 77.5% 6.0% 8.7% 0.6x 7.5x 70.0x 0.7x 7.8x Price/ Margin Rev EPS $ 0.8% 0.8% 89.2% 13.9% 22.0% 3.6x 16.3x 19.1x 3.3x 13.9x Starbucks Corp. SBUX-US $ 81, Chipotle Mexican Grill, Inc. CMG-US 9, % 11.8% 64.8% 10.0% 9.4% 1.9x 18.0x 52.4x 1.8x 16.6x Shake Shack, Inc. SHAK-US 1, % -3.6% 87.8% 33.9% 15.5% 3.1x 16.9x NM 2.2x 16.7x Bojangles', Inc. BOJA-US % 17.4% 62.0% 1.6% 13.9% 1.2x 9.2x 7.4x 1.2x 11.1x El Pollo Loco Holdings, Inc. LOCO-US % -4.0% 64.0% 4.0% 12.0% 1.1x 8.0x 43.2x 1.1x 7.5x Potbelly Corp. PBPB-US % -2.0% 84.4% 3.1% 8.4% 0.6x 7.7x NM 0.6x 7.3x Zoe's Kitchen, Inc. ZOES-US % -13.6% 76.9% 17.4% 4.1% 1.0x 13.1x NM 0.9x 12.7x The Habit Restaurants, Inc. HABT-US % -7.9% 44.6% 22.4% 7.8% 0.6x 6.4x NM 0.5x 6.3x
11 Quarter YTD % of 52 Week High Margin Rev Price/ EPS McDonald's Corp. MCD-US $ 122,928 $ % -9.1% 87.5% (8.1%) 44.8% 6.6x 15.5x 24.5x 7.4x 14.7x Yum! Brands, Inc. YUM-US 28, % 4.3% 97.9% (24.9%) 33.0% 6.2x 18.6x 22.6x 8.7x 19.0x Domino's Pizza, Inc. DPZ-US 10, % 23.6% 99.0% 12.5% 21.3% 4.7x 23.0x 40.1x 4.5x 21.6x Dunkin' Brands Group, Inc. DNKN-US 4, % -7.4% 87.2% 54.9% 56.7% 8.6x 15.5x 15.7x 5.6x 15.9x The Wendy's Co. WEN-US 4, % 6.9% 99.1% 3.8% 34.4% 5.5x 16.2x 22.8x 5.4x 16.0x Jack in the Box, Inc. JACK-US 2, % -13.0% 75.5% (45.7%) 29.0% 2.7x 11.3x 23.2x 4.5x 13.6x Papa John's International, Inc. PZZA 1, % 2.1% 67.3% (0.3%) 10.6% 1.3x 11.8x 20.2x 1.4x 14.3x Four Corners Property Trust, Inc. FCPT-US 1, % -10.2% 85.6% 10.0% 76.7% 14.2x 18.5x 19.6x 12.8x 16.5x Wingstop, Inc. WING-US 1, % 21.2% 95.0% 41.7% 36.7% 14.2x 37.8x 50.8x 10.1x 33.3x Sonic Corp. SONC-US % -8.2% 84.0% 0.6% 27.5% 3.6x 11.0x 14.8x 3.7x 10.8x Del Taco Restaurants, Inc. TACO-US % -14.5% 64.8% 10.1% 15.1% 1.2x 8.4x 8.3x 1.1x 7.9x Papa Murphy's Holdings, Inc. FRSH-US % -9.7% 71.5% (24.8%) 16.6% 1.5x 9.3x NM 2.0x 8.8x Quarter YTD % of 52 Week High Margin Rev Price/ EPS JUST EAT Plc JE-GB $ 6,663 $ % -10.6% 77.0% 32.8% 29.5% 8.2x 28.4x NM 6.2x 21.5x Delivery Hero AG DHER-DE 8, % 19.1% 96.4% NM NM 23.7x NM NM 7.7x NM GrubHub, Inc. GRUB-US 8, % 41.3% 90.3% 47.7% 22.9% 12.8x 59.5x NM 8.8x 33.0x Yelp, Inc. YELP-US 3, % -0.5% 86.3% 17.1% 7.4% 3.1x 47.1x 23.9x 2.8x 14.5x Blue Apron Holdings, Inc. APRN-US % -50.4% 18.2% (1.1%) (15.5%) 0.4x NM NM 0.3x NM
12 10.0x 8.0x 6.0x 9.0x 9.0x 9.2x 8.3x 7.5x 7.5x 7.8x 7.3x 6.4x 6.6x 6.5x 6.4x 6.7x 5.5x 5.8x 5.9x 4.0x 2.0x 0.0x $10-25mm $25-50mm $50-100mm $ mm


13
14 Amount Date Target Buyer(s) Segment Rev 3/26/2018 Azure Bottling LLC Isobev, Inc. Non-Alcohol /21/2018 Es Mi Tiempo, Inc. CREO Capital Partners LLC; Flagship Food Ingredients & Flavors Group LLC 3/20/2018 Culinarte Marketing Group LLC Kainos Capital LLC Ingredients & Flavors /20/2018 Green Chef Corp. HelloFresh SE Ingredients & Flavors /15/2018 Concord Premium Meats Ltd. Premium Brands Holdings Corp. Proteins /15/2018 Huron Produce Ltd. Lipman Produce, Inc. Produce /15/2018 The Meat Factory Ltd. Premium Brands Holdings Corp. Proteins /15/2018 Country Prime Meats Ltd. Premium Brands Holdings Corp. Proteins /15/2018 Frandon Seafood, Inc. Premium Brands Holdings Corp. Proteins /14/2018 Circle Foods LLC Ajinomoto Foods North America, Inc. CPG Foods /14/2018 Juice It Up! Franchise Corp. SJB Brands, LLC Non-Alcohol /9/2018 Coca-Cola Refreshments Canada Co. Shareholders Non-Alcohol /8/2018 Bravo Brio Restaurant Group, Inc. Spice Private Equity AG Restaurants x 3.79x 3/8/2018 DAVIDsTEA, Inc. Rainy Day Investments Ltd. Non-Alcohol /8/2018 San Luis Spirits, Inc. Empresario LLC Alcohol /8/2018 TRUFood Provisions Co. US Highland, Inc. Restaurants /1/2018 Lentz Milling Co. Platinum Equity LLC Ingredients & Flavors /7/2018 Prairie Mushrooms (2010) Ltd. Highline Produce Ltd. Produce /28/2018 Royal Hawaiian Macadamia Nut, Inc. Buderim Group Ltd. CPG Foods /28/2018 Yuengling's Ice Cream Corp. Seguin Natural Hair Products, Inc. CPG Foods /27/2018 LA Mexicana Food Products Blue Point Capital Partners LLC; Italian Rose CPG Foods Gourmet Products, Inc. 2/26/2018 The Wendys Co Restaurants JAE Restaurant Group LLC Restaurants /22/2018 Wildnorth Fishery Ltd. KR Investment Ltd. Proteins /22/2018 Braaitime LLC Stryve Foods LLC Proteins /21/2018 Aviation American Gin Aviation American Gin (Reynolds) Alcohol /21/2018 NutraDried LLP EnWave Corp. CPG Foods x - 2/21/2018 The Wendy's Co Restaurants Meritage Hospitality Group, Inc. Restaurants /20/2018 Del Monte Canada, Inc. Bonduelle SA Produce x - 2/20/2018 TCHO Ventures, Inc. Ezaki Glico Co., Ltd. CPG Foods /20/2018 Fogo de Chão, Inc. Rhône Capital LLC Restaurants /20/2018 Long Island Brand Beverages LLC Shareholders Non-Alcohol /19/2018 Grabbagreen Franchsing LLC MTY Food Group, Inc. Restaurants /15/2018 Threecaf Brands Canada, Inc. - Franchise Business MTY Food Group, Inc. Restaurants /15/2018 CSM Bakery Solutions LLC - Multifoods Brand Pamplona Capital Management LLP; Ingredients & Flavors BakeMark USA LLC 2/14/2018 3v Group The SHS Group Ltd. Ingredients & Flavors /14/2018 United Restaurant Group, Inc. United Restaurant Group International, Inc. Restaurants /14/2018 Papa Gino's, Inc. Barington Hilco Acquisition Corp. Restaurants /13/2018 Smashburger Master LLC Jollibee Worldwide Pte Ltd.; Bee Good, Inc. Restaurants /12/2018 Crystal Rock Holdings, Inc. Cott Corp. (Canada) Non-Alcohol x 8.01x 2/7/2018 Marine View Beverage, Inc. Meritage Group LP; CoHo Distributing LLC Alcohol /6/2018 Mann Packing Co., Inc. Del Monte Fresh Produce N.A., Inc. Produce x - 2/5/2018 Huddle House, Inc. Elysium Management Restaurants /5/2018 San Diego Farmers Outlet, Inc. Royalty Foods LLC Proteins /2/2018 Atoka Cranberries, Inc. Ocean Spray Cranberries, Inc. Produce /2/2018 Burnette Foods, Inc. - Maraschino Cherry Business Seneca Foods Corp. Produce /1/2018 Dole Food Co., Inc. Total Produce Plc Produce x 2.81x 2/1/2018 Aryzta LLC - Chicago Cloverhill Bakery Facilities Hostess Brands LLC Ingredients & Flavors /1/2018 Aryzta AG - Cicero Facility Bimbo Bakeries USA, Inc. Ingredients & Flavors /1/2018 CHEHALEM Winery Chehalem Winery (Stoller) Alcohol /1/2018 Becton Dickinson Malaysia, Inc. Sunny Sky Products LLC CPG Foods /31/2018 The Wendy's Co Restaurants Meritage Hospitality Group, Inc. Restaurants - - -
15 Amount Date Target Buyer(s) Segment Rev 1/31/2018 Intergalactic Foods LLC Platinex, Inc. CPG Foods /31/2018 Green Plate Kitchen, Inc. Celebrate Brands LLC CPG Foods /30/2018 Minsa Corp. Bunge North America, Inc. Ingredients & Flavors /30/2018 Biltong USA Stryve Foods LLC Proteins /30/2018 California Natural Products Inc Wind Point Advisors LLC; Gehl Foods LLC Ingredients & Flavors /29/2018 Dr Pepper Snapple Group, Inc. * Keurig Green Mountain, Inc. Non-Alcohol 25, x 16.05x 1/29/2018 General Distributors, Inc. * CoHo Distributing LLC Alcohol /25/2018 Iron City Brewing Co. Iron City Brewing Co. (Forrest) Alcohol /23/2018 Keg Restaurants Ltd. Cara Operations Ltd. Restaurants /22/2018 Reallygoods LLC * EVOLVE Brands LLC CPG Foods /22/2018 Supernola * EVOLVE Brands LLC CPG Foods /18/2018 The Wendy's Co. - 5 Restaurants Meritage Hospitality Group, Inc. Restaurants /17/2018 JBS Five Rivers Cattle Feeding LLC Ospraie Management LLC; Pinnacle Asset Management LP; Arcadia Asset Management, LLC Proteins /17/2018 Avión Spirits LLC Pernod Ricard USA LLC Alcohol /16/2018 Nestle SA - US Confectionery BU * Ferrero SpA CPG Foods 2, /16/2018 Chicago Custom Foods LLC Highlander Partners LP CPG Foods /15/2018 Tamarack Cellars Vintage Wine Estates, Inc. Alcohol /10/2018 Caskers LLC Speedinvest GmbH; Wefunder, Inc.; Flaviar, Alcohol Inc. 1/10/2018 Pennant Foods LLC W.K.S Restaurant Corp. Restaurants /9/2018 Atlanta Cheesecake Co. Gryphon Investors, Inc.; Dessert Holdings CPG Foods /8/2018 ACRE Wines Shareholders Alcohol /5/2018 The Icelandic Milk & Skyr Corp. * Groupe Lactalis SA CPG Foods - - -
Date Target Buyer(s) Segment ($ in Mil) Rev EBITDA 3/20/2018 Green Chef Corp. HelloFresh SE Ingredients & Flavors - - -
 Segment ($ in Mil) Rev EBITDA 3/20/2018 Green Chef Corp. HelloFresh SE Ingredients & Flavors - - -") 20 15 10 5-10 7 15-9 7 10-15 - Financial 14% Strategic 86% Amount Date Target Buyer(s) Segment Rev 3/20/2018 Green Chef Corp. HelloFresh SE Ingredients & Flavors - - - 3/8/2018 Bravo Brio Restaurant Group,
20 15 10 5-10 7 15-9 7 10-15 - Financial 14% Strategic 86% Amount Date Target Buyer(s) Segment Rev 3/20/2018 Green Chef Corp. HelloFresh SE Ingredients & Flavors - - - 3/8/2018 Bravo Brio Restaurant Group,
Date Target Buyer(s) Segment ($ in Mil) Rev EBITDA 12/2/2016 Victoria Fine Foods LLC B&G Foods, Inc. CPG Foods $ x 7.80x
 Segment ($ in Mil) Rev EBITDA 12/2/2016 Victoria Fine Foods LLC B&G Foods, Inc. CPG Foods $ x 7.80x") 20 15 10 5-15 9 17 3 3 7 1 6 1 1 Financial 14% Strategic 86% Amount Date Target Buyer(s) Segment Rev EBITDA 12/2/2016 Victoria Fine Foods LLC B&G Foods, Inc. CPG Foods $70.00 1.70x 7.80x 11/29/2016 GNP
20 15 10 5-15 9 17 3 3 7 1 6 1 1 Financial 14% Strategic 86% Amount Date Target Buyer(s) Segment Rev EBITDA 12/2/2016 Victoria Fine Foods LLC B&G Foods, Inc. CPG Foods $70.00 1.70x 7.80x 11/29/2016 GNP
Industry Observations September 30, Food and Beverage Industry
 Industry Observations September 30, 2018 Food and Beverage Industry Select Food and Beverage Public Company Industry Data (USD in millions, except per share data) Market Data Operating Data Forward Estimates
FOOD & BEVERAGE MONTHLY DASHBOARD AUGUST 2017 STRATEGIC & CAPITAL ADVISORY FOR CONSUMER COMPANIES
 FOOD & BEVERAGE MONTHLY DASHBOARD AUGUST 2017 STRATEGIC & CAPITAL ADVISORY FOR CONSUMER COMPANIES WWW.CODYPEAKADV.COM Sep-16 Oct-16 Nov-16 Dec-16 Jan-17 Feb-17 Mar-17 Apr-17 May-17 Jun-17 Jul-17 Aug-17
Restaurant Monthly Update. M a y
 Restaurant Monthly Update M a y 2 0 1 7 1 Market Update Duff & Phelps Restaurant Monthly Update May 2017 KEY I N F O R M A T I O N April restaurant survey data indicated a -1.0% decline in same-store sales
Restaurant Monthly Update. J a n u a r y
 Restaurant Monthly Update J a n u a r y 2 0 1 8 1 Market Update Duff & Phelps Restaurant Monthly Update January 2018 KEY I N F O R M A T I O N December restaurant survey data indicated a 0.3% improvement
Restaurant Monthly Update. S e p t e m b e r
 Restaurant Monthly Update S e p t e m b e r 2 0 1 7 1 Market Update Same-store sales (SSS) declines worsened in July and August versus the prior three months. July restaurant survey data indicated a -2.8%
Industry Update: Foodservice Equipment Manufacturing
 Industry Update: Foodservice Equipment Manufacturing Winter 2018 2018 League Park Advisors 1100 Superior Avenue East Suite 1700 Cleveland, OH 44114 216.455.9985 PHONE 216.455.9986 FAX www.leaguepark.com
Recapitalizations of Franchisors: Partnership Considerations
 Recapitalizations of Franchisors: Partnership Considerations Executive Summary Bird Dog Capital Group, LLC ( Bird Dog ) is pleased to share with you our thoughts on considerations to evaluate when choosing
Restaurant Monthly Update. J u n e
 Restaurant Monthly Update J u n e 2 0 1 7 1 Market Update May restaurant survey data indicated a 1.1% decline in same-store sales and 3.0% decline in traffic. Although industry same-store sales have remained
DealReader Restaurants
 DealReader Restaurants 1H 2018 Selected Upcoming Industry Events Western Foodservice & Hospitality Expo (August 19-21, 2018 Los Angeles, CA) Restaurant Finance Monitor s Restaurant Finance & Development
Contract Manufacturers for Food & Beverage: In-demand Assets
 Contract Manufacturers for Food & Beverage: In-demand Assets Over the last 25 years, contract manufacturers of food & beverage products (often called co-packers) were considered much less attractive assets,
The IAA 80, the Unigrains indicator of agrifood stocks listed in Europe
 2 nd Quarter 2018 Economic situation The IAA 80, the Unigrains indicator of agrifood stocks listed in Europe 2 nd quarter 2018: key points During the 2 nd quarter 2018, the IAA 80 rose 3.7% while the European
RESTAURANTS INDUSTRY UPDATE JUNE
 www.harriswilliams.com Investment banking services are provided by Harris Williams LLC and Solebury Capital LLC, registered broker-dealers and members of FINRA and SIPC, and Harris Williams & Co. Ltd,
IAA 80: the Unigrains indicator of agri-food stocks listed in Europe
 j-07 j-08 j-09 j-10 j-11 j-12 j-13 j-14 j-15 j-16 j-17 2 nd quarter, 2017 Economic situation IAA 80: the Unigrains indicator of agri-food stocks listed in Europe Highlights of the 2 nd quarter, 2017 The
ALCOHOLIC BEVERAGE MONTHLY DASHBOARD MAY 2017 STRATEGIC & CAPITAL ADVISORY FOR CONSUMER COMPANIES
 ALCOHOLIC BEVERAGE MONTHLY DASHBOARD MAY 2017 STRATEGIC & CAPITAL ADVISORY FOR CONSUMER COMPANIES WWW.CODYPEAKADV.COM May-1 Jun-1 Jul-1 Aug-1 Sep-1 Oct-1 Nov-1 Dec-1 Jan-17 Feb-17 Mar-17 Apr-17 May-17
The Restaurant Industry Is Evolving Your Key Performance Benchmarks Need to, Too
 The Restaurant Industry Is Evolving Your Key Performance Benchmarks Need to, Too Morningstar Equity Research R. J. Hottovy, CFA Consumer Equity Strategist +1 312-244-7060 rj.hottovy@morningstar.com 2018
QUARTERLY CHAIN RESTAURANT UPDATE
 QUARTERLY CHAIN RESTAURANT UPDATE BELLWETHER FOOD GROUP, Inc. DATE: December, 2015 TO: FROM: Manufacturing Friends & Colleagues Bellwether Food Group RE: Chain Restaurant Same Store Sales (SSS) 3rd Quarter,
IAA 80: the Unigrains indicator of agri-food stocks listed in Europe
 j-08 j-09 j-10 j-11 j-12 j-13 j-14 j-15 j-16 j-17 j-18 4 th quarter of 2017 Economic situation IAA 80: the Unigrains indicator of agri-food stocks listed in Europe Highlights of the 4 th quarter of 2017
QUARTERLY CHAIN RESTAURANT UPDATE
 QUARTERLY CHAIN RESTAURANT UPDATE BELLWETHER FOOD GROUP, Inc. DATE: April 2016 TO: FROM: Manufacturing Friends & Colleagues Bellwether Food Group RE: Chain Restaurant Same Store Sales (SSS) 4th Quarter,
$ BUY STARBUCKS CORPORATION (SBUX) Rena Kaufman. Valuation Methodology. Market Data. Financial Summary (7/1/2018) Profile. Financial Analysis
 Rena Kaufman. Valuation Methodology. Market Data. Financial Summary (7/1/2018) Profile. Financial Analysis") STARBUCKS CORPORATION (SBUX) Market Data Market Cap (intraday): $69,991M Enterprise Value (Aug 9, 2018): $74,898M Enterprise Value/EBITDA (ttm): 14.97x Rena Kaufman $51.88 - BUY Valuation Methodology Method
STARBUCKS CORPORATION (SBUX) Market Data Market Cap (intraday): $69,991M Enterprise Value (Aug 9, 2018): $74,898M Enterprise Value/EBITDA (ttm): 14.97x Rena Kaufman $51.88 - BUY Valuation Methodology Method
Restaurant Industry Update. September 2018
 Restaurant Industry Update September 2018 DISCLOSURE This presentation should not be considered in any way an offer to buy or sell a security. Buying or selling a security involves substantial risk and
LOGOS OF THE TOP 200 CHAIN RESTAURANTS
 LOGOS OF THE TOP 200 CHAIN RESTAURANTS ranked by U.S. systemwide foodservice sales 2017 data from Nation s Restaurant News 1. McDonalds 2. Starbucks Coffee 3. Subway 4. Taco Bell 5. Burger King 6. Wendy
1ST HALF 2017 CHAIN RESTAURANT UPDATE
 1ST HALF 2017 CHAIN RESTAURANT UPDATE BELLWETHER FOOD GROUP, Inc. DATE: September 2017 TO: FROM: Operator Friends & Colleagues Bellwether Food Group RE: Chain Restaurant Same Store Sales (SSS) First Half
Webinar Cage Free Egg Production. March 3, 2016 Chad Gregory President United Egg Producers
 Webinar Cage Free Egg Production March 3, 2016 Chad Gregory President United Egg Producers Overview of UEP & The U.S. Egg Industry United Egg Producers National farmer coop since 1968 with current membership
Financial 25% Strategic 75%
 8 6 4 2 3 2 3 6 3 4 3 Financial 25% - Strategic 75% Date Target Buyer(s) Segment Amount Rev EBITDA 6/6/2018 Rawlings Sporting Goods Co., Inc. MLB Advanced Media LP; The Seidler Outdoor Products 395.00
2016 Trends. January 2016
 2016 Trends January 2016 Purpose To streamline all the sources of 2016 info into one document Share trend info throughout the company and to our customers Understand the implications to AWI of these trends
Presentation to: ACG 101. November Casual Restaurant Industry
 Presentation to: ACG 101 Regarding: November 2015 Trends in the Fast Casual Restaurant Industry DISCLOSURE This presentation should not be considered in any way an offer to buy or sell a security. Buying
ALCOHOLIC BEVERAGE MONTHLY DASHBOARD MARCH 2018 STRATEGIC & CAPITAL ADVISORY FOR CONSUMER COMPANIES
 ALCOHOLIC BEVERAGE MONTHLY DASHBOARD MARCH 2018 STRATEGIC & CAPITAL ADVISORY FOR CONSUMER COMPANIES WWW.CODYPEAKADV.COM Mar-17 Apr-17 May-17 Jun-17 Jul-17 Aug-17 Sep-17 Oct-17 Nov-17 Dec-17 Jan-18 Feb-18
TOP 100 Retailers SECOND 100 Retailers There s a lot of potential here.
 TOP 100 Retailers SECOND 100 Retailers There s a lot of potential here. TOP 100 Retailers Rank Chain Latest Year Year Prior Year Vs. Prior 1 Dave & Buster s $11,268,400 $10,746,000 $10,000,000 4.86% 7.46%
DOLE FRITO LAY GENERAL MILLS GOOD HEALTH NATURAL PRODUCTS HERR'S INDIANA POPCORN KAR NUT / BUMBLE BEE KELLOGG'S KIND KLEMENT SAUSAGE CO.
 PASTRY ARYZTA - CLOVERHILL BROAD STREET BAKERY CAROLINA FOODS CHATTANOOGA BAKERY FLOWERS SPECIALTY GROUP FLOWERS/APPLE BAKING LITTLE DEBBIE SELECT BAKERY SNACKS BACK TO NATURE BARCEL BISCOMERICA BLUE DIAMOND
Brand Draw ABSOLUTE CHANGE MONTH-OVER-MONTH LIMITED SERVICE CHAIN OCTOBER BRAND DRAW. 1 McDonald's 20.3% +0.2% 2 In-N-Out Burger 19.3% +0.
 Brand Draw OCTOBER BRAND DRAW 1 McDonald's 20.3% +0.2% 2 In-N-Out Burger 19.3% +0.2% 3 Chick-fil-A 18.9% -0.1% 4 Culver's 18.2% -0.7% 5 Sonic Drive-In 14.4% -0.6% 6 Whataburger 13.8% +0.2% 7 Zaxby's 12.9%
2018 à la Carte. Review of Key 2018 Trends Within the Food & Beverage Space. KPMG Corporate Finance LLC. Q Food & Beverage M&A Newsletter
 2018 à la Carte Review of Key 2018 Trends Within the Food & Beverage Space KPMG Corporate Finance LLC Q1 2019 Food & Beverage M&A Newsletter 2018 KPMG Corporate Finance LLC, a Delaware limited liability
MPI. Industry Update Q Beverage Industry. Valuation Opinions & Transaction Advisory.
 Valuation Opinions & Transaction Advisory Industry Update Q3 2013 Beverage Industry www.mpival.com Contents 02 Industry Overview Consolidation, Decreasing Soda Consumption and Premiumization Trends 03
$1B+ Restaurant Chain Same Store Sales Data (y/y % Change) 2017 U.S. System Sales $'000 (6) Report Outline
 2017 U.S. System Sales $'000 (6) Report Outline") Concept Applebee's Buffalo Wild Wings Cheesecake Factory Chili's Grill & Bar (2) LongHorn (2) Olive Garden (2) Outback Red Robin Ruby Tuesday (2) T.G.I. Friday's Texas Roadhouse Casual Bob Evans (2) Cracker
Concept Applebee's Buffalo Wild Wings Cheesecake Factory Chili's Grill & Bar (2) LongHorn (2) Olive Garden (2) Outback Red Robin Ruby Tuesday (2) T.G.I. Friday's Texas Roadhouse Casual Bob Evans (2) Cracker
Grid 4a: Food industry pledges on marketing to children, as of December 2009
 Grid 4a: Food industry pledges on marketing to children, as of December 2009 As of December 2009 there were a total of 13 multi-company pledges, including: nine national (the World Federation of Advertisers
North America Restaurants Industry Primer
 North America Restaurants Industry Primer BI Restaurants, North America Dashboard Jennifer Bartashus Team: Food Retail BI Industry Analyst Michael Halen Team: Consumer Products BI Industry Analyst 1. BI
Industry Data Report
 Industry Data Report Menus & Promotions 2018 RR s Menu & Promotions analysis provides data for 56 chains (33 QSR and 23 FSR) including: (1) a 5-year history of total menu items (2013 2017); (2) new product
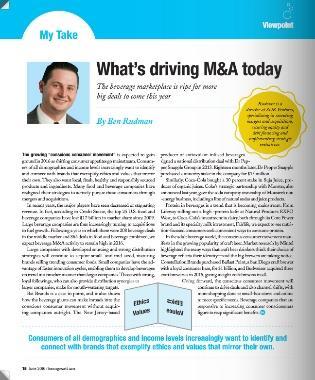
JUNE 2017
 JUNE 2017 WWW.NRN.COM TOP 100 Analysis The big shift: Consumers move away from casual dining As casual dining loses business, coffee chains and quick-service restaurants gather steam BY JONATHAN MAZE Consumers
Nutritional Content of Beverages
 Nutritional Content of Beverages Ranking by median sugar then by median calories then by maximum sugar then by maximum calories Includes sugar and calorie content per serving* of all sugary and diet drinks
16% 14% 14% 1,097 12% 10% ($mm) 400 3% Cardiovascular Health. Cognitive Health. Health. Expected CAGR
 400 3% Cardiovascular Health. Cognitive Health. Health. Expected CAGR") 1400 16% 1200 1000 1,097 14% 14% 12% ($mm) 800 600 400 3% 6% 7% 415 487 10% 8% 6% 4% 200 0 34 Cognitive Health Cardiovascular Health Eye Health Digestive Health 2% 0% Size Expected CAGR 8 6 4 2-4 3-6 1
1400 16% 1200 1000 1,097 14% 14% 12% ($mm) 800 600 400 3% 6% 7% 415 487 10% 8% 6% 4% 200 0 34 Cognitive Health Cardiovascular Health Eye Health Digestive Health 2% 0% Size Expected CAGR 8 6 4 2-4 3-6 1
Private Equity Investments
 Overview for Private Equity Investments Strategic capital and expertise for the wine industry Prepared: September 2011 Copyright 2010 Bacchus Capital Management In classical mythology, Bacchus is the god
Lunch for the Bunch* 1885 Lemen Rd. O Fallon Roy-el Catering* 8000 Concordia Rd. - Belleville
 Lunch for the Bunch* 1885 Lemen Rd. O Fallon 344-1921 Roy-el Catering* 8000 Concordia Rd. - Belleville 476-7722 Kaldi s Coffee (inside Schnucks`) 907 E. Highway 50 - O Fallon 632-5525 Starbucks Coffee
Panera Bread (NYSE: PNRA) Jay Aurora Tim Krauter Shane Riemer Michael Xu
 Jay Aurora Tim Krauter Shane Riemer Michael Xu") Panera Bread (NYSE: PNRA) Jay Aurora Tim Krauter Shane Riemer Michael Xu Street Perception Street Perception Facing maturation in the fast casual industry Maturity in FC Starbucks 1971 Panera 1981 Chipotle
Panera Bread (NYSE: PNRA) Jay Aurora Tim Krauter Shane Riemer Michael Xu Street Perception Street Perception Facing maturation in the fast casual industry Maturity in FC Starbucks 1971 Panera 1981 Chipotle
FOOD PROCESSING. Grant County. Industry Report
 FOOD PROCESSING Industry Report Grant County Grant County and the East Central Indiana region has a strong and steadily growing presence in the food processing industry. New additions to the local business
April 2013 CANNED FOOD A GLOBAL MARKET OVERVIEW TABLE 0F CONTENTS
 Though tastes of consumers as regards food are highly varying, there is hardly any difference in the qualities that they value. Topping the list of consumer demands for foods and packaging are freshness,
Profit before tax of US$764 million (US$712 million before exceptionals and profit on
 42 XII. Anexos Anexo 1 Relevantes Anuales Total lager beer volumes up 10% to 53 million hectolitres Profit before tax of US$764 million (US$712 million before exceptionals and profit on sale of subsidiary
2017 Veterans Day Free Meals and Discounts
 2017 Veterans Day Free Meals and Discounts This Version Last Updated: 11/07/2017 More Daily Updates: Free Meals - https://themilitarywallet.com/veterans-day-free-meals-and-discounts/ Retail Discounts -
Hain Celestial USA USA USA Canada Jun 2018 Jun 2018 Jun 2018 Jun Market. Vanilla Flavored Vegan Protein Dietary Supplement
 Search details: Search for products where Region matches North America and Full text search matches blueberries with word variants and Date Published is between Jun 2018 and Jun 2018 76 results found.
Duke Investment Club. Austin Lu, Seamus FitzPatrick, Zhou Fang, Vikas Kottamasu, Sachin Mitra, Tim Evans. Boston Beer Co. (SAM)
") Duke Investment Club Austin Lu, Seamus FitzPatrick, Zhou Fang, Vikas Kottamasu, Sachin Mitra, Tim Evans Boston Beer Co. (SAM) 1 Investment Thesis Recommendation: SELL Current Share Price: $159.87 (as of
Duke Investment Club Austin Lu, Seamus FitzPatrick, Zhou Fang, Vikas Kottamasu, Sachin Mitra, Tim Evans Boston Beer Co. (SAM) 1 Investment Thesis Recommendation: SELL Current Share Price: $159.87 (as of
4 2 - Financial 21% Strategic 79% Personal Care $ $
 10 8 6 4 2-7 6 3 2 1 8 6 Financial 21% Strategic 79% Amount Date Target Buyer(s) Segment Rev EBITDA 3/26/2018 The Finish Line, Inc. JD Sports Fashion; Pentland Group Activewear $480.34 - - 3/22/2018 Anna
Company Presentation. Opportunity Day 3Q2013 December, 2013
 Company Presentation Opportunity Day 3Q2013 December, 2013 Company Presentation Opportunity Day 3Q2013 December, 2013 Disclaimer Copyright 2013 MK Restaurant Group Public Company Limited. All rights reserved.
WESTERN 2018 Retailers Registrations as of
 24 Hour Fitness 7 ELEVEN, INC. 99 Only Stores AAA Northern California, Nevada & Utah Aaron's Inc. AKT Franchise LLC Albertsons Companies Aldi Inc Annex Brands, Inc. Arby'S Restaurant Group ARCO Ampm Andevor
Nut Recalls and Food Borne Illness Outbreaks in North America
 Nut Recalls and Food Borne Illness Outbreaks in North America Allschwill 21/2/2016 All raw agricultural commodities are exposed to microbial contamination in the environment. Among them pathogens such
FARE Exhibitor Prospectus. Where connections are made and business is done across multiple foodservice outlets,
 Where connections are made and business is done across multiple foodservice outlets, all under one roof at FARE Meet buyers and suppliers and grow your business at the only show of its kind FARE brings
Pigeon Forge Restaurants Available for the Holidays of 2018 info current as of
 Pigeon Forge s Available for the Holidays of 2018 info current as of 11-21-2018 Alamo Steakhouse 908-9998 4pm 9pm 11am 8pm Closed 11am 8pm Arby s 453-6966 Currently Closed Currently Closed Currently Closed
Investment Opportunity
 Golden Corral New 15 year Absolute Triple Net Lease With 10% escalations every 5 years 825 East State Road 44 Shelbyville, IN 46176 Investment Summary: This Golden Corral restaurant is is approximately
2035 S MERIDIAN AVE OKLAHOMA CITY, OKLAHOMA 73108
 RETAIL INVESTMENT GROUP, LLC 2035 S MERIDIAN AVE OKLAHOMA CITY, OKLAHOMA 73108 $2,985,000 CAP: 6.87% ACTUAL SITE - AUG 2017 INVESTMENT SUMMARY PRICE: $2,985,000 CAP: 6.87% PROPERTY INFORMATION Address:
Pigeon Forge Restaurants Available for the Holidays of 2018 info current as of
 Pigeon Forge s Available for the Holidays of 2018 info current as of 11-29-2018 Area code 865 Christmas Eve Christmas Day New Year s Eve Alamo Steakhouse 908-9998 11am 8pm Closed 11am 8pm Arby s 453-6966
Corby Spirit and Wine Limited - Strategy, SWOT and Corporate Finance Report
 Corby Spirit and Wine Limited - Strategy, SWOT and Corporate Finance Report Corby Spirit and Wine Limited - Strategy, SWOT and Corporate Finance Report The Business Research Store is run by Sector Publishing
Checkoff Foodservice Marketing. Fiscal Year 2011
 Checkoff Foodservice Marketing Fiscal Year 2011 Foodservice Goals Execute the priorities set forth in the Long Range Plan by building consumer demand across all U.S. restaurant segments Serve as the definitive
June 2016 North American New Blueberry-Containing Products
 June 2016 North American New Blueberry-Containing Products Estée Lauder Merrick Pet Care Kashi Sales Bai Brands 2-in-1 Foam Cleanser Real Chicken & Sweet Potato Recipe Natural Dry Food for Dogs Toasted
SUNFLOWER MARKETPLACE
 SUNFLOWER MARKETPLACE PRIME CLOVIS COMMERCIAL CORRIDOR RETAIL SPACE FOR LEASE Join These Tenants & Neighboring Tenants! Retail Shop Space Available:,830± SF; 2,3± SF; 3,400± SF NEC of Shaw & Peach Avenues
52,000 ADT. W. Madison Ave - 10,000 ADT
 For lease 500-550 N. Magnolia AVE EL CAJON CALIFORNIA 92020 New Ownership Excellent Retail/medical opportunity Opportunity 52,000 ADT 133,600 ADT Property Highlights Ground Lease or Build to Suit 20,000-55,321
1 79 LB LB. USDA Choice Bottom Round Roast LB. Value Pack HOT DEALS! only specials $ 800! and sign up for our. Boneless.
 THIS WEEK S BANKROLL 800! IF NOT WON LAST WEEK IF NOT WON LAST WEEK! Locally Owned, Union Employer visit our new,improved website MIDTOWNEMARKET.NET and sign up for our email only specials Whole Sliced
multibrand units in the U.S. NEW multibrand units in Multibrand units make up more than 17% of our total restaurant base in the U.S.
 A world of choice Yum! is the undeniable world leader in Multibranding innovation with over 3,000 combination restaurants in the U.S. accounting for an estimated $330 million in restaurant profits and
Coffee Consolidation Accelerates
 Coffee Consolidation Accelerates Sintercafé 2017 Jim Watson Senior Beverages Analyst James.Watson@Rabobank.com Rabo Securities 1 Rabobank: The World s Leading F&A Bank EUR 426bn outstanding capital with
Company Coverage. Country Coverage. Global Coverage. Regional Coverage
 Global Food Service Market: Analysis By Type (Full Service Restaurants, Cafe and Bars, QSRs, Fast Casual Restaurants, Others), By Full Service Restaurant (Fine Dining, Casual Dining), By Region, By Country
HISTORY CHILE S LEADING WINE PRODUCER. Public company since Main ownership in two families with a long-term vision and passion for wine.
 C O R P O R AT E P R E S E N TAT I O N 2 0 1 8 HISTORY CHILE S LEADING WINE PRODUCER Public company since 1933. Main ownership in two families with a long-term vision and passion for wine. FOUNDED IN PIRQUE
Autumn Press Conference October 19, Name of chairman
 Autumn Press Conference October 19, 2006 Disclaimer This presentation contains forward looking statements which reflect Management s current views and estimates. The forward looking statements involve
PAUL BONANNO JEFF RAMSAY JEFF BERGER (760) (760) (760)
 (760) (760)") 8302 WEST LYNWOOD STREET TOLLESON, ARIZONA PAUL BONANNO JEFF RAMSAY JEFF BERGER (760) 452-2402 (760) 452-2403 (760) 452-2404 Paul@NNNsearch.com Jeff@NNNsearch.com JeffBerger@NNNsearch.com FINANCIAL OVERVIEW
8302 WEST LYNWOOD STREET TOLLESON, ARIZONA PAUL BONANNO JEFF RAMSAY JEFF BERGER (760) 452-2402 (760) 452-2403 (760) 452-2404 Paul@NNNsearch.com Jeff@NNNsearch.com JeffBerger@NNNsearch.com FINANCIAL OVERVIEW
8. General Mills Inc
 Children s Food & Beverage Advertising Initiative Foods and Beverages that Meet the CFBAI Category-Specific Uniform Nutrition Criteria that May Be in Child-Directed Advertising I. Introduction The Children
QSR and Fast Casual Competition. Benchmark
 QSR and Fast Casual Competition Benchmark / Feb. 2017 Website: http://www.sense360.com Share the knowledge: 1 contents How To Use This Report 3 National Benchmarks Executive Summary (Premium) Share of
Thornton. Restaurant Guide
 Thornton Restaurant Guide 2018 American Applebee s 297 E 120th Ave 303-451-1414 Buffalo Wild Wings 10090 Grant St 720-929-9464 Buffalo Wild Wings 16540 N Washington St 303-524-3800 Cheddar s Scratch Kitchen
Safe Harbor Statements
 Jefferies Consumer Conference June 20, 207 Safe Harbor Statements Forward Looking Statements: This presentation contains forward-looking statements within the meaning of Section 27A of the Securities Act
Craft Breweries. Market Monitor Fall 2015 MOSS ADAMS CAPITAL LLC
 Market Monitor Fall 2015 MOSS ADAMS CAPITAL LLC Contents Industry Update 3 Relevant Transactions 5 Public Company Stock Performance 7 Moss Adams Overview 9 2 MOSS ADAMS CAPITAL LLC millions of barrels
APPROVED Matt Morgan Assistant Superintendent of Support Services. Darin Crawford Food Service Director. June 12, 2013.
 To: From: Date: Re: Matt Morgan Assistant Superintendent of Support Services Darin Crawford Food Service Director June 12, 2013 Dry Grocery Contract No. 13-04-3539 The following bids were received and
SUPPLIERS LISTED BY COUNTY FAIRFIELD COUNTY
 SUPPLIERS LISTED BY COUNTY FAIRFIELD COUNTY 12% IMPORTS 375 PARK AVE SPIRITS (DICTADOR RUM) 7 MILE SPIRITS (RUSKOVA VODKA) ALL NATURAL MAINE ROOT AMTEC INTERNATIONAL (ZYWIEC) ANCHOR BREWING ANCHOR DISTILLING
DRESS UP YOUR DINNER MORE HUGE DEALS! $4.99/lb. $9.99/lb. Premium Choice Manhattan Strip Roasts Save $6/lb.
 Experience the Goodness DRESS UP YOUR DINNER $9.99/lb. Premium Choice Manhattan Strip Roasts Save $6/lb. $1.79/lb. Tender Green Bunch Asparagus Save $2.20/lb. L&B Spiral Sliced Dry Honey Glazed MORE HUGE
1946 Bill Rosenberg invests $5,000, forms Industrial Luncheon Services 1948
 1946 Bill Rosenberg invests $5,000, forms Industrial Luncheon Services 1948 Bill Rosenberg opens donut restaurant Open Kettle on Southern Artery in Quincy, Massachusetts 1950 Open Kettle name changed to
CHSAA Fall Conference 2016 Schedule. Friday October 14, 2016
 CHSAA Fall Conference 2016 Schedule Friday October 14, 2016 8:00 9:00am Registration 9:00 9:30am Opening Ceremony 9:30 10:30am Keynote 10:35 11:20am Family Session #1 11:25 2:00 Rotations: Service Project
6841 Benjamin Franklin Drive Columbia, Maryland. Abundant free on-site parking with a parking ratio of 4.91 spaces per 1,000 square feet
 The Best in Columbia 6841 Benjamin Franklin Drive Columbia, Maryland 200,603 square foot seven-story building Space available from 10,000 to 90,294 SF Built in 2008 LEED Gold Certified I-95 visibility
North America New Blueberry Containing Products - September Jan - Sept 2013 Jan -Sept 2014 % change %
 North America New Blueberry Containing Products - September 2014 Mintel Global New Products Database - GNPD New Product Categories 2010> Jan - Sept 2013 Jan -Sept 2014 % change 890 789-11.34 % September
STARBUCKS CORPORATION: A COMPREHENSIVE CASE ON FINANCIAL STATEMENT ANALYSIS, FORECASTING AND VALUATION
 STARBUCKS CORPORATION: A COMPREHENSIVE CASE ON FINANCIAL STATEMENT ANALYSIS, FORECASTING AND VALUATION Suneel Udpa, School of Economics and Business Administration, Saint Mary s College of California,
QSR and Fast Casual Competition. Benchmark
 QSR and Fast Casual Competition Benchmark / July 2017 Website: http://www.sense360.com Share the knowledge: 1 contents How To Use This Report National Benchmarks Executive Summary (Premium) Share of Visits
Company name (YUM) Analyst: Roman Sandoval, Niklas Podhraski, Akash Patel Spring Recommendation: Don t Buy Target Price until (12/27/2016): $95
 Analyst: Roman Sandoval, Niklas Podhraski, Akash Patel Spring Recommendation: Don t Buy Target Price until (12/27/2016): $95") Recommendation: Don t Buy Target Price until (12/27/2016): $95 1. Reasons for the Recommendation One of the most important reasons why we don t want to buy Yum is the growth prospects of the company in
Recommendation: Don t Buy Target Price until (12/27/2016): $95 1. Reasons for the Recommendation One of the most important reasons why we don t want to buy Yum is the growth prospects of the company in
BEVERAGES CATEGORY (Up to 12 oz) Arizona Tea AZ Green Tea. Allied Products Mexican Coca Cola Glass. AZ Arnold Palmer Blk. Sprite Glass Bottle
 Arizona Tea AZ Green Tea. Allied Products Mexican Coca Cola Glass. AZ Arnold Palmer Blk. Sprite Glass Bottle") BEVERAGES CATEGORY (Up to 12 oz) Arizona Tea AZ Green Tea Allied Products Mexican Coca Cola Glass AZ Arnold Palmer Blk Sprite Glass Bottle AZ Raspberry Tea Fanta Orange Glass Bottle Campbell Sales Company
BEVERAGES CATEGORY (Up to 12 oz) Arizona Tea AZ Green Tea Allied Products Mexican Coca Cola Glass AZ Arnold Palmer Blk Sprite Glass Bottle AZ Raspberry Tea Fanta Orange Glass Bottle Campbell Sales Company
A TOPICAL TREND REPORT FROM
 BRAND FINGERPRINTS DATASSENTIAL UNCOVERS THE DNA BEHIND AMERICA S TOP RESTAURANT CHAINS A TOPICAL TREND REPORT FROM : SEPTEMBER 2015 EVERY BRAND HAS A UNIQUE FINGERPRINT... a set of factors that determine
MULTIBRANDING GREAT BRANDS. Dave Deno Chief Financial Officer & Chief Operating Officer
 MULTIBRANDING GREAT BRANDS Dave Deno Chief Financial Officer & Chief Operating Officer December 7, 2004 Changing the Development Game in the U.S.A. MULTIBRAND GREAT BRANDS More excitement for the consumer
Strong Holiday Performance Drives 5% Global Comp Growth, Global Traffic Increases 2%
 Starbucks Delivers Record Q1 Revenue and EPS Strong Holiday Performance Drives 5% Global Comp Growth, Global Traffic Increases 2% Revenues rise 13% to a record $4.8 billion; EPS of $1.30 includes a gain
City of St. Peters February 2017 Restaurant Inspections DATE RESTAURANT NAME ADDRESS
 City of St. Peters February 2017 Restaurant Inspections DATE RESTAURANT NAME ADDRESS 02/21/17 7-ELEVEN STORE #26923G 610 JUNGERMANN RD 02/13/17 94TH CONVENIENCE 4500 SOUTH ST PETERS PKWY 02/27/17 ALDI
DELIVERING REFRESHING SOFT DRINKS
 BEVERAGES DIVISION DELIVERING REFRESHING SOFT DRINKS Swire Beverages manufactures, markets and distributes refreshing soft drinks to consumers in Hong Kong, Taiwan, Mainland China and the USA. 46 215 PERFORMANCE
Cheryl Bachelder President and Chief Concept Officer. Mark Cosby Chief Operating Officer. Chicken QSR Sales
 Below: KFC has responded to customer needs by developing menu items that adapt to a portable, onthe-go society and consumers changing tastes. Below right: To fortify the eat at home experience, KFC will
Date Target Buyer(s) Segment ($ in Mil) Rev EBITDA 6/16/2017 Whole Foods Market, Inc. Amazon.com, Inc. Natural & Organic Foods 13, x 7.
 Segment ($ in Mil) Rev EBITDA 6/16/2017 Whole Foods Market, Inc. Amazon.com, Inc. Natural & Organic Foods 13, x 7.") 10 8 6 4 2-3 1 4 6 5 9 6 Financial 24% Strategic 76% Amount Date Target Buyer(s) Segment Rev EBITDA 6/16/2017 Whole Foods Market, Inc. Amazon.com, Inc. Natural & Organic Foods 13,463.80 0.69x 7.98x 5/8/2017
10 8 6 4 2-3 1 4 6 5 9 6 Financial 24% Strategic 76% Amount Date Target Buyer(s) Segment Rev EBITDA 6/16/2017 Whole Foods Market, Inc. Amazon.com, Inc. Natural & Organic Foods 13,463.80 0.69x 7.98x 5/8/2017
Brazos County Health Department Inspections Between 01/26/16 and 02/02/16 Establishmen Type Score
 Brazos County Health Department Inspections Between 01/26/16 and 02/02/16 Establishmen Type Score BRYAN BABYLON CAFÉ/NAYA INTERNATIONAL 700 S TEXAS AVE SUITE #100 77801 01/28/16 Routine 85 BEN MILAM SCHOOL
Brazos County Health Department 7/17/2018 Inspections Between 7/10/2018 and 7/17/2018 Establishment Type Score
 Brazos County Health Department 7/17/2018 Inspections Between 7/10/2018 and 7/17/2018 Establishment Type Score BRYAN BRIARCREST SHELL (WILD FLOWERSHELL LLC) 3151 BRIARCREST DRIVE 77802 7/12/2018 Routine
C O R P O R AT E S T R AT E G Y U P D AT E. October, 2018
 C O R P O R AT E S T R AT E G Y U P D AT E October, 2018 FORWARD LOOKING STATEMENTS This presentation contains forward-looking statements, that should be considered as good faith estimates. Such statements
INFLUENCER GENERATED CONTENT
 INFLUENCER GENERATED CONTENT COFFEE BRANDS BENCHMARK REPORT RTD & Cold Brew Coffee Will Continue To Generate Buzz in 2018 In 2017, 62% of Americans reported drinking coffee on a daily basis, up from 5%